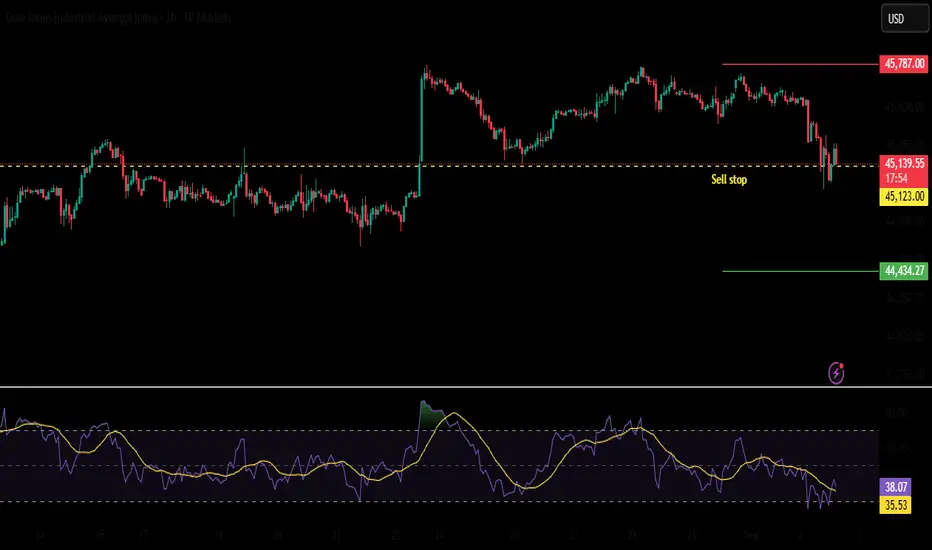
Dow Jones Overextended: Watching for an Institutional Unwind 📊 Dow Jones (US30) remains bullish 🟢, but in my view, it’s looking overextended 📈. Price has traded into a key level 🎯 where we could see a potential pullback, especially as we approach the end of the week 📅, when institutions and big money 💼 may begin unwinding positions.
👀 The play here is to watch for the high of the week/day ⏫ and look for a counter-trend reversal 🔄 that could drive price lower into the weekly close 📉.
⚠️ Keep in mind: Monday’s opening often creates a stop run 🛑 possibly offering a deeper pullback, giving us a double dose of liquidity grabs 💧. This sets the stage for a fairly deep retracement, which could present an opportunity to counter trend short if conditions align 🧩.
📌 My focus is on a break below the current range 🔓 as a trigger for potential entry.
⚠️ This is for educational purposes only and not financial advice 📚
DJ30.F trade ideas

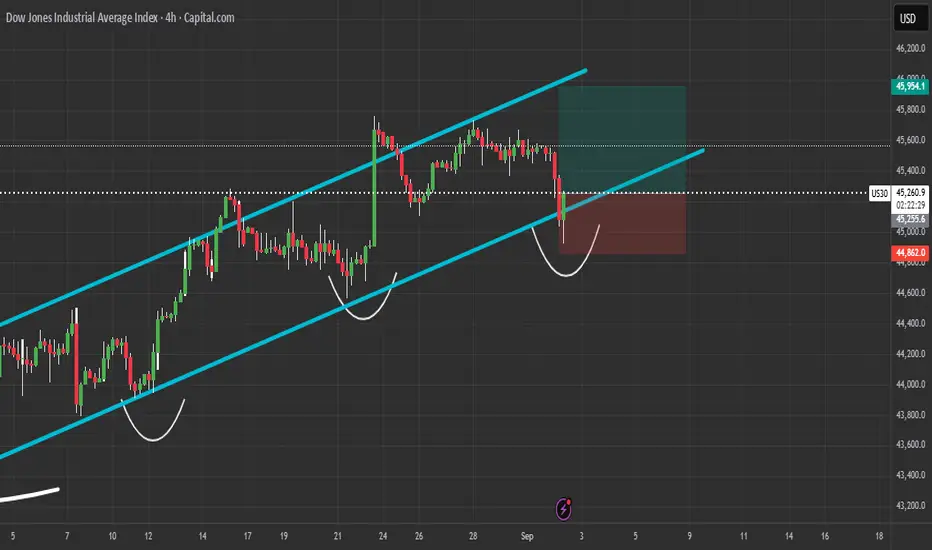
US30 Bullish Setup: From Pullback to Measured Moves📊 The US30 (Dow Jones) is trending bullish on the 4-hour chart ⏰. We’ve just seen a pullback into equilibrium ⚖️, and I’ve taken a long position 📈. In the video 🎥, I break down how I set my targets 🎯 using the Fibonacci retracement 🔢 — first identifying the equilibrium pullback, then projecting measured moves above for profit targets 🚀. (Not financial advice ⚠️)

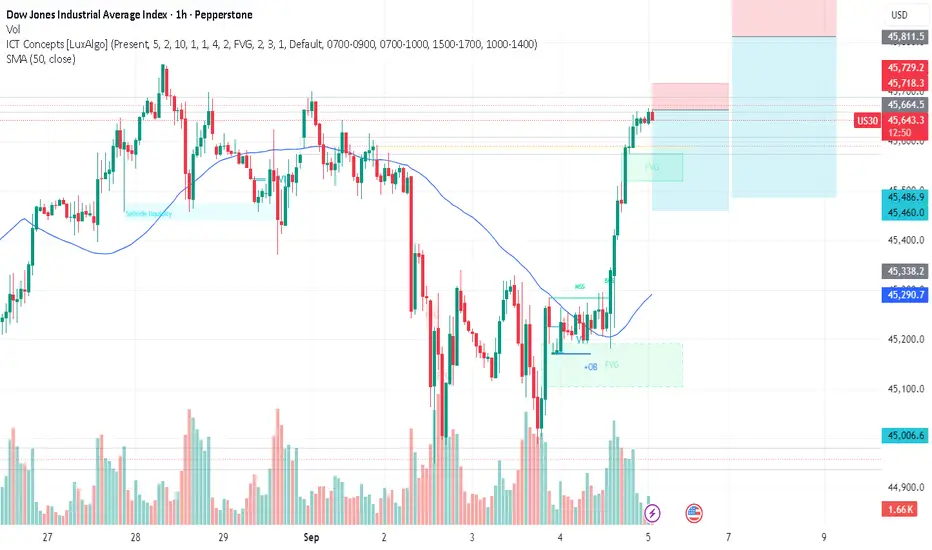
ICT CONCEPTS BLENDED W/SUPPORT AND RESISTANCE_SELLOn the weekly and Daily timeframes the next market move is not clear, following the trend we're bullish, but there is also a higher timeframe resistance has been met creating a higher high around the 45,774.20 level, and a move to the sell side is very possible, along with recent news events.

DOW/US30 - BEST STRATEGY OF THE YEAR - LETS GOTeam, carefully plan for tonight on NON FARM PAYROLL
HERE IS THE DATA
Weekly jobless claims increase 8,000 to 237,000
Continuing claims fall 4,000 to 1.940 million
Private payrolls increase 54,000 in August
Trade deficit widens 32.5% to $78.3 billion in July
Last month, the same day, market drop for two days over 1000 points.
PLEASE CAREFULLY structure this - DO SMALL VOLUME FOR THIS ONLY
Short now at 45645-45655 - I think the market look EXHAUSTED
STOP LOSS tight at 45680 or give more room at 45720
Target 1 at 45525-45500 - take 60%-70% partial and bring stop loss to BE
Target 2 at 45425-45380
OR WAIT FOR THIS ZONE TO KILL THE MARKET - 45800-45900 - stop loss at 46050
Target 1 - 45650 -45620
Target 2 - 45550-45520
LETS GO
DOW JONES Buy opportunity on oversold 4H RSI.Dow Jones (DJI) has been trading within a Channel Up since the July 31 High and yesterday hit its bottom (Higher Lows trend-line) and rebounded.
Every short-term break just below the 4H MA50 (blue trend-line) of this pattern since August 11, has been the most optimal buy opportunity. Technically as long as the 1D MA50 (red trend-line) holds, the medium-term trend remains bullish.
Given also that the 4H RSI made an oversold rebound, first since August 04, we have a strong buy signal currently, which based on the previous Bullish Legs of the pattern, can rise by at least +2.67%. As a result, our short-term Target is 46100.
-------------------------------------------------------------------------------
** Please LIKE 👍, FOLLOW ✅, SHARE 🙌 and COMMENT ✍ if you enjoy this idea! Also share your ideas and charts in the comments section below! This is best way to keep it relevant, support us, keep the content here free and allow the idea to reach as many people as possible. **
-------------------------------------------------------------------------------
💸💸💸💸💸💸
👇 👇 👇 👇 👇 👇

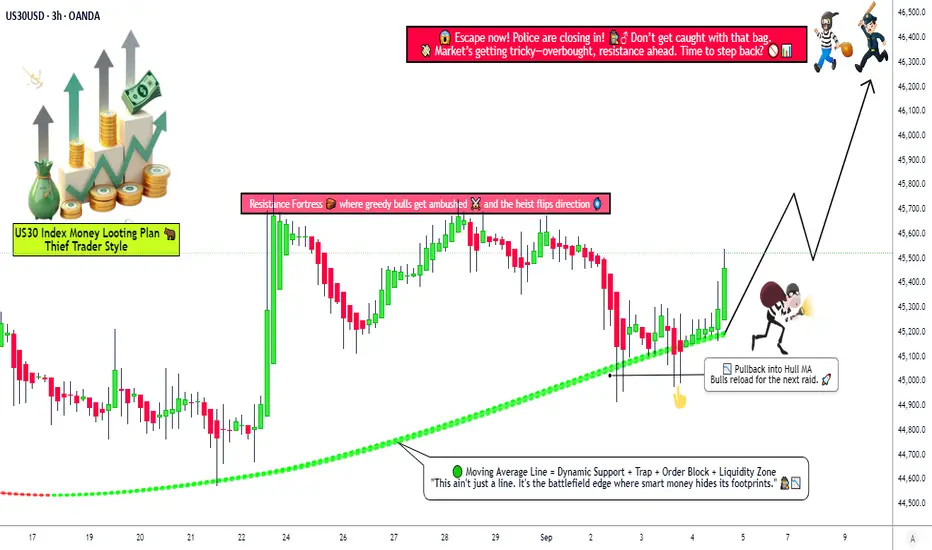
Dow Jones Bullish Strategy! Can the Market Break Higher?🚀 US30 Index Money-Making Plan (Swing / Day Trade) 📊
🧠 Trading Plan & Strategy (Thief Layer Style)
🚀 Approach: Bullish Hull Moving Average pullback plan — “bulls reloaded” for the next wave.
🎯 Entry (Layering Strategy): Multiple buy-limit layers → 45,200 • 45,300 • 45,400 • 45,500 (flexible to add more based on your own plan).
🛡️ Stop Loss: Reference point at 45,000. Adjust SL responsibly to match your personal risk tolerance & style.
💰 Target: Potential resistance zone (the “police barricade”) sits near 46,300. That’s where traders may consider taking profits.
📢 Note: This is an illustrative plan based on technicals — every trader should adapt TP/SL to their own strategy and risk appetite.
📊 US30 Market Report – September 4, 2025
📈 Current Price Snapshot
Trading near 45,000 points, up 0.05% today.
Strong monthly performance (+2.4%) and robust yearly gains (+17%).
Market showing resilience despite trade tensions.
😊 Retail Traders’ Sentiment
60% long vs 40% short → Tilted bullish.
Optimism driven by hopes for earnings growth & Fed rate cuts.
Caution remains due to tariff risks.
🏦 Institutional Traders’ Outlook
Cautiously bullish positioning.
Demand for equities continues, but with moderated exposure.
Buybacks + foreign inflows supporting price action.
🌡️ Overall Investor Mood
Neutral to positive tone.
Economic resilience balanced against policy uncertainty.
Healthy breadth across sectors, not just tech.
😨 Fear & Greed Index
Currently at 52 (Neutral).
Suggests balance — no extremes dominating.
Neutral setups often precede steady gains.
💹 Fundamental Score → 8/10
Strong corporate earnings (+12–13% growth projected next year).
Balance sheets remain solid.
AI & tech themes boosting key components.
Tariffs still a drag, but diversified exposure helps.
🌍 Macro Score → 7/10
US GDP growth cooling to 1.5%, but global rebound supports outlook.
Inflation ~2.9%; Fed rate cuts expected later.
Labor market stable, policy clarity could add upside.
🐂 Overall Market Outlook: Bullish Bias 📈
If support at 45,000 holds, potential move higher toward 46,000+.
Drivers: Strong earnings, Fed easing, broad rally.
Watch: Trade news headlines remain a key risk factor.
🔎 Why This Plan?
Hull MA pullback indicates momentum continuation.
Layered entries provide flexibility & better risk distribution.
Market sentiment + fundamentals align with bullish bias.
Resistance at 46,300 offers a clear take-profit zone.
📌 Related Pairs to Watch
CAPITALCOM:US30
FOREXCOM:SPX500
EIGHTCAP:NDQ100
TVC:VIX
TVC:DXY
✨ “If you find value in my analysis, a 👍 and 🚀 boost is much appreciated — it helps me share more setups with the community!”
#US30 #DowJones #Indices #SwingTrading #DayTrading #TechnicalAnalysis #StockMarket #TradingPlan #HullMA #LayeringStrategy
US30 ShortElite Analysis
I will be patient and wait for price to come back up to my OB (orange rectangle)
I will execute from that price point.
All confirmations have been met, now we wait for the market to come to us
Targeting lower liquidity pools

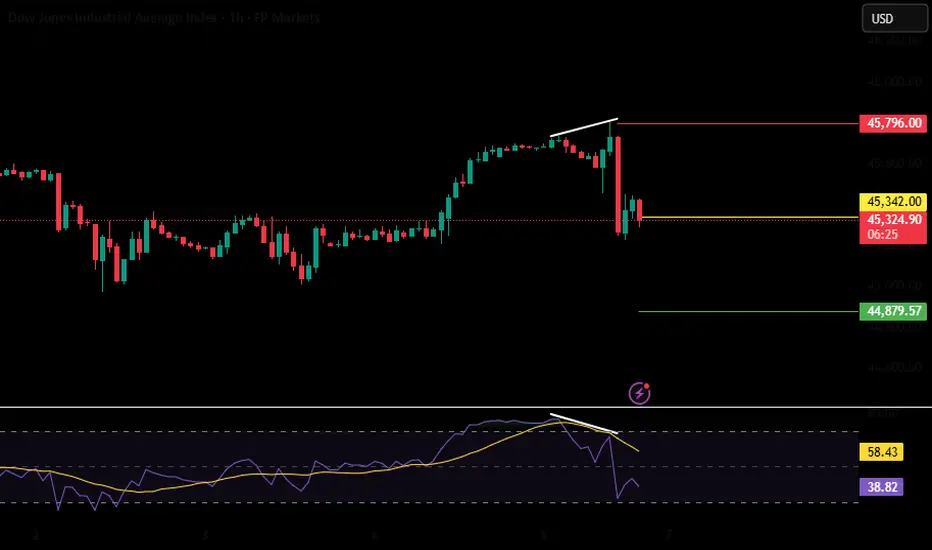
US30 | Bearish ContinuationAfter printing all time high and forming bearish divergence it is respecting its divergence and there are all signs point towards a bearish continuation pattern.
Us30 sell Trade Setup Observed
Entry: Around 45,609 (current price zone).
Stop Loss (SL): 45,659 (≈ 50 points above entry).
Take Profit (TP): Significantly lower, around 45,300 (green zone).
Risk/Reward Ratio: 3.12 → This is a good ratio (favorable reward relative to risk).
Position Size: Qty 2.
---
📊 Price Action
1. Strong Upward Impulse: Prior to your trade, the market had a strong bullish rally (large green candles).
2. Consolidation Phase: After the rally, price is ranging in a tight band (sideways movement), marked by small alternating candles.
3.Manipulation is over and distribution si about to start

Dow Jones (DJI) – 1H Technical OutlookDow Jones (DJI) – 1H Technical Outlook
Bias: Bearish while below 45,450.
Key Resistance: 45,350 – 45,450 (failure to break above keeps sellers in control).
Immediate Supports:
45,100
44,980 – 44,860
Major support at 44,700
📉 Primary Scenario:
If price remains capped below 45,450, a downward move towards 44,700 is likely after a minor corrective bounce.
📈 Alternative Scenario:
A breakout and sustained close above 45,500 would invalidate the bearish view and open the door for a rally towards 45,800 – 46,000.

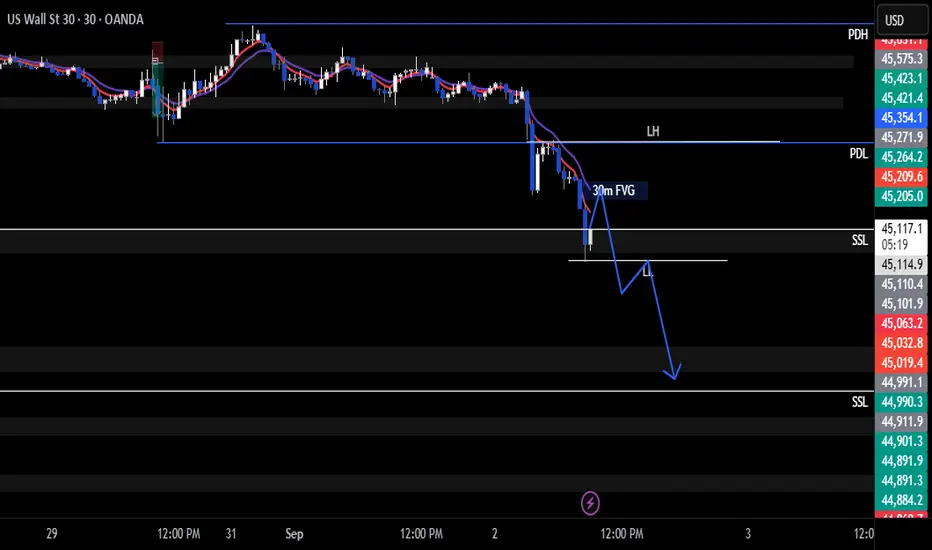
Us30 Trade Set Up Sep 2 2025FX:US30
www.tradingview.com
Price has dumped due to tariff talks and has swept PDL and a daily SSL so i am expecting price to pull back to test 30m FVG before continuing down
Dow Jones buy to 46000Fundamentals
- Fed rate cut this September and November, supporting equities growth. Lower interest rates means lower borrowing cost.
- Bond yields down due to government debt to high. Lower yields reduce the discount rate on future earnings, make stocks more attractive than bonds
- Tech giants Google and Apple lifting the indexes performance recently
Technical (Price Action)
- Support level at 44809.3 refined to 44748.9 30 min support

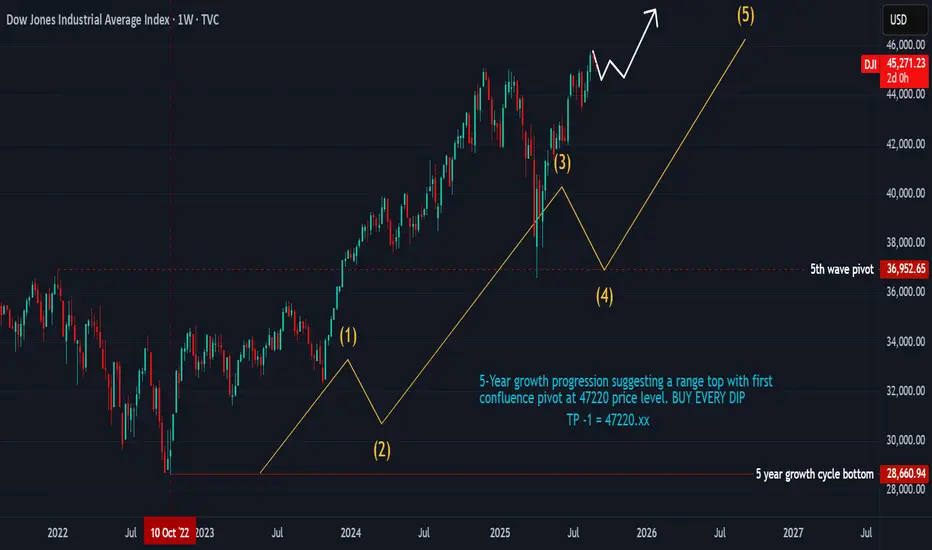
THE BIG TOP ... THE MID-CYCLE CORRECTION COMES SOONTHE BULL IS NOT DEAD YET...
Alternate Cycle progression puts 1942 - 1947, 1982 - 1987. and 2022 - 2027 on the same phase of a larger 20-year cycle. This is the smallest growth cycle that completes in approximately five (5) years. It forms the first section of every alternate 20-year cycle and carves out a very identical fractal. This fractal remerges every 40 to 43 years. This is the basis of Gann's 43-year cycle repetition.
1942 - 1947 5-year cycle
1982 - 1987 Cycle
2022 - 2027 Cycle in progression
Putting the price and time advances into a cumulative progression suggests that we are getting closer to a first correction at 47200 level. It also suggests that the next time and price for the current cycle is measurable and quantifiable with a very slim margin for error.
27th October is a major timeline to watch
Beyond that we have March 2026
TRADE PLAN:
We will close all buy entries in October
We will buy again in May 2026 for another 2-year bull cycle.
Follow for more updates
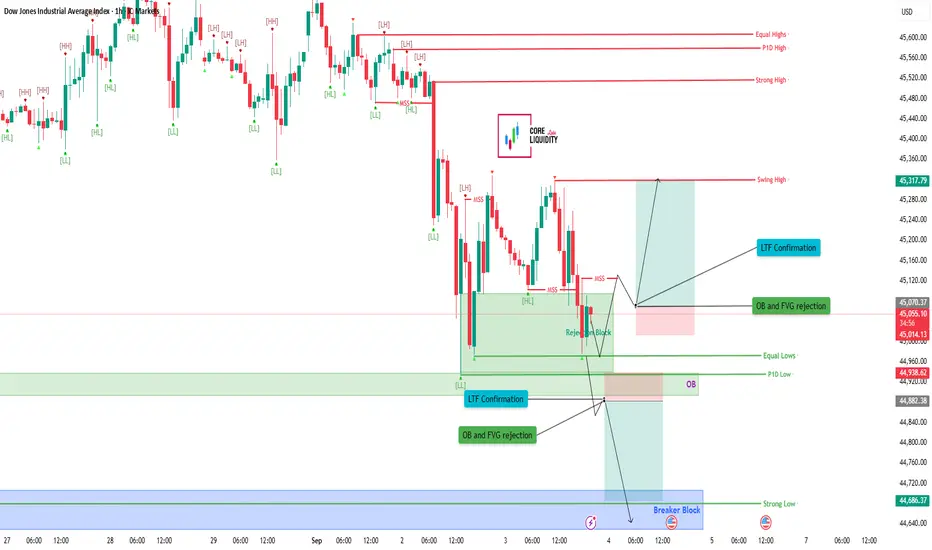
US30 – 1H | Testing Rejection Block & LTF Confirmation
Dow Jones is reacting from a rejection block with lower-timeframe confirmation showing. Market structure shift suggests possible retrace setups.
**Bullish Scenario:**
* Hold above 44,950–45,000 zone (OB & FVG support)
* LTF confirmation aligns with rejection block
* Upside targets: 45,320 swing high → 45,520 strong high
**Bearish Scenario:**
* Lose 44,950 and break below 44,900 P1D Low
* Continuation toward 44,700 breaker block → 44,680 strong low
* Deep downside if OB rejection fails
**Key Levels:**
* Resistance: 45,320 / 45,520 / 45,600
* Support: 44,950 / 44,900 / 44,700 / 44,680
💬 Will US30 hold rejection block for upside push, or break lower into the breaker block?
US30 Bearish Breakout!
HI,Traders !
#US30 made a bearish
Breakout of the rising support
Line and we are bearish biased
So we will be expecting a
Further bearish move down !
Comment and subscribe to help us grow !

Dow Jones Holds Pressure Under Pivot Zone 45,530–45,590US30 – Overview
The Dow Jones remains under bearish momentum, having stabilized in the bearish zone with downside potential toward 45,285.
Technical Outlook:
🔻 Bearish scenario: As long as price trades below the pivot zone 45,590 – 45,530, pressure will remain to the downside, targeting 45,430 → 45,285 → 45,100.
🔺 Bullish scenario: A reversal and stabilization above 45,590 would open the way to 45,680, and a confirmed breakout higher could extend toward 45,860.
Key Levels:
Pivot zone: 45,530 – 45,590
Support: 45,430 – 45,285 – 45,100
Resistance: 45,680 – 45,860
📌 Bias: Bearish below 45,530–45,590; bullish only above 45,590 with confirmation.

DOW JONES 4H BUY SIGNAL
DJI bouncing on the Channel Up bottom + oversold 4H RSI (first since Aug 04) ✅.
Every dip under the 4H MA50 has been the best entry — same setup now.
As long as the 1D MA50 holds, trend stays bullish 📈.
🎯 Short-term target: 46,100 (+2.67%)
Kaizo precision. Sniper buy zone activated. 🥷🔥

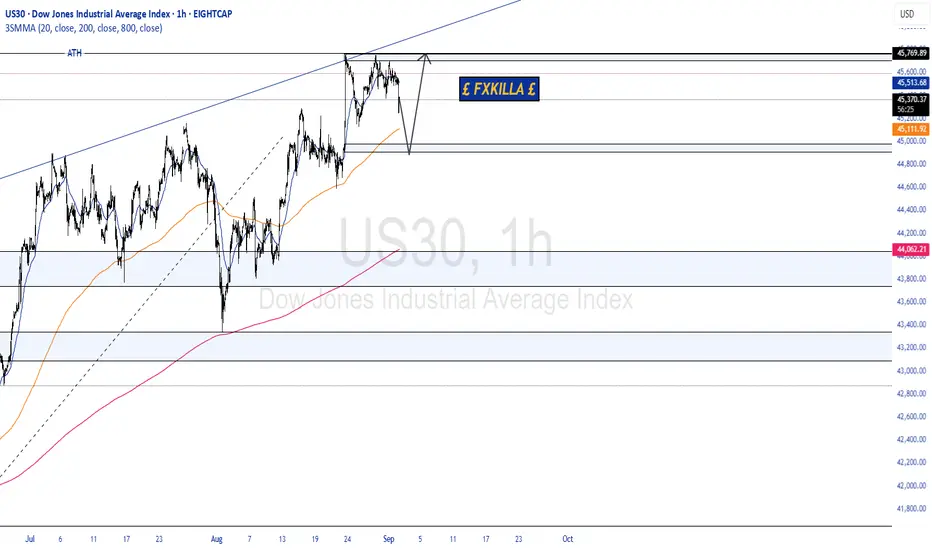
DOW JONES HIGH PROBABILITY SETUPS SOON!!🚨 US30 HIGH PROBABILITY SELL/BUY SETUPS 🚨
*Here We Can See Clearly The Next Potential Moves For US30 Coming Hours/Days.
* Keep Your Eyes Close On Your Trading Positions.
* Happy PIP Hunting Traders.
£ FXKILLA £
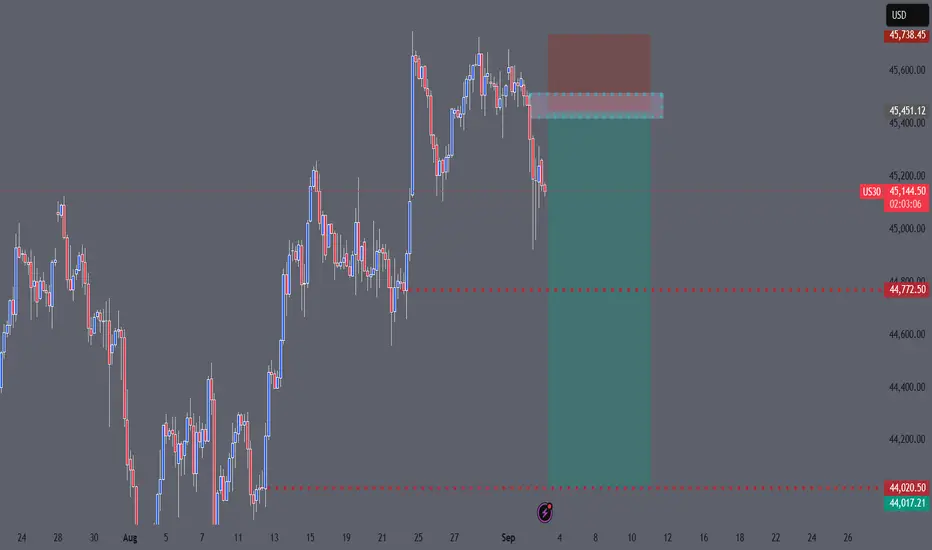
US30 WILL BLEEDWe are entering a short (sell) trade on US30 because the market failed to create new highs and reversed from a strong resistance/supply zone with good breakout, Structure and momentum now favor the downside. Targets are set at 44,770 and 44,020, with a stop above 45,740 to manage risk.
US30 | Bearish BreakoutAfter days of consolidation US30 has given a bearish breakout and now after LLs and LHs it will give a bearish trend confirmation.
US30 sellEven though the external reange is bullish, price internally is bearish and is reacting off a supply/demand level. Also using fibonacci you can see it reacting off a level as well. Zooming into the mico timeframes, there is bullish volume diminshment but price is going up.

US30 Bounce at Channel Support, Bullish Rejection in PlayUS30 is respecting the ascending channel support on the 4H chart, showing a clean bullish rejection wick after tapping the lower trendline.
Technical Highlights:
Ascending Channel: Price is holding the upward trend structure.
Rejection Pattern: Clear bounce from the lower boundary, forming a potential inverse head-and-shoulders pattern.
Key Levels:
Support: 45,000 – 45,200
Resistance: 45,800 – 46,200
Bias:
🟢 Bullish — As long as the 45,000 level holds, expect a retest of the upper channel boundary.
Trade Plan:
Entry: Off the channel support zone near 45,200
Target: 45,950 – 46,200
Invalidation: Break and close below 44,850
Sentiment:
Momentum favors continuation to the upside unless structure breaks below the trendline.
US30: The Market Is Looking Up! Long!
My dear friends,
Today we will analyse US30 together☺️
The in-trend continuation seems likely as the current long-term trend appears to be strong, and price is holding above a key level of 45,087.69 So a bullish continuation seems plausible, targeting the next high. We should enter on confirmation, and place a stop-loss beyond the recent swing level.
❤️Sending you lots of Love and Hugs❤️
