US30 2,700 PIPS TARGETJust found this Gem on Dow after bagging Bulls
I am betting on bears power if PA break below this support zone.
Massive swing trade..
DJ30.F trade ideas

Short on US30Looking at the daily time frame. Price is currently retesting the neckline from the daily double top. Looking to see price fall down to 38500. If you agree please like this post.

Setup A on US30 !Greetings !
The setup:
-RMI (Range Manipulation Initiation)
-An increase in liquidity.
-An interesting area.
-Optimal Fibo (OTE).
-No counter-trend.
- FVG (Fair Value Gap/Imbalance) *Optional
🚀 If you liked it and want more, don't hesitate to subscribe and Boost the publication!
Questions ? Leave a comment!


US30 (4.3.24) V1V1 - Current Market Structure - I am also doing a 2K to 10K challenge (live account) review my profile, use both links in the profile to follow along.


Dow Jones - Looking To Sell Pullbacks In The Short TermH4 - Bearish convergence.
Expecting short term bearish moves to happen here.
H1 - Strong bearish momentum.
Currently it looks like a pullback is happening.
Until the strong resistance zone holds I expect the price to move lower further after pullbacks.

How long will the fall of the stock market last?📊 According to the strong downward momentum of the price movement, if the range of 39100 units is broken and the price stabilizes below it, the price may fall to the range of 38900 units🎯, and in the case of the strength of the range of 38700 units🎯🎯.
📊 Otherwise, the possibility of price increase up to the range of 39400 units.

Dow Jones Industrial Averages Weekly Technical Analysis(1) We have witnessed a sharp fall from 29,500 level in Feb’20. This was almost 38% fall from the top. Market had gone in a oversold zone.
(2) Around 18,300 level, price found a support and bounced back from this level.
(3) With an upside rally, price managed to breakout its previous resistance.
(4) After the breakout, we have seen a sharp upside rally further and the price reached at 36,950 level.
(5) A corrective decline has been seen from there and the price started making lower highs and lower lows at reached to 28,800 level.
(6) Price again bounced back from there and gave a upside move.
(7) In this entire consolidation phase, a Cup & Handle chart pattern has been formed, which gave us positive indication.
(8) With a strong breakout of the Cup & Handle pattern, price started its journey upside.
(9) Currently the price is standing near its All Time High. More upside move is expected from here.

US30 LongPrice has pulled back into a daily zone which initiated the big move upto 40000. Formed a double bottom and rsi re-emerging from oversold. Lower time frames making higher lows and highs.

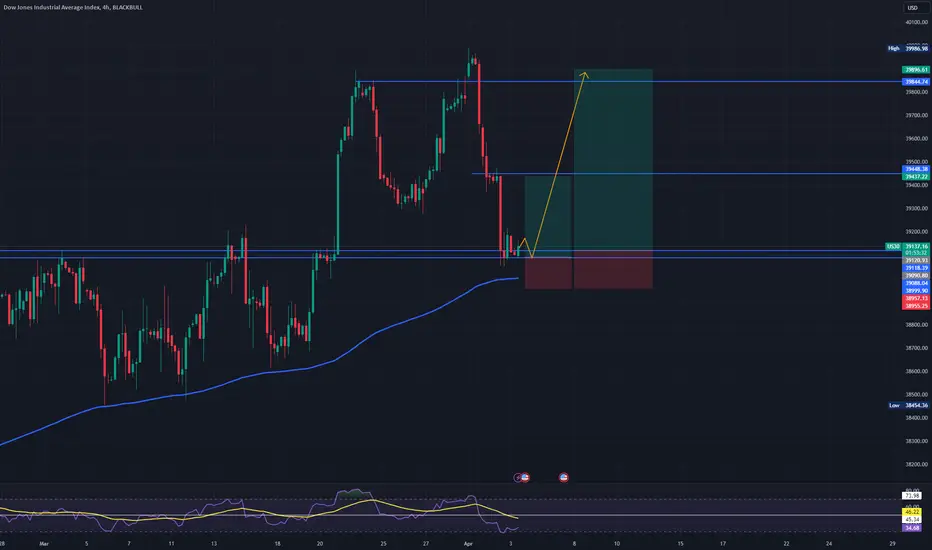
US30 | Ready to retest the price ceiling?The important support area for the US30 index is around the price of 39000. Considering the RSI is in the oversold range, an upward movement with targets at 39448 and 39844 can be expected. 📈
Possibility of uptrend According to the current correction, the upward trend will be delayed. Then the price is expected to move along the specified path and stabilize above the resistance zone.
If the price crosses the level of 161.8%, the continuation of the downward trend is likely

ICT liquidity sweep, market structure shift, tp relative = highsICT liquidity sweep, market structure shift, tp relative = highs


Long position Dow jones Dow jones has had a big drop down to trend line
Looking for a buy position today but being very aware of news coming out.

Bearish momentum to extend?Could the DJIA (US30) extend its current downturn beyond the pivot point and drop toward a support level at 38,693.81?
Pivot: 39,078.84
Support: 38,693.81
Resistance: 39,329.55
Risk Warning:
Trading Forex and CFDs carries a high level of risk to your capital and you should only trade with money you can afford to lose. Trading Forex and CFDs may not be suitable for all investors, so please ensure that you fully understand the risks involved and seek independent advice if necessary.
Disclaimer:
The above opinions given constitute general market commentary, and do not constitute the opinion or advice of IC Markets or any form of personal or investment advice.
Any opinions, news, research, analyses, prices, other information, or links to third-party sites contained on this website are provided on an "as-is" basis, are intended only to be informative, is not an advice nor a recommendation, nor research, or a record of our trading prices, or an offer of, or solicitation for a transaction in any financial instrument and thus should not be treated as such. The information provided does not involve any specific investment objectives, financial situation and needs of any specific person who may receive it. Please be aware, that past performance is not a reliable indicator of future performance and/or results. Past Performance or Forward-looking scenarios based upon the reasonable beliefs of the third-party provider are not a guarantee of future performance. Actual results may differ materially from those anticipated in forward-looking or past performance statements. IC Markets makes no representation or warranty and assumes no liability as to the accuracy or completeness of the information provided, nor any loss arising from any investment based on a recommendation, forecast or any information supplied by any third-party.
