DJ30.F trade ideas

US30 LONG Now US30 ini demand zone soon rebond !! dont forget put stop loss in wick ^^
happy trading!!!

DJ : Capitalizing on CPI-induced DJ VolatilityThe recent volatility in the financial markets has left many investors on edge, particularly with the DJ turning red in response to the latest Consumer Prices Index (CPI) news. As prices dipped in the last session, signaling a possible start to a bearish trend, it's crucial for investors to stay vigilant and adaptable.
The CPI data for March revealed an unexpected acceleration, with a 0.4% increase compared to expectations of a 0.3% slowdown. Furthermore, the yearly rate surged to 3.5%, up from 3.2% in the previous month. These figures underscore the persistent pressure on prices, deviating from the market's anticipation of three rate cuts in 2024, slated to begin in June.
Amidst this uncertainty, it's imperative for investors to remain proactive and seek out opportunities amidst the market turbulence. While the prospect of a bearish turn may seem daunting, it also presents potential openings for savvy traders.
One strategy to capitalize on market downturns is to employ sell limit orders within the formation of a bearish channel. By strategically placing these orders, investors can position themselves to take advantage of potential pullbacks in prices. This approach requires careful analysis of market trends and patterns, but it can yield lucrative returns for those who are diligent and patient.
🟢 Our Previous Winning Idea:


DOW JONES Secret Cycles you didn't know existed!On this analysis we examine the Dow Jones index (DJI) from the longer term perspective of the 1M time-frame. A lot of market participants has started to get nervous because of this month's pull-back and this is the best way to keep a calm mindset and view the price action objectively. In order to see if the market has a legitimate reason to panic or not, the answer can be given by observing the index from a cyclical point of view.
To begin with, the 1M MA50 (blue trend-line) has been the absolute multi-year Support level (since October 2010 only two candle closings below it, March 2020 COVID flash crash and recently the September 2022 inflation bottom). The market deems every pull-back towards it, a buy opportunity with the lowest possible risk.
Since the bottom of the 2008-2009 Housing Crisis, the 1M RSI bottoms on Lower Lows help us classify the multi-month phases into Cycles. The duration of each Cycle since the 1st, has been pretty consistent (39 to 48 months so far).
When the index closes a 1M candle below the 1W MA50 (red trend-line), the correction towards the 1M MA50 is usually under way. Also there is a striking consistency on the growth of each Cycle. As you can see, with the exception of the first (naturally the most aggressive since it was the start of the recovery after a Bear Cycle), every Cycle sees gains within the range of +70% and +77%.
As a result assuming the new Cycle follows a similar pattern, we can expect a minimum Target of 48850 (+70% from Low) and a Cycle ending on December 2025 (39 months from previous Low). Technically the index should peak around the the start of 2025, entering a volatile period towards the end of the year. This is as close to a projection one can make on such a long-term horizon and with tons of fundamental risks involved.
Where do you think Dow Jones will top at?
-------------------------------------------------------------------------------
** Please LIKE 👍, FOLLOW ✅, SHARE 🙌 and COMMENT ✍ if you enjoy this idea! Also share your ideas and charts in the comments section below! This is best way to keep it relevant, support us, keep the content here free and allow the idea to reach as many people as possible. **
-------------------------------------------------------------------------------
💸💸💸💸💸💸
👇 👇 👇 👇 👇 👇

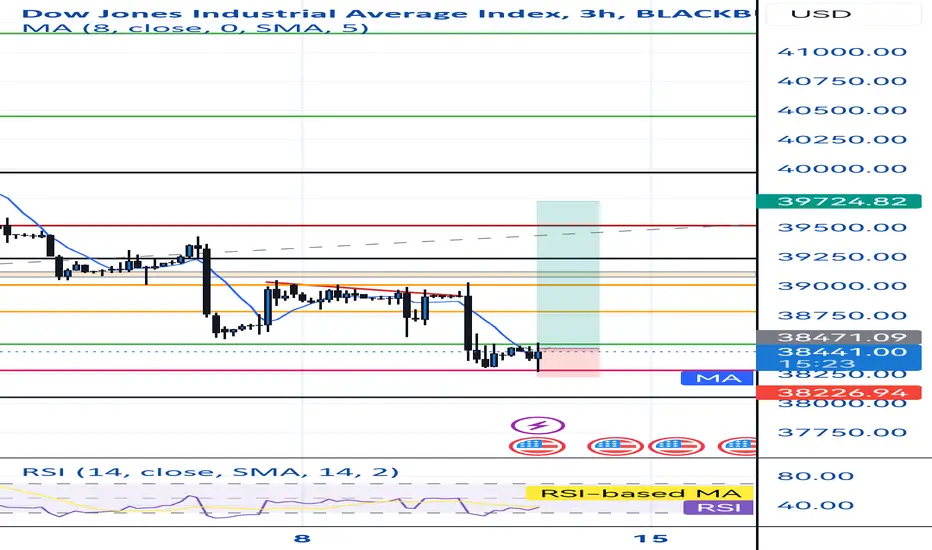
Dow Jones ready to bounceDow Jones 3hour chart. All time high reached at 40,000 and has since pulled back in a falling wedge formation. It has completed the 5th and final wave count last night at 38200. Possible bounce from here and a break through the upper part of the wedge to give us a run towards the all time high.
Not financial advice, just an observation.

check the trend It is expected that after the fluctuation to the resistance levels and the resistance trend line, a trend change will be formed and we will see the continuation of the downward trend. After crossing the previous floor, the continuation of the downward trend will be more likely
Consolidation above the level of 78.6% will stop the downward trend


US30 BREAKOUT & RETEST IDEAPrice has broken out of support zone and has retraced back to previous support and formed an engulfing candlestick on the 1 HR TF. If sellers continue to follow through and create a bearish candlestick formation on the 4hr TF, Will be looking to sell the market to shown daily support zone.

DJ30 has a strong downside momentum, could it drop further?Price is rising towards a resistance level which is a pullback resistance level and could reverse from this level to our take profit.
Entry: 38759.67
Why we like it:
There is a pullback resistance level which aligns with the 61.8% Fibonacci retracement.
Stop loss: 39081.03
Why we like it:
There is an overlap resistance level.
Take profit: 38139.92
Why we like it:
There is an overlap support level.
Please be advised that the information presented on TradingView is provided to Vantage (‘Vantage Global Limited’, ‘we’) by a third-party provider (‘Everest Fortune Group’). Please be reminded that you are solely responsible for the trading decisions on your account. There is a very high degree of risk involved in trading. Any information and/or content is intended entirely for research, educational and informational purposes only and does not constitute investment or consultation advice or investment strategy. The information is not tailored to the investment needs of any specific person and therefore does not involve a consideration of any of the investment objectives, financial situation or needs of any viewer that may receive it. Kindly also note that past performance is not a reliable indicator of future results. Actual results may differ materially from those anticipated in forward-looking or past performance statements. We assume no liability as to the accuracy or completeness of any of the information and/or content provided herein and the Company cannot be held responsible for any omission, mistake nor for any loss or damage including without limitation to any loss of profit which may arise from reliance on any information supplied by Everest Fortune Group.
Why we like it:
There

US30 Top Down Analysis[US30 Top Down Analysis
H4: Directinal Bias
Price broke structure and is bullish.
Looking for Buying positions from the
Supply Zone.
H1: Technical Analysis
CHoCH signals reversal to the upside.
This is confirmed by BOS.
Short term trade will sell into the Supply Zone.
H15: Short term trade Sell Limit place at M15 upply Zone,
SL above it and target H1 Demand Zone.
Long term trade Buy from H1 Demand Zone, SL below the
recent low, target the H4 Supply Zone.

US30 APRIL11'24 LONGIF Bears were to step in heavy i would bet on 50% of the retracement to be the best spotof the 1hr time frame.
the long entry in confluence with the daily 88.6% and the short idea seem to be currently in play.
on the 15 min time frame one can see that the tokyo lows were liquidated by the london market.
and the london lows were just liquidated by the ny market.
so is this a sweep of liquidity or a run on liquidity to continue lower?
we gonna find out on the next update.

US30 April 11 EOD update LONG 1h + 15mcurrently watching the market print up higher and respect bullish structure on the way.
lots of confluence for bears at 50% area from the recent swing down as it aligns with a pocket of liquidity from equal highs
this long entry is an idea based on the 15m timeframe and the daily time frame aligning.

US30 Doing The $$$$ DanceHere on the 1hr Chart, you see US30 fell starting Thursday 04 April @ 1000 AM PST.
It decreased from a price level of $39,230 to a price on or around $38,600 where it momentarily found price SUPPORT but subsequently several times later re-tested 'aka' returned back to and later broke on Wednesday 10 April @ 0500 AM PST.
Current Analysis:
Following that break in price value and break in the previous Market Structure, US30 has begun "CONSOLIDATING" aka "Doing The Money Dance!"
It's following this phase in Market Movement where our anticipatory market analysis will prove valid or not. For after or following a phase of Market Consolidation comes a break-out!
Either way, set your "HIGH Price Level ALERT @ $39,050" and "LOW Price Level ALERT @ $38,200" 'Set it and forget it' and allow the market to lead the way!
"Please be advised by no means is this financial advice! Trade responsibly and always limit your risk."
PLEASE REFER TO THE ILLUSTRATED CHART TO VIEW EACH OF MY LEVELS:
ENTRY/ STOP LOSS/ TAKE PROFIT
Follow @Peni2Dollarzfx

US30 APRIL11'24 BUY 4H + DSo the fibs ended up disrespecting 78.6% and kissed 88.6%
currently long from this level. i dont anticipate strong selling pressure until the highs get liquidated. until then im in this long idea. trailing on the lower time frames

US30: The First Selling Signs US30: The First Selling Signs
After a long time US30 confirmed an "Ascending Channel Pattern"
The price broke down from the channel thus confirming that a possible bearish wave
may happen soon.
Considering that we have the US CPI data tomorrow it is likely that we may see US30
moving down further as it is shown in the chart.
Strong support is found near 38190 and 37280
You may find more details in the chart!
Thank you and Good Luck!
❤️PS: Please support with a like or comment if you find this analysis useful for your trading day❤️

Start changing the trendWhen it hits the floor and starts an upward wave, it can probably move up to its ceiling and then fall

Analysis and Idea on US30 ChartDisclaimer: This is not financial advice. Prices can move in any direction, so manage your risk accordingly.
Situation Overview:
In the US30 chart, there has been a significant drop in the Consumer Price Index (CPI) recently, causing the price to hit a strong swing level.
Analysis:
Given this context, there's an expectation for an overall correction in price, followed by a bullish trend.
Trading Idea:
Entry Point: Buy above 38,470, especially after a confirmed breakout observed on lower timeframes.
Breakout Confirmation: A break above this level is likely, based on technical analysis.
First Target: Aim for a gain of 200+ points/pips.
Second Target: Similarly, target another 200+ points/pips.
Overall Target: The goal is to capture around 400 points in total.
Risk Management:
It's crucial to remember that this is just an idea and not financial advice. Prices can fluctuate unexpectedly, so it's essential to manage risk effectively.
By following these guidelines, traders can align their strategies with potential market movements while prioritizing risk management.

Us30 long 11/04Price has retraced into weekly support, and made an 88 percent retracement. Support formed, doubke bottom, 4hr csndle broke he previous ones high and is forming a bullish rejection. News came out mixed for the dollar so a bullish leg could be inbound
Are we in the last wave up in an Expanding Ending Diagonal?Check this out...
The strong wave from Oct. 2022 into the beginning of 2023 had the same structure and ended with an extension (See below: purple 12345 > Expanding Ending Diagonal).
We are now at the yellow arrow, only this one is in a wider setup (so it takes more time to complete).
Does history repeat with a last push up to somewhere between 39200-39600?


Hellena | DJI (4H): Long to the resistance area of 39419. Dear colleagues, the price has passed many points in the downward movement and at the moment I suppose that the price is completing the corrective wave "4" and very soon will start the upward movement in the wave "5". It is possible to update the low in the area of 38458 and then move to the resistance area of 39419. It is possible that the price will immediately start an upward movement, so I consider only long positions and will look for the best entries to this position.
Manage your capital correctly and competently! Only enter trades based on reliable patterns!

US30 2024/04/1115min bearish range, waiting op premium for possible shorts
also looking to go for buys possibly from A-low during London Sesh
