US30 Sell IdeaCAPITALCOM:US30 has broken the last Higher Low after forming bearish divergence on RSI indicating potential bearish move. Moreover, It has also broken bullish trendline by forming new Lower Low. We can look for sells between fib 50-75% levels.
DJ30.F trade ideas


US30 PLAYED OUT JUST EXACTLY AS I PREDICTED AS ALWAYSEven after CPI, the market on US30 did play out as i predicted, When it comes to analyzing the market, you don't have to tell me.

#us30 Daw Jones - closeday price attitudeHey Guyz...
wish u have a good day !!
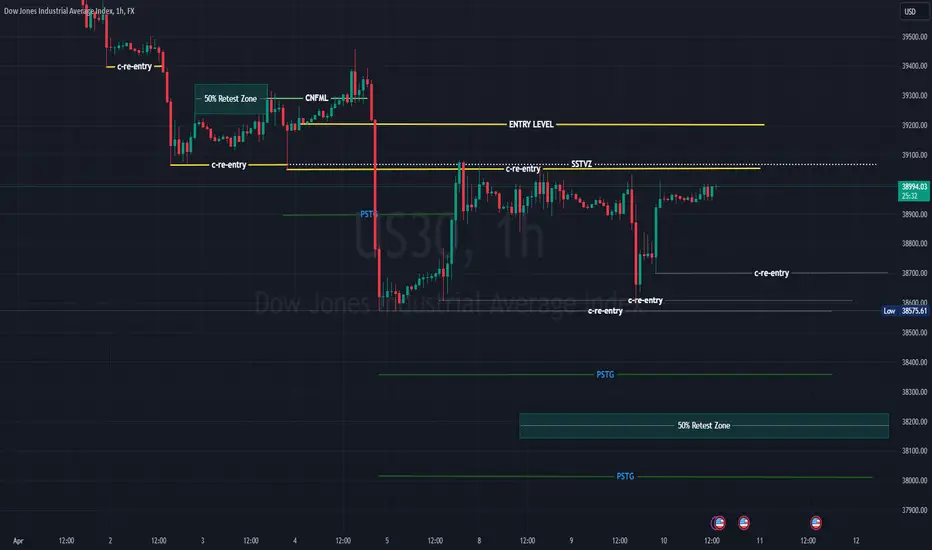
there is something that may most of you know about it ...
but i did a publish about it , as a refreshment !!
as u see in the screen , price has a good reaction to the "Previous day close Price"
and safely gave u 3 buy position ...
this was a real-time example ...
you can back-test and check for yourself !!
that's a lot helpful for you, if you have Daw jones in your watchlist !
if this was helpful for you , just gimme a pray :X
Good Luck friends.

US30 SELLERS GETTING READY FOR CPI Here we are on us30 waiting for CORE CPI/INFLATION RATE News release and sellers are getting ready to take the big decision as we get ready to make the most money out of that decision they will take.
Dow Jones' next moveHe can probably move based on the drawing path ! So you can only think about buying from the floor


DOW JONES ANALYSISChart : 1Hour
Overall Trend : Bullish
Current Market Structure : Consolidation
Scenario 1 :
Price is failing to break below 38800 , as we can see that is a strong demand area to push off on . Will wait for a break towards the upside . Will find entry on lower timeframe . We are forming a bullish chart pattern

Possibility of uptrend Considering the recent downward wave, if the index crosses the support range, the continuation of the downward trend is likely. Otherwise, by crossing the resistance range, the downward trend will be canceled and the continuation of the sideways or upward trend will be possible

US30 SELLCurrently in a sell position on Dow Jones. We've reached a very respected resistance level on the 1 hour. Market has made several attempts to break the resistance for the past 3 trading days but hasn't been able to push through even during heavy volume sessions. I'm expecting market to correct its FVG and create another support (higher low) before being able to go above the current respected resistance. Trade at your own risk

US30 2024/04/10Still within 15 min Bearish range
POI's Marked out for CPI, wil be looking for MSS on said POI's, also trendline liq forming above price anticipating it to be run at some point

US30 Going LONG are you ready?Previous Analysis posted: 31 MARCH
Current Analysis:
US30 just broke out the ($39,765 - $39,910) price range to the Long side.
Entry: patiently wait for the price to return and enter between ($39,775 - $39,850)
TP take profit: 1%-3% RR risk-to-reward: ($40,160)
SL stop loss: ($39,751)
Current Analysis:
US30 has just formed a demand zone (Low Range $38,590 - High Range $38,935) here I'm anticipating BUYERS driving prices higher.
Entry: Enter @ any prices between the LOW and HIGH price ranges $38,935 - $38, 590 LONG.
TP take profit: 1% - 3% RR risk-to-reward
SL stop loss: 1%
PLEASE REFER TO THE ILLUSTRATED CHART TO VIEW EACH OF MY LEVELS:
ENTRY/ STOP LOSS/ TAKE PROFIT
go follow @Peni2Dollarzfx

US30 will start the bullish move to break 40,000 level**Monthly Chart**
Last month's candle closed bullish and created a new high at 39910.47 (slightly shy from 40000.00 round number - a new historical high). This month opened from the high of the previous high and paused at 40023.09 only to reject it and move lower. This suggests that the long-term trend might be over and we should start looking for the start of a downward trend move.
**Weekly Chart**
Last week candle closed as a bearish manipulated candle as there was a huge sell of around 40,000 level. This has provided a counter-trend trade for a bearish move. However, till now US30 has tried to break below the 38500 level but fails. In addition, given the FOMC announcement today, we will see how US30 will react to it. This might provide another push to the upside to break the 40,000 level once more and create a new high.
**Daily Chart**
The last daily candle closed as a “ Key reversal” as it sweeps the liquidity from the daily MC candles near the demand zone, this provides a strong trajectory that there will be another push to the upside to break 40,000 level. Today FOMC will create this momentum.

US30 BULL FORECASTPrice been trading inside a channel formed a double bottom on strong support levels and waiting for price to break out the channel and test it the we good to buy...once broken out of the bearish channel.

Big One Entered a big long on US30 here.
Price bottomed. Showed a strong buying action and closed above swing low resistance.
Price continuation showing strong bullish momentum and pattern to breakout of previous trend line to the upside, potential for reaching the 4h high.
Stop loss set below the Candle entered --> shown on chart.
Planning to move stop loss to breakeven as soon as price breaks above 39032.
A good point to have entered would have been when candles failed to close below 38709 and sa soon as the 30 minute candle pushed (from testing below that level) up to confirm the buyers.

More downside before CPI tomorrow Short trade on the 4 hour chart. More downside to come before CPI tomorrow. Maybe the big guys already know something LOL

Live Trading Session 258: Open positions on GBP,BRT and moreIn this live trading session video,we look at open positions on BRENT and GBPUSD and potential trades coming on Bitcoin,Etherum,US30, etc and the thinking behind them.

US30DAILY
High tests and slowing down candles, therefore we should stay out and wait for the touch of the bottom of the wedge (38570)
4H
We still look like we are falling before and form of reversal. The trend has been bearish and is currently in a consolidation, leading us to expect an impulse.
1H
We still waiting for a breakout whether up or down.
15Min
Close your eyes and stay waiting

US30 (SHORT)
-Trend Channel has been broken to the downside, we Have 3 wave impulse move occurring, we on the final wave.
-Break of trend completed we no ion down trend.

US30 longsLongs from Zone 2 STDV, after monday consolidation, bullish narrative in fundamentals, counter trendline broken, buy zone, bullish PA from demand zone.

DOW JONES below the 1D MA50 after 5 months!Dow Jones (DJI) gave us an excellent sell entry following our last analysis (March 28, see chart below) as it got rejected and made a bearish reversal exactly where we expected it to:
Last Thursday it even broke below the 1D MA50 (red trend-line) for the first time in exactly 5 whole months (since November 03 2023)! This is a bearish break-out confirmation signal and we expect a new sell-off soon.
As you can see the former (dotted) Channel Down broke downwards and has given way to a (blue) Channel Down. The 4H MA50 (blue trend-line) has now been turned into Resistance with one confirmed rejection already (April 04).
The Channel Down has fairly symmetrical Bearish Legs so far, -2.36% and -2.20%. Assuming the new will be at a -2.20% minimum, we are expecting a Lower Low at 38200.
-------------------------------------------------------------------------------
** Please LIKE 👍, FOLLOW ✅, SHARE 🙌 and COMMENT ✍ if you enjoy this idea! Also share your ideas and charts in the comments section below! This is best way to keep it relevant, support us, keep the content here free and allow the idea to reach as many people as possible. **
-------------------------------------------------------------------------------
💸💸💸💸💸💸
👇 👇 👇 👇 👇 👇

The Market Is Waiting for Inflation Values in the USThe Market Is Waiting for Inflation Values in the US
Tomorrow one of the most significant events of the week will take place, which can greatly affect the sentiment of participants in both the currency and stock markets - at 15:30 GMT+3 inflation data will be published, namely: the values of the CPI (Consumer Price Index) and Core indices CPI.
According to ForexFactory, analysts expect the following values:
→ Core consumer price index, excluding food and energy prices, (Core CPI) in monthly terms: forecast = 0.3%, previous value = 0.4%
→ Consumer Price Index (CPI) in monthly terms – similar: forecast = 0.3%, previous value = 0.4%.
→ CPI in annual terms: forecast = 3.4%, previous value = 3.2%.
The Fed's inflation target is 2%. The values that will be published tomorrow may greatly affect market participants' expectations regarding the Fed's monetary policy.
According to the CME FedWatch tool:
→ traders are confident that the Fed will leave the rate unchanged in May;
→ the probability that the Fed will cut rates in June is just over 50%. But if the CPI indicates that inflation is stable, the likelihood will likely decrease.
Minneapolis Fed President Neel Kashkari said last week that a Fed rate cut was not a possible scenario if inflation continued to move sideways. George Lagarias, chief economist at Mazars, told CNBC, "I wouldn't be surprised if we see smaller rate cuts by the end of the year."
As the chart of the Dow Jones Index (US-30) shows, today the mood in the stock market can be described as cautious, since:
→ The 39,300 level, which served as support at the end of March, acts as resistance in April (shown in black).
→ The trend line, which has served as support since February, also changed its role to resistance (shown in purple).
It is possible that high CPI readings will cause the price of US-30 to decline further as market participants increase confidence that the Fed will continue to pursue tight policies to curb inflation for longer.
This article represents the opinion of the Companies operating under the FXOpen brand only. It is not to be construed as an offer, solicitation, or recommendation with respect to products and services provided by the Companies operating under the FXOpen brand, nor is it to be considered financial advice.

