Us30-reversal pattern spotted
-will be scalping since there's no break and retest
-shorts will be my investment
Trade ideas

Dow Jones – Bearish Leg Expected Toward 46,500
After several attempts to hold above the 48,000 zone, the **Dow Jones Index (US30)** is showing clear signs of exhaustion on the higher timeframes.
The current market structure suggests a potential **corrective move toward 46,500**, which aligns with the 0.618 Fibonacci retracement level and previous demand zone.
If the 47,800–48,000 resistance area continues to hold, sellers are likely to push the price lower in the coming sessions.
A clean break below **47,200** could confirm further downside momentum.
⚠️ I’ll be watching the 46,500 area for potential reversal signals or signs of accumulation.
---
#US30 #DowJones #DJI #Index #Trading #MarketStructure #TechnicalAnalysis #PriceAction #Bearish #Forex

US 30's Fall US 30, like Bitcoin, has encountered a heavy diagonal resistance line. This resistance can send US 30 toppling down the hill hard. I believe the shorts are in. Stay tuned!

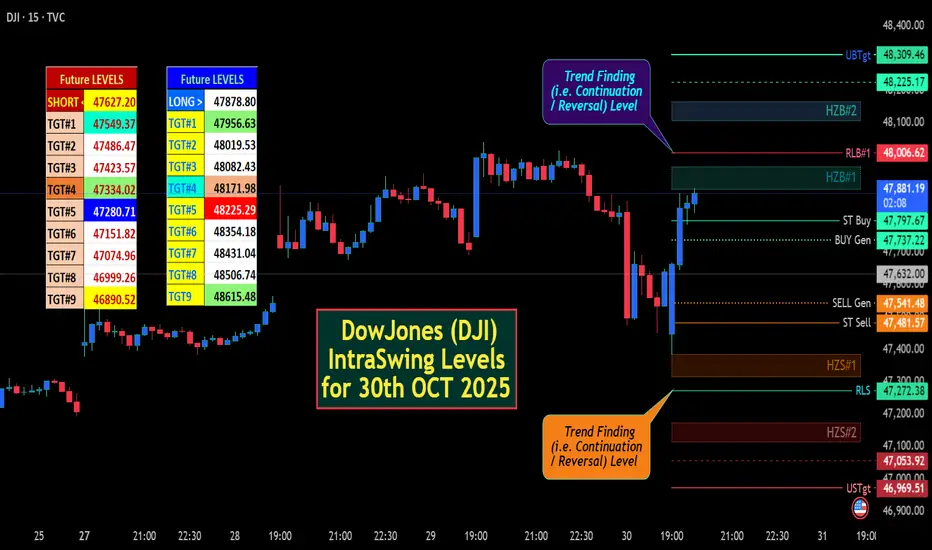
DowJones (DJI) IntraSwing Levels for 30th OCT 2025✍🏼️ "FUTUREY Levels" mentioned in BOX format.
🌡️Plot Levels Using 3 Min, 5 Min Time frame in your Chart for Better Analysis
L#1: If the candle crossed & stays above the “Buy Gen”, it is treated / considered as Bullish bias.
L#2: Possibility / Probability of REVERSAL near RLB#1 & UBTgt
L#3: If the candle stays above “Sell Gen” but below “Buy Gen”, it is treated / considered as Sidewise. Aggressive Traders can take Long position near “Sell Gen” either retesting or crossed from Below & vice-versa i.e. can take Short position near “Buy Gen” either retesting or crossed downward from Above.
L#4: If the candle crossed & stays below the “Sell Gen”, it is treated / considered a Bearish bias.
L#5: Possibility / Probability of REVERSAL near RLS#1 & USTgt
HZB (Buy side) & HZS (Sell side) => Hurdle Zone,
*** Specialty of “HZB#1, HZB#2 HZS#1 & HZS#2” is Sidewise (behaviour in Nature)
Rest Plotted and Mentioned on Chart
Color code Used:
Green =. Positive bias.
Red =. Negative bias.
RED in Between Green means Trend Finder / Momentum Change
/ CYCLE Change and Vice Versa.
Notice One thing: HOW LEVELS are Working.
Use any Momentum Indicator / Oscillator or as you "USED to" to Take entry.
⚠️ DISCLAIMER:
The information, views, and ideas shared here are purely for educational and informational purposes only. They are not intended as investment advice or a recommendation to buy, sell, or hold any financial instruments. I am not a SEBI-registered financial adviser.
Trading and investing in the stock market involves risk, and you should do your own research and analysis. You are solely responsible for any decisions made based on this research.
"As HARD EARNED MONEY IS YOUR's, So DECISION SHOULD HAVE TO BE YOUR's".
Do comment if Helpful .
In depth Analysis will be added later (If time Permits)
DowJones Key Trading LevelsKey Support and Resistance Levels
Resistance Level 1: 48085
Resistance Level 2: 48255
Resistance Level 3: 48500
Support Level 1: 47260
Support Level 2: 47040
Support Level 3: 46880
This communication is for informational purposes only and should not be viewed as any form of recommendation as to a particular course of action or as investment advice. It is not intended as an offer or solicitation for the purchase or sale of any financial instrument or as an official confirmation of any transaction. Opinions, estimates and assumptions expressed herein are made as of the date of this communication and are subject to change without notice. This communication has been prepared based upon information, including market prices, data and other information, believed to be reliable; however, Trade Nation does not warrant its completeness or accuracy. All market prices and market data contained in or attached to this communication are indicative and subject to change without notice.

US30 Trade Set Up Oct 30 2025price is making bearish structure on the 1h and 15m so i want to see a sweep of BSL and/or tap into 15m FVG before looking for internal 1m-5m IFVG/CISD to target daily FVG and SSL

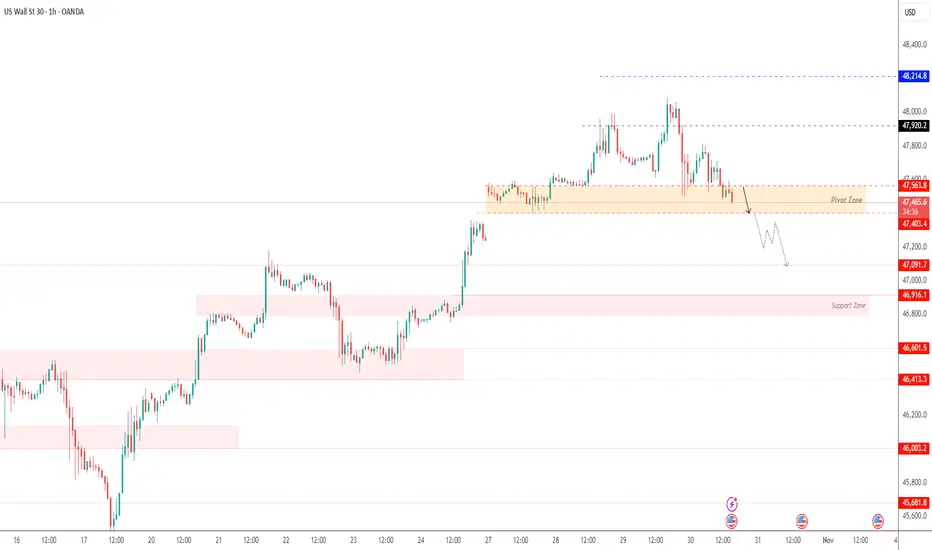
US30 - Testing Key Support Zone Amid Bearish PressureUS30 – MARKET OUTLOOK | Testing Key Support Zone Amid Bearish Pressure 🇺🇸
The Dow Jones is testing the 47,400 support zone, with downside pressure still dominant.
A 1H close below 47,400 would confirm continuation toward 47,090 → 46,920.
However, a 1H close above 47,620 may trigger a bullish rebound toward 47,920 → 48,000.
Pivot: 47,565
Support: 47,400 · 47,100 · 46,920
Resistance: 47,670 · 47,920 · 48,000
US30 remains bearish below 47,565, but a breakout above 47,620 could shift momentum to bullish.
US30 Technical Breakdown – 10/30/2025
📍 US30 Technical Breakdown – 10/30/2025
US30 cooled off after a strong rally last week 🔥 Price printed a local high around 47,800, then started retracing as momentum slowed. The index is now testing the 47,500–47,400 support zone, sitting right around the EMAs — a crucial spot for bulls to defend 👀
📊 Market Behavior:
🔹 Higher highs and higher lows still intact (bullish structure)
🔹 EMAs starting to flatten → possible short-term pullback
🔹 Buyers defending 47.4K area so far
📌 Key Levels:
🔹 Resistance Zones:
47,790 → recent high / intraday resistance
48,000 → major breakout level
48,200 → continuation target
🔹 Support Zones:
47,400 → EMA & structure support
47,100 → previous breakout zone
46,520 → demand base
🧠 Bias:
Bullish overall ⚡
➡️ Above 47,800 → breakout continuation toward 48,200+
⬅️ Below 47,400 → short-term correction back toward 47,100

DJIShift prediction to the right.
Global market cooler anticipated. Crypto should be hit the hardest and fastest.
Most anticipating rally continuation like post-COVID...
I think that will cause a surprise.


DOW JONES approaching the end of its Bull Cycle?Dow Jones (DJI) has been trading within a 16-year Channel Up ever sine the March 02 2009 market bottom of the U.S. Housing Crisis. As this chart shows, we have divided this pattern into three different phases.
Since the March 2020 COVID crash, it appears that the Cycle got restarted as the index broke below its 1W MA200 (orange trend-line) again after 10 years. Technically that was the only time that multi-year Support trend-line broke in 15 years.
In any case, following that Cycle 'restart', it appears that the index is currently inside the Megaphone pattern that in 2015 concluded Phase 2. The conclusion came with a second test on the 1W MA200 (Double Bottom). The first test was the April 07 2025 Low.
With their 1W RSI sequences also identical, having the first 1W MA200 forcing a 30.00 (oversold) RSI rebound, we expect the index to start a new Bearish Leg that might potentially test the 1W MA200 around 39000. For long-term investors, that is the market's next Buy Entry.
-------------------------------------------------------------------------------
** Please LIKE 👍, FOLLOW ✅, SHARE 🙌 and COMMENT ✍ if you enjoy this idea! Also share your ideas and charts in the comments section below! This is best way to keep it relevant, support us, keep the content here free and allow the idea to reach as many people as possible. **
-------------------------------------------------------------------------------
💸💸💸💸💸💸
👇 👇 👇 👇 👇 👇

US30 Bullish Breakout!
HI,Traders !
#US30 is trading in a strong
Uptrend and the price made a
Bullish breakout of the key
Horizontal level of 46718.2
So we are bullish biased
And we will be expecting a
Further bullish move up !
Comment and subscribe to help us grow !

US30 Longs Longs loading as PDH was swept pre-FOMC , price trading down toward discounted price of current Trading range
Looking for longs off of the the IFVG , targeting the new range high .

US30The Dow Jones index is at the end of its upward movement. The maximum level of increase is 48150, and then the price will decrease and correct, and we will definitely have sharp spikes to the downside with the release of economic news. This weekend and the week ahead will be exciting days for the indices. The price reduction levels are indicated in the analysis. The risk of short positions is very low.
This was a personal opinion and the trading responsibility lies with each person.

Before DOW 50K Happens (DJI long call for holders)Remember the future. Beware of the past. This time it's different. That's all.
I recommend studying Richard Wyckoff Stock Trading Technique, but not Tape Reading because that information is past its prime, in my opinion ;)
There's nothing left but upward ascent for humanity in my view. This is to do with spiritual reasons that many of us traders are privy to in our inner circles.
This chart is directed guidance towards the g20 group and the G7 group of Countries we call Home on Earth protectors.
We use capitalization as necessary to achieve the desired effect, affect, or required attribute enrichment in order to AVOID City 17, and not have to go back to the old ways of fearing totalitarian rule.
I posit that Donald Trump, The President of the United States of America, will eventually reply to my Christmas letter from 1993 and finish Home Alone 3, but I degress.
Some of us write letters. This is one such letter to the public; I used to write letters to Bill Gates on an IBM PS2, if you know your stuff.
This is my final chart, at least for a while. I always say something like that when I post a grand prediction like this one.
I bid you all well, and hope you find fruitfulness in your future life endeavors.
BLUEDOG OUT

DowJones (DJI) IntraSwing Levels for 29th OCT 2025🚀 "Future Levels ( Ticker:MYM1! -CBOT )" mentioned in BOX format.
🌡️Plot Levels Using 3 Min, 5 Min Time frame in your Chart for Better Analysis
L#1: If the candle crossed & stays above the “Buy Gen”, it is treated / considered as Bullish bias.
L#2: Possibility / Probability of REVERSAL near RLB#1 & UBTgt
L#3: If the candle stays above “Sell Gen” but below “Buy Gen”, it is treated / considered as Sidewise. Aggressive Traders can take Long position near “Sell Gen” either retesting or crossed from Below & vice-versa i.e. can take Short position near “Buy Gen” either retesting or crossed downward from Above.
L#4: If the candle crossed & stays below the “Sell Gen”, it is treated / considered a Bearish bias.
L#5: Possibility / Probability of REVERSAL near RLS#1 & USTgt
HZB (Buy side) & HZS (Sell side) => Hurdle Zone,
*** Specialty of “HZB#1, HZB#2 HZS#1 & HZS#2” is Sidewise (behaviour in Nature)
Rest Plotted and Mentioned on Chart
Color code Used:
Green =. Positive bias.
Red =. Negative bias.
RED in Between Green means Trend Finder / Momentum Change
/ CYCLE Change and Vice Versa.
Notice One thing: HOW LEVELS are Working.
Use any Momentum Indicator / Oscillator or as you "USED to" to Take entry.
⚠️ DISCLAIMER:
The information, views, and ideas shared here are purely for educational and informational purposes only. They are not intended as investment advice or a recommendation to buy, sell, or hold any financial instruments. I am not a SEBI-registered financial adviser.
Trading and investing in the stock market involves risk, and you should do your own research and analysis. You are solely responsible for any decisions made based on this research.
"As HARD EARNED MONEY IS YOUR's, So DECISION SHOULD HAVE TO BE YOUR's".
Do comment if Helpful .
In depth Analysis will be added later (If time Permits)

DowJones key support at 47260Key Support and Resistance Levels
Resistance Level 1: 48085
Resistance Level 2: 48255
Resistance Level 3: 48500
Support Level 1: 47260
Support Level 2: 47040
Support Level 3: 46880
This communication is for informational purposes only and should not be viewed as any form of recommendation as to a particular course of action or as investment advice. It is not intended as an offer or solicitation for the purchase or sale of any financial instrument or as an official confirmation of any transaction. Opinions, estimates and assumptions expressed herein are made as of the date of this communication and are subject to change without notice. This communication has been prepared based upon information, including market prices, data and other information, believed to be reliable; however, Trade Nation does not warrant its completeness or accuracy. All market prices and market data contained in or attached to this communication are indicative and subject to change without notice.

US30 Trade Set Up Oct 29 2025Overall im still bullish but if PDH gets swept first, i will look for internal 1m/5m IFVG/CISD to target SSL/London lows before looking for buys back up

DOW JONES 30 HIGH PROBABILITY SETUP SOON!!!🚨 DJ30 HIGH PROBABILITY SELL SETUP 🚨
* Here We Can See Clearly The Next Potential Moves For US30 Coming Hours/Days.
* Keep Your Eyes Close On Your Trading Positions.
* Happy PIP Hunting Traders.
FXKILLA.

Possibility of uptrend It is expected that the upward trend will continue and the index will advance to the specified resistance levels. Otherwise, a correction to the support area will be possible, and then a change in the trend scenario will be likely.

US30 ForecastThe Dow Jones Industrial Average Index is showing strong bullish momentum breaking above the ascending channel resistance. Price is holding above the 47,800 support zone and aiming toward the next key resistance near 48,400. The clear uptrend structure and breakout projection suggest further upside continuation, with buyers maintaining firm control.
"Thank you for your support! If you found this idea valuable or learned something new, please consider liking and leaving a comment. I’d really appreciate hearing your feedback and thoughts."
US30 Ready for shorts?Momentum on US30 is finally slowing. Character of price action is indicating short term shorts for a continuation of longs. Price is very overextended currently. I would have preferred a few pips in longs to major key level before sells, but current price action is hinting at shorts, and you do not want to miss it if that is the case. Waiting for my entry criteria to enter sells. Best of luck. Manage Risk!

DowJoned bullish breakout supported at 47260Key Support and Resistance Levels
Resistance Level 1: 48085
Resistance Level 2: 48255
Resistance Level 3: 48500
Support Level 1: 47260
Support Level 2: 47040
Support Level 3: 46880
This communication is for informational purposes only and should not be viewed as any form of recommendation as to a particular course of action or as investment advice. It is not intended as an offer or solicitation for the purchase or sale of any financial instrument or as an official confirmation of any transaction. Opinions, estimates and assumptions expressed herein are made as of the date of this communication and are subject to change without notice. This communication has been prepared based upon information, including market prices, data and other information, believed to be reliable; however, Trade Nation does not warrant its completeness or accuracy. All market prices and market data contained in or attached to this communication are indicative and subject to change without notice.
