Bitcoin 1 000 000$ ❚ Livermore cylinder📣 Hello everyone!
I bring to your attention my, I’m not afraid of this word, GLOBAL trading idea for Bitcoin for the decade ahead!
☝️ Now let me, as briefly but informatively as possible, explain to you how, step by step, Bitcoin will most likely come to $1,000,000 dollars, as well as what the two
Key data points
Previous close
—
Open
—
Day's range
—

Is it really possible for Bitcoin to reach 1 million dollars?Is it really possible for Bitcoin to reach one million dollars?
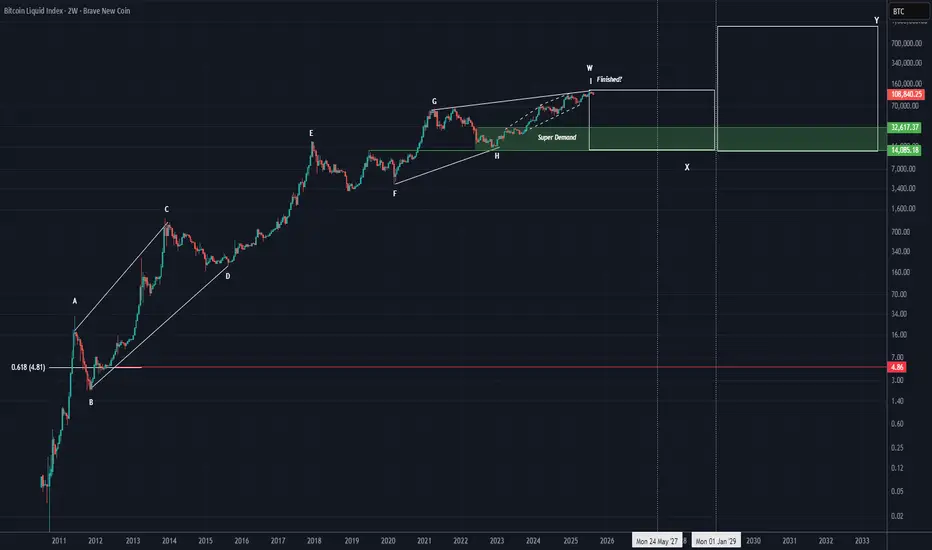
This is the complete Bitcoin data | from when it was $0.01 up to the last all-time high of $125K. Whether we like it or not, a large-degree pattern on Bitcoin is reaching completion, and we are looking at the chart without bias, purely
BRAVE NEW COIN TOP (EXPERIMENTAL)BNC:BLX
It's important to note that cryptocurrency markets are highly volatile, and such forecasts are speculative. Investors should conduct thorough research and consider their risk tolerance before making investment decisions.

Bitcoin / #Russell2000 📝The index of small companies is known for being highly dependent on bank financing. Therefore, of course, he is the main beneficiary of cheaper money after the rate cut.
👀What we see about correlations, CRYPTOCAP:BTC bull markets, coincide with the movement of this index as you can see, in the g

Bitcoin: The End of the Bull Cycle 1. Introduction
For more than a decade, Bitcoin has followed a consistent cyclical pattern that repeats after every halving.
On my long-term chart, which I’ve been tracking since previous cycles, the pattern is clearly visible:
Halving → Bull Market → Bear Market → Accumulation
2. Where We Are Now

BTC Cycle Review: know when to hold 'em & when to fold 'emReviewing the time around the halving that produces profitable trending signals.
From the chart 1 yr and 2 months before the halving and 1 year 5 months after the halving produces profitable signals
consider pre halving to be spring
consider post halving to be summer
consider the red X between t

Bitcoin Keltner Channels 📈BTC Keltner Channels
🔝Bitcoin broke out of the baseline resistance, under which it consolidated for a long period.
✍️While I don't expect a return below this gray line until the peak of the cycle, remember that it is almost 2 years away and we will have more than one correction before then.
💡I

Bull Or Bust?Having this count as a potential forecast for the continuation of the existing trend - cycle top should come in late next year if this is correct - the biggest question is if wave 1-2 is the actual count...but we will know eventually.

Bitcoin: Redux ITargets listed for cycle tops.
30-40k expected bottom before continuation to 200k levels.
Halving April 2024.

Begining of the bear marketThe bear market will start in early November and last until December 2026, with a target of 70,000 dollars per Bitcoin.

See all ideas
Displays a symbol's value movements over previous years to identify recurring trends.