ISP1! trade ideas
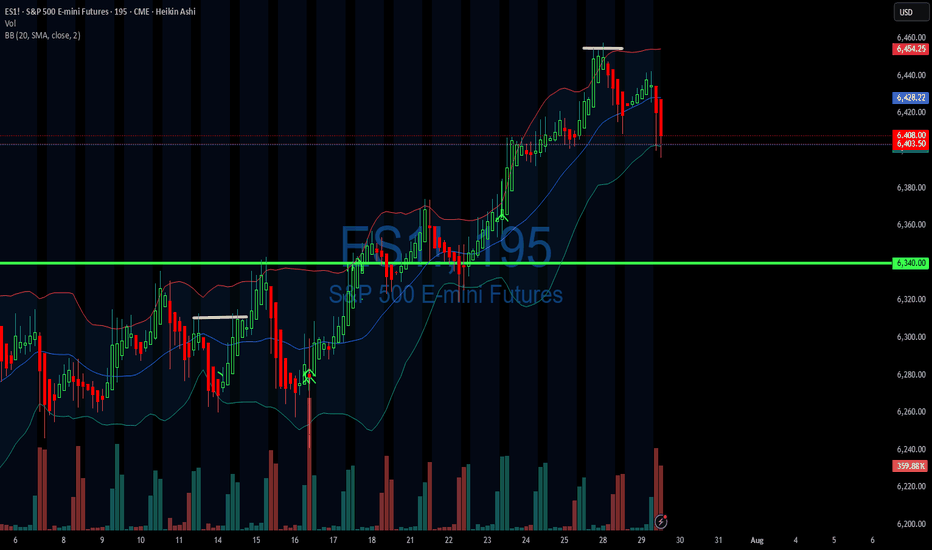
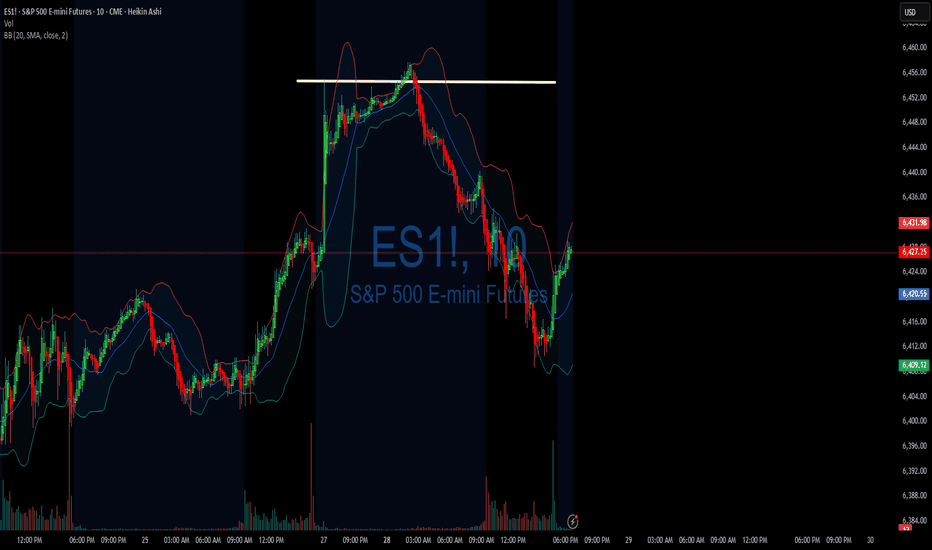
Retail Used Indicators. You Used Structure. You Got Paid.MES printed a textbook quant setup today, delivering a high-confidence breakdown that played out almost mechanically. Price action first broke down from a well-respected rising trend channel, then pulled back into the 50% Fibonacci retracement zone at 6,426.75, drawn from the recent swing high at 6,457.50 to the low at 6,395.75.
The retracement also aligned with a heavy volume node, which acted as a clear supply zone. What followed was a rounded retest structure that resembled a teacup formation not as a bullish setup, but rather as a liquidity bait, luring in breakout buyers before delivering a clean rejection from the equilibrium zone.
This type of structure a trend line break + fib pullback + rounded retest + expansion move is one of Staakd’s high-probability short patterns, historically completing the measured move back to 0% (6,395.75) over 70% of the time. That target has now been hit, and with price currently consolidating below the broken structure and inside a low-volume area, we could now see a secondary move toward 6,375 if 6,395 fails to hold. If instead we see a relief bounce, the optimal re-entry zone sits between 6,410 and 6,420, just beneath the broken fib and previous channel floor.
This is one of those trades where structure, volume, and historical probability all lined up. The teacup retest served its purpose: trap liquidity, reject from the midpoint, and release pressure into the lower range. Unless MES reclaims 6,430, the bias remains firmly bearish.
These setups tend to show up 9–14 times per year on MES alone, especially during high-volume NY sessions or post-news volatility. What you’re looking for is a strong, clean trending structure that finally breaks then watch for a pullback to the 50–61.8% retracement zone, ideally aligning with a volume node or prior support. Often, this retest forms a rounded “teacup” shape a trap zone that attracts late buyers just before the breakdown. Once that zone rejects with momentum, price tends to expand cleanly toward the 0% fib level, or even extend further.
Track this pattern. Log it. It’s one of the most repeatable, mechanical moves we see in futures and when it shows up, it usually pays.
My recommendation is simple: ditch the clutter. Most retail traders are buried under recycled YouTube strategies, lagging indicators, and overcomplicated systems. The truth? Price structure, volume, and basic fib geometry are more than enough to build consistent trades. Go back to basics. Read the chart, not the noise. You'll be surprised how quickly your trading improves when you stop outsourcing your bias to indicators and start trusting clean, mechanical setups like this.
ES - July 31st Daily PlanJuly 31, 2025 8:55am - Daily Plan
We currently have support at 6448 in yellow. If we can flush 6448 and reclaim around 6452, that would be a good entry for a level-to-level move and target 6460, 6468.
Next level is shown in Green & Red around the 6430-6434 zone, and this is the high of yesterday and the overnight session low. There is an open gap that could be filled at 6426 and then the reclaim of 6432 would be a nice entry to test the 6448 resistance, could then continue to move higher to 6460, 6468+.
Those are the areas I will be looking to grab some points today!
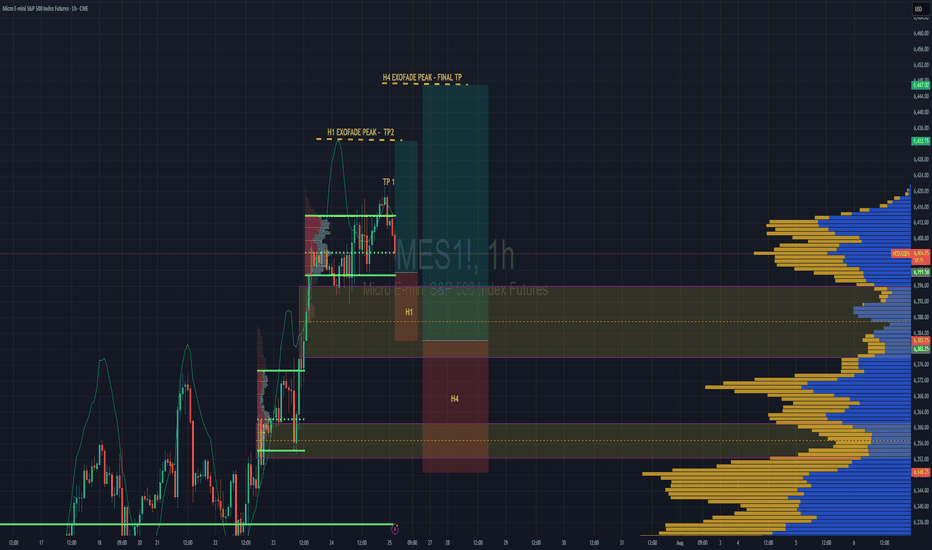
S&P 500 Intraday & Swing Entries H1 entry is close to getting activated for intraday.
If you want a swing trade then wait for H4 entry (you might be waiting a while obviously)
Reason for entries - We have broken out of Balance since July 25th and currently in a trend phase until we establish a new value area, or return to the one we broke out from.
So since Trend and Momentum is UP, then we should find Low Volume Areas to enter in the direction of the trend for a classic pullback entry trade.
07/30/25 Trade Journal, and ES_F Stock Market analysis EOD accountability report: +960
Sleep: 5 hours
Overall health: still struggling with sleep due to heat waves
VX Algo System Signals from (9:30am to 2pm)
— 8:30 AM Market Structure flipped bearish on VX Algo X3!✅
— 9:45 AM Market Structure flipped bullish on VX Algo X3! ✅
— 10:30 AM Market Structure flipped bullish on VX Algo X3!❌
— 11:30 AM Market Structure flipped bearish on VX Algo X3!❌
— 12:00 PM VXAlgo NQ X1DD Buy Signal, ✅
— 12:30 PM Market Structure flipped bullish on VX Algo X3!✅
What’s are some news or takeaway from today? and What major news or event impacted the market today?
I have started to noticed that the last 3 days, we have been getting false triggers on market structure signals and it almost feels MM are trying to do it to break people's algo that trade on that.
This is a good reminder that no matter how successful the signal has been for the last 30 days, you still need to have risk management. additionally, it's also a good way to test people's faith and trick new traders in going back to doing random things because it makes them think market can behave randomly and nothing works.
this is why i always tell people to religiously test out a system for 30 days before giving up.
News
*FEDERAL RESERVE SKIPS RATE CUT, KEEPS FED FUNDS RATE AT 4.50%
What are the critical support levels to watch?
--> Above 6410= Bullish, Under 6400= Bearish
Tech Earnings & Fed Meeting - July 30th - ES 100pt drop?I trade ES Futures and have identified an important support shelf that if broken could accelerate lower.
There is lower monthly volume below 6400 area. The monthly Point of Control is currently at 6300. The monthly 61.8% retracement is 6316. We have a fed meeting today and while trapping can happen, my lean is that we lose the 6400 level this week and could reach the 6316 target very quickly. Each level drawn are the more significant levels as to where institutional buyers may step in.
07/29/25 Trade Journal, and ES_F Stock Market analysis EOD accountability report: +734
Sleep: 5 hours
Overall health: Been struggling with sleep due to heat waves
VX Algo System Signals from (9:30am to 2pm)
— 8:00 AM Market Structure flipped bearish✅
— 9:30 AM VXAlgo NQ X3 Buy Signal✅
— 9:36 AM Market Structure flipped bullish on VX Algo X3! ❌
— 11:49 AM VXAlgo ES X1 Buy signal✅
— 11:59 AM VXAlgo NQ X1 Buy Signal❌
What’s are some news or takeaway from today? and What major news or event impacted the market today?
Today was one of the few short the resistance day and refreshing to see after we been grinding ATH (all time highs)
News
— 1:30 PM
🇺🇸🇨🇳 *CHINA SAYS IT AGREES WITH US TO EXTEND TARIFF TRUCE
What are the critical support levels to watch?
--> Above 6395= Bullish, Under 6374= Bearish
POC Pressure Cooker – MES Prepares for VolatilityWe’re heading into the NY session with MES balancing between key levels. The 50% retracement of the recent range (6436) is acting as a pivot, while the POC at 6428 is the immediate area of interest. The structure is tight here’s both sides of the play:
Key Levels to Watch:
- Upper Range: 6457–6460 (recent swing high)
- Mid-Range Pivot: 6436 (Fib 50%)
- POC & Support Zone: 6428 (volume shelf)
- Lower Range: 6415 → 6400
🟩 Bullish Scenario
A breakout and hold above 6440–6445 could lead to a retest of 6457–6460, with potential continuation to 6470+ if momentum accelerates.
- Confluence: Higher low structure above 6428, EMAs curling up, and price reacting positively to POC.
- Invalidation: Clean break and close below 6428.
🟥 Bearish Scenario
A failure to hold 6430 and a push through 6428 (POC) could see sellers target 6415, then possibly 6400.
- Confluence: Descending red trend line still capping price, and VWAP rejections could support a downside move.
- Invalidation: Break above 6457 with strong buyer aggression.
Staakd Notes:
This is a range-play environment. The real edge is in waiting for a break + retest of 6440 or 6428 to confirm direction. NY open volatility is likely to provide a fake out before the true move. Give it 30 mins from open.
Closing Line:
“Price is coiled between POC and the 50% mark. We’ll let NY open show its hand then react, not predict.”
29 july 2025Possible short on ES. NY took out the previous day's high while ES did not, thus forming an SMT. There is a 4 hour poor low from the previous week's wednesday and relative equal lows on friday.
As we are approaching the end of the month there could very well be a sell off to put in the month's wick before continuing higher next week.
SP500 E-Mini Futures will pump to 6,442.00 and then dump hardSP500 E-Mini Futures is showing in the lower timeframes a possible continuation at least more 6,30% reaching the 6,442.00 mark and at the same time with some bearish divergences in the higher time frames that if the price gets there could iniate a pullback between 30% and 40% to bring the price back slight below 4,000.00 at the end of next year possibly.
07/28/25 Trade Journal, and ES_F Stock Market analysis EOD accountability report: +405
Sleep: 5 hours
Overall health: meh
VX Algo System Signals from (9:30am to 2pm)
— 9:00 AM Market Structure flipped bullish❌
— 10:04 AM VXAlgo ES X1 Buy signal! ✅
— 11:21 AM Under 6424, the structure is bearish. Don't avg down! ✅
— 11:40 AMVXAlgo NQ X1 Buy Signal! ✅
— 12:40 PM VXAlgo NQ X1DD Sell Signal! ✅
— 1:30 PM VXAlgo ES X3DD Sell Signal! ✅
What’s are some news or takeaway from today? and What major news or event impacted the market today?
Today was one of the few short the resistance day and refreshing to see after we been grinding ATH (all time highs)
News
Eu trade deal over the weekend,
& china tariff extension.
What are the critical support levels to watch?
--> Above 6395= Bullish, Under 6374= Bearish
Early entry on !ES New York Session?If London -> New York session will be a reversal, this may be a solid entry...
- Lower time frames showing RSI Divergence (bottoming out).
- Higher time frames look like it could be a v shape recovery.
From a macro standpoint, I am anticipating a volatile week. A lot of news - but nothing today (monday). It would not surprise me to see Monday do the inverse of what is to come later in the week. So I am not trading today, outside of what is currently in position (Long Silver, Gold, & ES).
S&P 500 (ES1): Buyers In Control Amid Tariff Deals & EarningsWelcome back to the Weekly Forex Forecast for the week of July 28 - Aug 1st.
In this video, we will analyze the following FX market:
S&P 500 (ES1!)
The S&P 500 rose Friday to fresh highs, following a busy week of tariff updates and earnings. The S&P ended the week with its fifth straight record close, its longest such streak in over a year.
No reason to consider selling. Wait for pullbacks to FVGs for high probability buys.
FOMC and NFP loom. Be careful to avoid new entries during news times.
Enjoy!
May profits be upon you.
Leave any questions or comments in the comment section.
I appreciate any feedback from my viewers!
Like and/or subscribe if you want more accurate analysis.
Thank you so much!
Disclaimer:
I do not provide personal investment advice and I am not a qualified licensed investment advisor.
All information found here, including any ideas, opinions, views, predictions, forecasts, commentaries, suggestions, expressed or implied herein, are for informational, entertainment or educational purposes only and should not be construed as personal investment advice. While the information provided is believed to be accurate, it may include errors or inaccuracies.
I will not and cannot be held liable for any actions you take as a result of anything you read here.
Conduct your own due diligence, or consult a licensed financial advisor or broker before making any and all investment decisions. Any investments, trades, speculations, or decisions made on the basis of any information found on this channel, expressed or implied herein, are committed at your own risk, financial or otherwise.


