ES TRADE IDEAWe have a daily rejection from open and close fro, daily time frame followed by 4hr breakout, I am looking to buy from the new daily open and close to new ath
WSP1! trade ideas

Rallies, Pullbacks, Repeat: The Story of U.S. Stock IndexesThe U.S. stock market has been threading a fine line lately: the S&P 500 and Nasdaq climbed today as tech names like Nvidia, Micron, and Lam Research led gains, while traders held their breath over a looming government shutdown.
Despite strong momentum, indexes ended the week in the red as hawkish comments from Fed officials and sticky inflation data cooled enthusiasm.
What’s driving this tug-of-war? Optimism over rate cuts clashes with political risk — and the next twist could send markets swinging hard.

Next swing wave 3 targeting 6800!1). Rate cuts have begun! 2). ABC correction likely over. 3). MACD divergence. 4). Risk Assets are positive!
Note
I've been analyzing charts for over 20 yrs. as my strategies "trend" to be very accurate! A lot of effort goes into this, so please consider a "Boost"

ID: 2025 - 0209.29.2025
Trade #20 of 2025
Entry at 81 DTE
Never will I try to pick a "top", but this market is long overdue for a pullback. That will either be to begin the next move higher, or start a significant retracement going into the end of the year.
This risk profile resembles a funny car "dragster", and has a wide area range of profitability. Hands-off type trading until it approaches the 30 DIT (days in trade) mark.
Happy Trading!
-kevin

S&P500: More Upside Likely Before PullbackThe North American Mass Index kicked off the new week with some momentum, extending its climb within the ongoing magenta wave (3). For now, we anticipate this upward trend could continue before reaching a new high. Afterward, we expect a pullback as part of the subsequent wave (4), likely bringing the index into the magenta long Target Zone between 6,283 and 5,781 points. In our view, this price range offers attractive opportunities for long positions, as wave (5) is expected to follow—potentially pushing the index significantly higher and completing the larger blue wave (III). To protect newly established long positions, a stop can be set 1% below the lower boundary of the Target Zone.

S&P 500 FuturesThe S&P 500 futures have once again advanced over the past month and have once reached a new all-time high. From a technical perspective, the market is currently in overbought territory, which leaves room for a potential pullback. In such a scenario, the index may test the support level around 6,000, with intermediate support at 6,400.
Another factor supporting the case for a correction is the fact that from August through October, equities typically exhibit seasonal weakness. Nevertheless, the long-term trend remains firmly bullish.
Long-term trend: Up
Resistance level: 6,800
Support level: 6,000, 6400

Core Concepts of Digital Assets & Economy1. Defining the Digital Economy
The digital economy refers to all economic activities that are based on or significantly shaped by digital technologies. It is built upon the interconnectedness of the internet, cloud computing, mobile applications, artificial intelligence (AI), blockchain, and big data analytics.
Key characteristics of the digital economy include:
Intangibility of Value – Value is increasingly derived from information, algorithms, and digital assets rather than physical goods.
Global Connectivity – The digital economy transcends geographical borders, enabling instant cross-border transactions.
Platform-Centric Business Models – Companies like Amazon, Google, and Alibaba leverage platforms to connect producers and consumers digitally.
Data as the New Oil – Data is both an asset and a currency in the digital economy, driving decision-making, personalization, and automation.
The digital economy represents a shift from traditional capital and labor-based growth models to innovation, intellectual property, and technological adoption.
2. What Are Digital Assets?
A digital asset is any item of value that exists in digital form and can be owned, transferred, or exchanged. While traditional assets such as stocks, bonds, or real estate are physical or paper-based, digital assets are intangible and exist in electronic environments.
Examples include:
Cryptocurrencies like Bitcoin and Ethereum
Tokenized assets (fractional ownership of real estate, stocks, or commodities)
Non-Fungible Tokens (NFTs) representing art, music, or collectibles
Intellectual property (patents, copyrights, digital designs)
Virtual goods in gaming ecosystems
Personal data and digital identities
Core properties of digital assets:
Intangibility – Exists only in digital form.
Transferability – Can be exchanged globally within seconds.
Programmability – Assets can be coded with rules (smart contracts).
Security & Scarcity – Blockchain ensures authenticity and prevents duplication.
3. Classifications of Digital Assets
Digital assets can be broadly categorized into the following:
a. Cryptocurrencies
Decentralized digital currencies secured by cryptography, such as Bitcoin, Ethereum, and stablecoins. They serve as mediums of exchange, stores of value, and units of account in the digital economy.
b. Security Tokens
Digitized representations of traditional financial instruments like stocks, bonds, or derivatives. They are regulated and offer investor rights, dividends, and voting power.
c. Utility Tokens
Tokens that grant access to a product or service within a specific blockchain ecosystem. Example: Ether (ETH) is used to pay for transactions on Ethereum.
d. Non-Fungible Tokens (NFTs)
Unique digital certificates of ownership for art, collectibles, music, and other creative assets. They have revolutionized content monetization.
e. Central Bank Digital Currencies (CBDCs)
Digital versions of national currencies issued by central banks. Examples: e-CNY (China), Digital Euro, and India’s e-Rupee.
f. Tokenized Real-World Assets
Fractional ownership of real-world assets (real estate, gold, art) represented digitally, enabling liquidity and global access.
4. Technological Foundations
The rise of digital assets and the digital economy is powered by several foundational technologies:
Blockchain & Distributed Ledger Technology (DLT) – Ensures transparency, immutability, and security in digital asset transactions.
Smart Contracts – Self-executing agreements coded into blockchains, enabling automation of trust.
Artificial Intelligence & Machine Learning – Power predictive analytics, personalized services, and fraud detection.
Cloud Computing – Provides scalability and infrastructure for digital platforms.
Internet of Things (IoT) – Connects devices and enables real-time data-driven economic models.
Cybersecurity – Protects data, digital identities, and financial transactions.
5. Economic Implications of Digital Assets
The integration of digital assets into global markets has profound economic consequences:
Financial Inclusion – Cryptocurrencies and mobile banking provide unbanked populations access to financial services.
New Forms of Value Creation – NFTs empower artists and creators to monetize directly without intermediaries.
Liquidity in Illiquid Markets – Tokenization makes assets like real estate and fine art more accessible and tradable.
Disintermediation – Blockchain eliminates traditional intermediaries (banks, brokers), reducing costs.
Cross-Border Trade – Digital currencies enable instant, low-cost international remittances.
Gig & Creator Economy Expansion – Platforms monetize skills, data, and content more efficiently.
6. Digital Assets as a New Asset Class
Digital assets are increasingly recognized as a distinct asset class in investment portfolios. Institutional adoption is rising, with hedge funds, pension funds, and sovereign wealth funds diversifying into cryptocurrencies and tokenized assets.
Key investment features:
Volatility & High Returns – Cryptocurrencies are volatile but potentially yield high returns.
Correlation Diversification – Digital assets often move differently from traditional equities and bonds.
Hedging Against Inflation – Bitcoin is often termed “digital gold” due to its scarcity.
Programmable Income – DeFi allows investors to earn yield through staking, lending, and liquidity provision.
7. Risks & Challenges
While digital assets promise innovation, they come with risks:
Volatility – Price swings can destabilize portfolios.
Regulatory Uncertainty – Lack of uniform global frameworks creates risks for investors and businesses.
Cybersecurity Threats – Hacks and frauds remain major concerns in exchanges and wallets.
Scalability Issues – Networks like Ethereum face high transaction costs during peak demand.
Environmental Concerns – Proof-of-Work blockchains consume significant energy.
Illicit Use – Cryptocurrencies have been linked to money laundering and dark web activities.
8. Regulation of Digital Assets
Governments worldwide are grappling with regulating digital assets:
United States – The SEC and CFTC regulate cryptocurrencies as securities or commodities depending on classification.
European Union – Introduced MiCA (Markets in Crypto-Assets Regulation) to standardize frameworks.
China – Banned cryptocurrencies but promotes its CBDC, e-CNY.
India – Taxed crypto gains but has yet to establish a comprehensive regulatory law.
Global Organizations – The IMF and BIS advocate for international cooperation on digital currency regulation.
Regulation aims to balance innovation and investor protection, prevent financial crime, and ensure monetary stability.
9. The Digital Economy Ecosystem
The digital economy is composed of multiple interconnected ecosystems:
E-commerce & Digital Platforms – Amazon, Flipkart, and Alibaba dominate online retail.
Digital Finance & Fintech – Payment apps (PayPal, UPI, Stripe) and DeFi platforms.
Gig & Freelance Economy – Platforms like Upwork and Fiverr enable remote work monetization.
Metaverse & Virtual Economies – Virtual real estate, gaming assets, and social experiences.
Data Economy – Data marketplaces and AI-driven businesses monetize personal and enterprise data.
10. Future of Digital Assets & the Digital Economy
Looking ahead, digital assets will continue to reshape economies:
Mainstream Adoption – With regulatory clarity, institutional and retail adoption will surge.
Rise of CBDCs – National digital currencies will modernize monetary systems.
Tokenization of Everything – From cars to carbon credits, all assets may become tradable on blockchains.
Integration with AI & IoT – Smart cities and autonomous economies will emerge.
Decentralized Autonomous Organizations (DAOs) – Communities will govern businesses democratically through tokens.
Sustainable Finance – Shift to energy-efficient blockchain systems.
11. Case Studies
a. Bitcoin’s Role in Inflation-Hedging
During periods of global uncertainty, Bitcoin has been compared to gold as a hedge against inflation. In countries like Venezuela and Turkey, citizens turned to Bitcoin when national currencies collapsed.
b. NFTs in the Creative Industry
Artists like Beeple sold digital art for millions using NFTs, disrupting the traditional art world by eliminating galleries as gatekeepers.
c. China’s e-CNY Experiment
China is pioneering CBDC adoption through pilot programs in cities, with potential to influence cross-border trade settlement systems.
12. Ethical & Social Considerations
Digital assets also raise ethical debates:
Data Privacy – Who owns and monetizes personal data?
Digital Divide – Wealthier nations may dominate digital finance while poorer countries lag.
Speculation vs. Utility – Many crypto projects focus more on speculation than genuine utility.
Sustainability – Transition to green blockchain systems is crucial for climate goals.
Conclusion
The fusion of digital assets and the digital economy represents a fundamental transformation of global finance, trade, and innovation. Digital assets are not merely speculative instruments but new forms of value representation that empower individuals, democratize finance, and reimagine ownership. Meanwhile, the digital economy provides the infrastructure, platforms, and ecosystems where these assets thrive.
However, this transformation is not without risks—volatility, regulation, cybersecurity, and ethical challenges must be addressed to ensure stability and inclusivity. As technology evolves, the future will likely see a convergence of blockchain, AI, IoT, and tokenization, shaping a borderless, data-driven economy.
In essence, understanding the core concepts of digital assets and the digital economy is crucial not only for investors and policymakers but also for individuals and businesses seeking to thrive in an increasingly digital world.
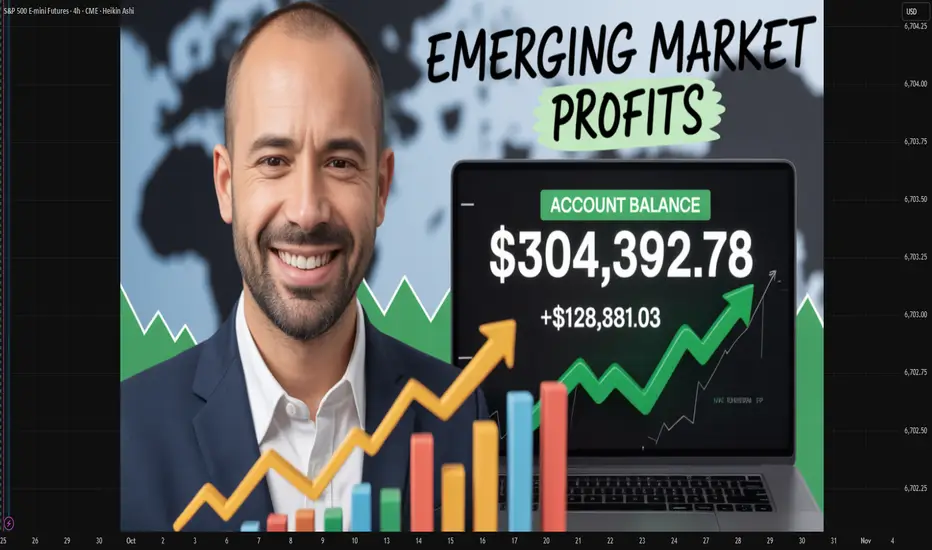
Why Emerging Economies Are Driving Global ProfitsPart 1: Understanding Emerging Economies
1.1 Definition of Emerging Economies
Emerging economies are countries transitioning from low-income to middle- or high-income status. They typically feature:
Rapid GDP growth
Increasing industrialization
Expanding consumer base
Integration into global markets
Structural reforms improving business conditions
Examples include China, India, Brazil, South Africa, Mexico, Turkey, Vietnam, and Indonesia. Collectively, they form key groups such as the BRICS (Brazil, Russia, India, China, South Africa) and MINT (Mexico, Indonesia, Nigeria, Turkey).
1.2 Why They Matter Today
Emerging markets contribute over 60% of global GDP growth.
They account for the majority of global trade growth.
Hundreds of millions of people are entering the middle class, becoming powerful consumers.
Part 2: Historical Shifts in Global Profit Centers
2.1 Post-WWII Era: Developed Market Dominance
After WWII, developed nations rebuilt with the help of the Marshall Plan, became hubs of manufacturing, and dominated global profits. Emerging economies were peripheral, often tied to resource exports.
2.2 1980s–1990s: Liberalization & Globalization
China opened its economy in 1978, setting the stage for massive manufacturing growth.
India liberalized in 1991, spurring IT and service sector expansion.
Eastern Europe joined global trade networks after the Soviet Union’s fall.
This era marked the shift of supply chains toward emerging economies.
2.3 2000s Onwards: The Rise of Emerging Market Giants
China became the “world’s factory”, exporting everything from textiles to electronics.
India became the “back office of the world”, leading IT services and outsourcing.
Brazil and Russia leveraged commodities to drive global profits.
Southeast Asia became a hub for electronics, shipping, and consumer manufacturing.
Today, multinational profits are increasingly tied to emerging market demand rather than just low-cost production.
Part 3: Structural Drivers of Profit Growth
3.1 Demographic Advantages
Young, growing populations in countries like India, Indonesia, and Nigeria fuel workforce availability and consumption.
By 2030, emerging markets will account for two-thirds of the global middle class.
3.2 Urbanization & Infrastructure Development
Rapid urbanization is creating megacities in Asia and Africa.
Infrastructure investments—roads, ports, airports, digital connectivity—unlock new markets.
Real estate, transport, and construction generate huge profits for companies.
3.3 Consumer Market Expansion
Rising incomes = growing demand for consumer goods, services, healthcare, and technology.
Emerging markets are becoming demand centers, not just supply bases.
Example: India’s smartphone penetration skyrocketed due to affordable mobile internet.
3.4 Digital Leapfrogging
Many emerging economies skipped traditional development stages and adopted mobile-first, digital solutions.
Mobile banking in Africa, e-commerce in Southeast Asia, and super-apps in China illustrate this.
These innovations generate new ecosystems of profit.
3.5 Global Supply Chain Integration
Companies diversify manufacturing beyond developed nations into Asia, Latin America, and Africa.
“China+1 strategy” pushes investments into Vietnam, India, and Indonesia.
This integration spreads profits across emerging economies.
Part 4: Sectoral Profit Engines
4.1 Technology & Digital Economy
China: home to Alibaba, Tencent, Huawei.
India: global IT services hub with Infosys, TCS, Wipro.
Southeast Asia: booming e-commerce platforms like Shopee, Lazada, Tokopedia.
The digital economy is a major source of profit, fueled by young, tech-savvy consumers.
4.2 Manufacturing & Industrial Growth
China leads global electronics and machinery production.
Vietnam and Bangladesh dominate textiles and apparel exports.
India is growing in pharmaceuticals, automobiles, and electronics.
4.3 Energy & Commodities
Brazil, Russia, and South Africa drive profits in oil, gas, minerals, and agriculture.
Emerging markets are both producers (exporting raw materials) and consumers (fueling demand).
4.4 Financial Services
Microfinance and digital banking in Africa and Asia empower new customers.
Fintech innovation (UPI in India, M-Pesa in Kenya) creates profit opportunities.
4.5 Healthcare & Education
Rising incomes = higher demand for private healthcare and education.
Medical tourism in India, Thailand, and Mexico is booming.
Emerging market pharmaceutical companies are gaining global market share.
Part 5: Why Multinationals Depend on Emerging Markets
5.1 Revenue Diversification
Western companies increasingly rely on emerging markets for growth.
Example: Apple, Coca-Cola, and Unilever earn significant profits from Asia and Africa.
5.2 Scale of Demand
Emerging markets offer hundreds of millions of consumers in a single country.
Example: India’s population (1.4 billion) provides unmatched consumer scale.
5.3 Innovation Opportunities
Companies innovate products suited for cost-sensitive, value-driven markets.
Example: Tata’s $2,500 Nano car, or Nestlé’s single-serve sachets of coffee in rural markets.
5.4 Strategic Partnerships
Multinationals partner with local firms for distribution, branding, and market entry.
Example: Walmart’s investment in Flipkart (India).
Part 6: Challenges and Risks
6.1 Political & Regulatory Uncertainty
Sudden policy changes, trade barriers, and corruption can affect profits.
6.2 Infrastructure Gaps
Logistics and energy shortages can constrain business growth.
6.3 Currency Volatility
Emerging market currencies can be unstable, impacting corporate earnings.
6.4 Competition from Local Firms
Domestic champions in China and India rival multinational dominance.
6.5 Environmental & Social Concerns
Rapid industrialization raises sustainability challenges.
Firms must balance profits with ESG commitments.
Part 7: Future Outlook
7.1 Emerging Markets as Global Growth Engines
By 2050, China and India together could account for nearly 40% of global GDP.
Africa is set to be the next frontier, with a billion young consumers by 2040.
7.2 Green Energy & Sustainability
Transition to renewable energy creates profit opportunities in solar, wind, and EVs.
India and China are among the world’s biggest renewable investors.
7.3 Digital Transformation
Artificial intelligence, fintech, and e-commerce will accelerate profit growth.
Emerging markets are not just catching up—they are leading in many niches.
7.4 Multipolar World Order
Emerging economies are shaping trade, investment, and geopolitics.
BRICS+ expansion signals a new era of South-South cooperation.
Conclusion
Emerging economies are no longer “peripheral players.” They have become the epicenter of global profits, thanks to:
Rapid economic growth
Expanding consumer markets
Technological leapfrogging
Integration into global trade
Yes, risks remain—political instability, infrastructure gaps, and volatility—but the profit story is undeniable. For businesses, investors, and policymakers, the rise of emerging economies is the defining story of the 21st century.
ES-mini Futures - (SPX) Analyses for Sep 25Market drivers for Thu, Sep 25 (ET)
• 8:30 — GDP 2Q (Third estimate) + Corporate Profits (annual update). Official BEA release.
• 8:30 — Durable Goods (Advance, Aug). Census M3 advance report (release time 8:30 a.m. ET).
• 8:30 — Initial Jobless Claims (weekly). DoL weekly claims (standard Thu 8:30 a.m. ET cadence).
• 10:00 — Existing-Home Sales (Aug). National Association of Realtors, scheduled for Thu 10:00 a.m. ET.
• Fed speakers — Vice Chair Bowman: 9:00 a.m. (Economic Outlook) and 1:00 p.m. (Approach to Monetary Policy).
• Treasury — Multiple bill auctions scheduled for Sep 25 (4-, 6-, 13-, 26-, 52-week). Watch rate/curve reaction around midday.
• (Context) Atlanta Fed GDPNow next update Fri, Sep 26 (used by markets for GDP tracking).
Risk windows to respect: 8:30 (data cluster) and 10:00 (housing). Avoid fresh entries ~5m before/after these prints; expect liquidity gaps.
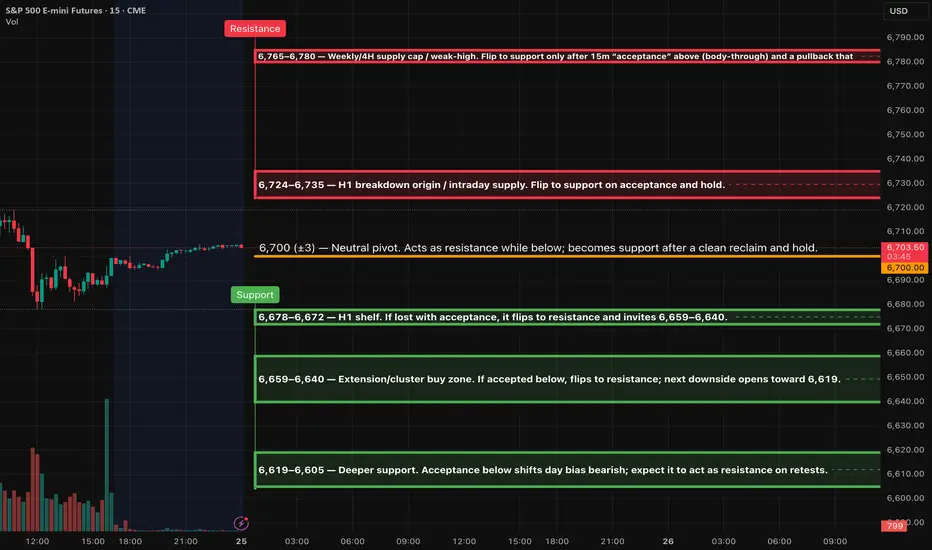
Overall bias & PA projection (overnight → tomorrow)
Structure: Uptrend on higher timeframes, but near a weekly/4H supply cap ~6,76x–6,78x with a fresh H1 pullback printed.
Bias into NY: Balanced-to-slightly-bullish if 6,67x holds. Below that, rotation toward the extension cluster 6,66x–6,64x likely before buyers try again.
Overnight projection: Asia/London likely to range 6,68x–6,70x. A London stop-run under 6,678 that quickly reclaims sets the stage for NY bounce. Acceptance below 6,672 opens 6,659 → 6,640 → 6,619.
NY session — A++ setups (Level-KZ Protocol 15/5/1)
Management rules (as usual): TP1 = next opposing MAJOR level; close 70% at TP1, leave 30% runner → TP2/TP3; hard SL = 15m trigger wick ±0.25–0.50pt; time-stop 45–60m; max 2 attempts per level.
ES SHORT (A++) — Rejection Fade at 6,735–6,750
Trigger: 15m rejection close back inside the zone → 5m re-close down with LH → 1m pullback fail to enter.
Entry: 6,740 ±2 (within zone after the 1m pullback).
SL: Above the 15m signal wick / hard cap 6,768.
• TP1: 6,700 pivot.
• TP2: 6,678–6,672 shelf.
• TP3: 6,659–6,640 ext cluster.
Invalidation / maintenance: Two whipsaws or a 15m body-through ≥1.0pt above 6,768 → demote/stand down; acceptance >6,768 flips bias to longs toward 6,78x.
ES LONG (A++) — Acceptance-Continuation from 6,658–6,642
Context: High-prob “flush & reclaim” at the extension cluster before/after 8:30 data.
Trigger: 15m full-body close back above 6,652, 5m HL + re-close up, 1m HL entry.
Entry: 6,650 ±3 after reclaim.
SL: Below the 15m signal wick / hard cap 6,637.
• TP1: 6,700 pivot.
• TP2: 6,724–6,735 supply.
• TP3: 6,760–6,770 (weekly cap).
Notes: If the 8:30 print gaps price through TP1 immediately, manage fills but still honor runner plan; no trailing before TP2 per protocol.
==========
London session game plan (02:00–05:00 ET)
Base case: Range 6,678–6,700 with liquidity sweeps. Reclaim of 6,700 during London often fades back into the range; prefer patience for NY AM.
Alternative: London sell program to 6,66x–6,64x → if quick reclaim above 6,652, that’s the Tier-2 bounce that feeds the NY long setup.
Bear path: Acceptance <6,640 in London → prepare for a trend-day lower toward 6,619 unless NY reverses on data.
Buyers may be returningBuyers may be returning in the S&P 500 daily chart for Thursday, September 25. Look for follow-through to the upside.

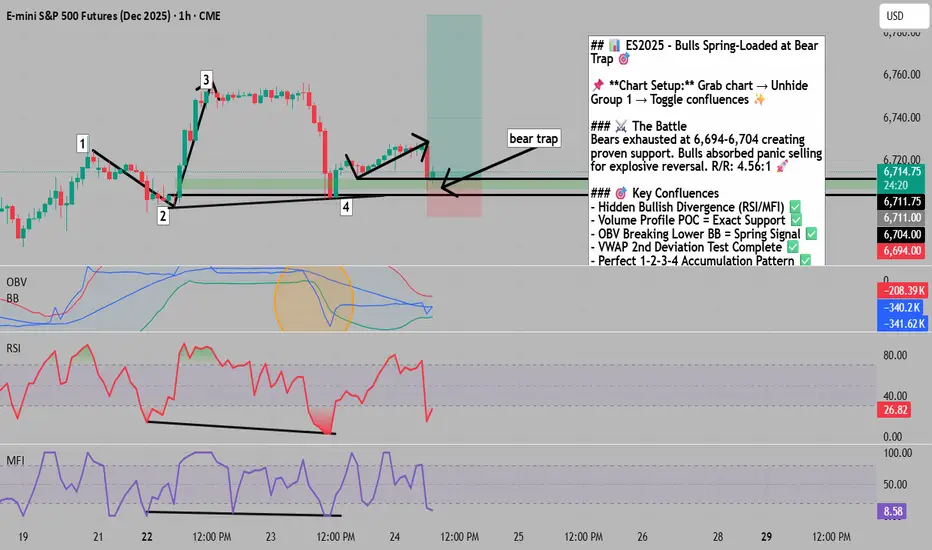
Bulls Spring-Loaded After Bear Trap Test📌 To see my confluences and/or linework, step 1: grab chart, step 2: unhide Group 1 in object tree, step 3: hide and unhide specific confluences. 😊
The Market Participant Battle:
Bears exhausted their ammunition at the 6,694-6,704 support zone (point 4), creating a proven set of market participants that bulls successfully defended. When price closed above the previous high (point 3 above point 1), it confirmed bears were trapped, establishing point 2 as the critical support level. The return to this zone at point 4 triggered a classic spring pattern where bulls absorbed all selling pressure, setting up for an explosive move higher. Smart money appears to be accumulating here while retail bears remain trapped below their stop losses.
Confluences:
Confluence 1: Hidden Bullish Divergence Power Play
The hidden bullish divergence at point 4 is textbook - price printed a higher low while RSI and MFI showed lower lows, screaming institutional accumulation. RSI hit oversold precisely at the bounce point (26.82), confirming maximum pessimism when smart money was buying. The divergence across multiple momentum indicators (RSI, MFI) strengthens the signal exponentially, suggesting bears are fighting a losing battle against algorithmic buying programs.
Confluence 2: Volume Profile & Market Microstructure
The volume profile POC from the major low to point 3 sits exactly at point 4 (6,704 level), acting as a magnetic price attractor. This isn't coincidence - it's where the most contracts changed hands, creating maximum liquidity for institutional players to accumulate. The developing POC support alignment confirms this level as the new value area that market makers will defend aggressively.
Confluence 3: Bollinger Band & OBV Explosion Signal
On-Balance Volume (OBV) breaking below its lower Bollinger Band at point 4 historically precedes violent upward reactions. This extreme reading suggests panic selling into strong hands - the classic transfer from weak to strong participants. Combined with price testing the 2nd standard deviation of VWAP anchored from point 1, we have a triple-loaded spring ready to unleash.
Confluence 4: Mathematical Price Structure
The 1->2->3->4 pattern creates a perfect measured move setup. Point 4's reaction from the proven participant zone (point 2) establishes a risk/reward ratio of 4.56:1 with clear stop placement at 6,694. The mathematical precision of these levels isn't random - it's algorithmic market making at its finest.
Web Research Findings:
- Technical Analysis: S&P currently at 6,713 with strong buying pressure on weekly charts, testing resistance at 6,760. RSI showing negative divergence on daily but oversold on intraday - perfect storm for squeeze higher
- Recent News/Earnings: Q3 earnings estimates revised UP 0.7% (unusual positive revision), with 50% of companies issuing positive guidance vs 43% historical average - bullish fundamental backdrop
- Analyst Sentiment: Technical ratings show "Strong Buy" on weekly/monthly timeframes despite short-term neutral readings - institutions positioning for continuation
- Data Releases & Economic Calendar: Fed cut 25bps on Sept 17 with 2 more cuts expected in 2025, creating liquidity tailwind. Initial jobless claims at 231k (below 241k consensus) shows resilient labor market
- Interest Rate Impact: Fed funds now at 4.00-4.25% with dovish bias. Markets pricing in additional easing through 2026, supportive of risk assets despite inflation concerns
Layman's Summary:
Think of this like a coiled spring that bears just compressed to maximum tension. The Fed is pumping liquidity (rate cuts), companies are beating earnings expectations, and unemployment remains low - all green lights for stocks. The technical setup shows big money quietly buying while retail traders panic sell. When everyone who wanted to sell has sold (point 4), the only direction is up. The VIX at 16.64 shows low fear - perfect for a surprise squeeze higher. Smart money is betting on continuation of the bull market with this classic accumulation pattern.
Machine Derived Information:
- Volume footprint analysis: Buy-side absorption clearly visible at point 4 support - Significance: Institutional accumulation confirmed - AGREES ✔
- Multi-timeframe structure: Support zone respected across 1hr, 4hr, daily timeframes - Significance: Strong technical foundation - AGREES ✔
- Pattern recognition: Clean 1-2-3-4 accumulation schematic with textbook execution - Significance: High probability setup - AGREES ✔
- Fibonacci analysis: 61.8% retracement held perfectly at point 4 - Significance: Mathematical precision confirms support - AGREES ✔
- Indicator confluence dashboard: RSI, MFI, OBV all flash oversold reversal signals - Significance: Multiple confirmations reduce false signal risk - AGREES ✔
- Market profile analysis: High volume nodes acting as price magnets - Significance: Liquidity pools support bullish thesis - AGREES ✔
- Order flow visualization: Aggressive buying visible in footprint charts - Significance: Smart money accumulation pattern - AGREES ✔
Actionable Machine Summary:
All technical analyses unanimously confirm the bullish spring setup. The hidden divergence across RSI/MFI, OBV Bollinger Band break, VWAP 2nd deviation test, volume profile POC support, and clean 1-2-3-4 pattern create an A+ technical setup. The machine analysis shows zero contradictions - every indicator points to the same conclusion: bears are trapped, bulls are loaded, and the spring is about to release violently upward.
Conclusion:
Trade Prediction: SUCCESS ✅
Confidence: HIGH
This is a textbook accumulation pattern with institutional fingerprints all over it. The confluence of hidden bullish divergence, volume profile support, extreme OBV readings, and perfect mathematical structure creates an exceptional risk/reward opportunity. With the Fed maintaining its easing bias, earnings revisions trending positive, and VIX showing complacency, the path of least resistance is clearly higher. The 4.56:1 risk/reward ratio makes this a must-take trade for any serious market participant.
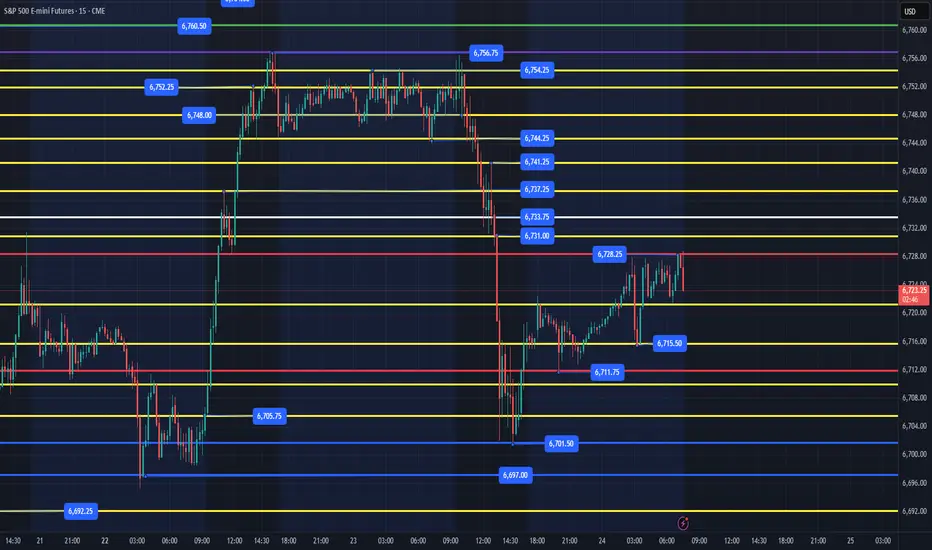
ES - September 24th - Daily Trade PlanBefore reading this trade plan, IF, you did not read yesterdays, or the weekly trade plan take the time to read it first! (You can see both posts in the related publication section)
My trade plan is out later this am due to some family commitments. I will not be highlighting yesterdays, so please read it and review the real-time notes that I posted during the day.
September 24th - 7:30am EST
Overnight session high is 6728 and low is 6711. We have been moving up the levels in a very slow structured way since finding a low yesterday around 6701. Ideally, price will either continue to grind up and retest the 6741-44 area of where we sold off from, or we will need to retest overnight low or yesterday's low to flush and reclaim and move higher to back test the 6741-44 area.
Key Support Levels - 6721, 6715, 6711, 6701
Key Resistance Levels - 6728, 6733, 6741, 6744, 6754
We are in a bit of a holding pattern, unless you have a low time frame entry strategy for a scalp. I personally do not see much to get excited about as price slowly moves higher into some key resistance levels. IF, price loses 6715 and can't reclaim it, then we will probably head lower to retest yesterday's lows. Since I DO NOT SHORT ES, I won't have any good quality setups until we get a pullback. I will be patient and wait for a flush and reclaim of 6711, but 6701 or 6697 would be a much higher quality area.
Make sure you look at yesterday's sell off and plan. I wrote at "1:40pm - I would let price build a base. It could be here at 6710, 6705 or down at 6696. Give it time to build a base with a move lower like this. NO RUSH." We found structure at 6701 and it took us over 2hrs to build a base and chopped everyone around inside that tight 15pt range.
I will post an update around 10am EST.
---------------------------------------------------------------------------------------------------------------------
Couple of things about how I color code my levels.
1. Purple shows the weekly Low
2. Red shows the current overnight session High/Low (time of post)
3. Blue shows the previous day's session Low (also other previous day's lows)
4. Yellow Levels are levels that show support and resistance levels of interest.
5. White shows the trendline from the August lows.
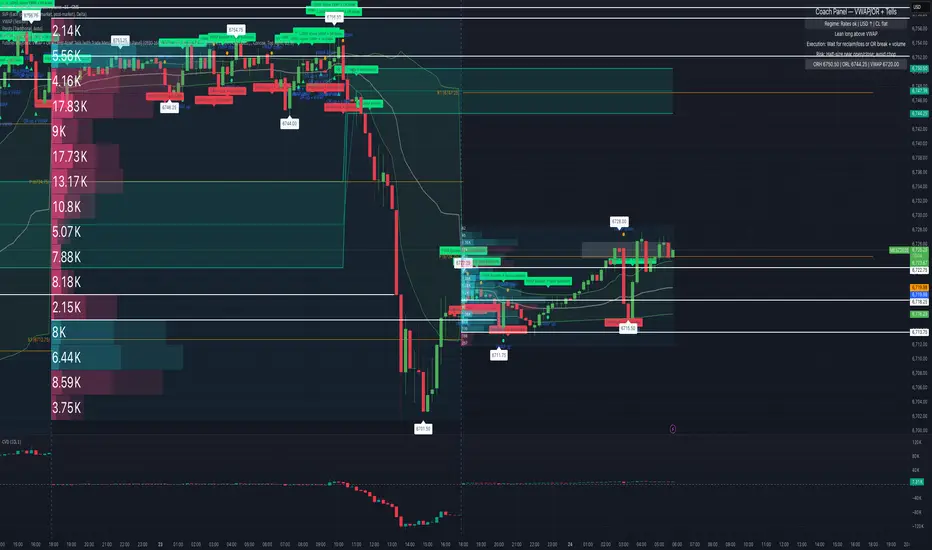
VWAP/OR Setups & Macro Crosscurrents (Sept 24, 2025)The S&P 500 (MES1!) is currently in a volatile state as Wednesday’s trading session commences.
Macro headwinds have dampened expectations for further rate cuts, leading to weakness in Big Tech yesterday. On the other hand, sector tailwinds have emerged, with Micron reporting strong Q4 earnings and Boeing and Palantir forming an AI partnership. These developments have generated after-hours optimism, supporting the performance of semiconductors and AI-related stocks.
This volatile environment presents opportunities for scalpers. The volatility around VWAP/OR levels, coupled with liquidity-driven inflections, creates fertile ground for scalping.
Chart Context (MES1! – 15m & 5m overlays):
VWAP serves as a key pivot point, with multiple reclaims and rejections occurring overnight. The ORH stands at 6720.50, while the ORL is at 6719.75. As of pre-market, the VWAP is also at 6719.75. High-volume nodes at 6710–6722 act as scalp magnet zones. The overnight low at 6701.50 remains the downside inflection point.
Scalping Plan:
- Long bias above VWAP/OR breaks with volume. Target 6728 to 6735+.
- Fade VWAP rejections back to OR. Quick 1–2pt rotations.
- Avoid chop inside VWAP compression.
Risk Management:
- Use half-size into the open; scale only on confirmed breakout.
- Hard stop: sustained trade below 6701.50.
- Event risk: 10:00 AM New Home Sales, 4:10 PM Mary Daly speech.
Takeaway:
Scalpers should focus on reacting to market movements rather than predicting future trends. The ongoing debate between Powell and Micron is likely to lead to whipsaws in the market. Therefore, it’s crucial to adhere to VWAP/OR discipline, respect liquidity pockets, and let the market tape confirm the direction of the trade.

day six 100 to 1,000,000I'm at a loss for words, so I will just say my lack of self control and understanding, blew the account again, I'll be restarting next week. I will be better.

Introduction to Arbitrage in Global MarketsPart 1: Understanding Arbitrage – The Concept
Arbitrage is a fundamental concept in finance that has existed for centuries, yet it has evolved significantly with the growth of global markets, technology, and financial instruments. At its core, arbitrage is the practice of taking advantage of price differences between markets for the same asset, security, or commodity. By buying low in one market and selling high in another, traders can theoretically make risk-free profits.
Arbitrage is often considered a mechanism that helps maintain market efficiency. Prices in global markets are constantly influenced by supply, demand, and other economic variables. When a price discrepancy arises, arbitrageurs exploit it, which eventually brings prices in different markets back into equilibrium.
Key Characteristics of Arbitrage
Risk-Free Profit (Theoretical Concept):
In ideal conditions, arbitrage is risk-free because it exploits simultaneous price differences. However, in real-world markets, transaction costs, taxes, and timing issues can reduce or eliminate these profits.
Market Inefficiency Exploitation:
Arbitrage exists because markets are not perfectly efficient. Price discrepancies may arise due to delays in information, regulatory differences, or market segmentation.
Simultaneous Transactions:
To be considered true arbitrage, the transactions must occur nearly simultaneously to avoid exposure to price fluctuations.
Leverage of Technology:
In modern global markets, arbitrage often requires sophisticated technology, high-speed trading platforms, and algorithms to detect and exploit price differences in milliseconds.
Types of Arbitrage in Global Markets
Arbitrage is not a one-size-fits-all concept. Over time, financial markets have developed various forms of arbitrage to address different market inefficiencies:
Spatial Arbitrage (Geographical Arbitrage):
This involves exploiting price differences for the same asset across different geographic locations. For example, gold might trade at a slightly lower price in London than in New York. Traders can buy in London and sell in New York, profiting from the discrepancy.
Triangular Arbitrage (Currency Arbitrage):
In the forex market, triangular arbitrage occurs when there is a price imbalance among three currencies. For instance, a trader might notice that the direct exchange rate between USD and EUR is inconsistent with the indirect exchange through JPY. By converting USD → JPY → EUR → USD, a profit can be realized.
Statistical Arbitrage (StatArb):
This approach uses statistical models to identify mispriced securities. Instead of relying solely on observable price differences, traders use historical data and correlations to predict temporary inefficiencies. It is widely used in equity markets and relies heavily on quantitative models and algorithms.
Merger Arbitrage (Risk Arbitrage):
In the M&A (Mergers & Acquisitions) market, arbitrage involves buying the stock of a company being acquired at a discount to the acquisition price and selling the acquirer’s stock if applicable. While profitable, this type carries higher risk due to regulatory hurdles and deal failures.
Convertible Arbitrage:
This involves trading convertible bonds and the underlying stock to exploit price differences between them. Investors buy the undervalued asset and hedge the risk with the other, aiming for a risk-adjusted profit.
Regulatory and Tax Arbitrage:
Different countries have varying tax policies and financial regulations. Some firms structure transactions to exploit these differences to minimize tax liability or regulatory costs. While profitable, it must comply with legal frameworks to avoid penalties.
The Role of Arbitrage in Global Market Efficiency
Arbitrage plays a crucial role in maintaining price consistency across global markets. By exploiting temporary discrepancies:
It narrows bid-ask spreads in financial instruments.
Encourages market integration, connecting local and international markets.
Improves liquidity, as arbitrageurs provide capital and facilitate transactions.
Reduces opportunities for persistent mispricing, making markets more efficient.
Without arbitrage, global markets would suffer from persistent inefficiencies and price distortions. However, with the growth of technology and algorithmic trading, price discrepancies are often corrected in milliseconds, leaving very narrow windows for profitable arbitrage opportunities.
Challenges and Risks in Global Arbitrage
Despite its theoretical promise of risk-free profit, arbitrage in practice involves multiple risks:
Execution Risk:
Delays in executing trades across different markets may lead to losses if prices move before the transaction completes.
Liquidity Risk:
Some markets or assets may lack sufficient liquidity, preventing large trades without impacting prices.
Counterparty Risk:
In global markets, trades often depend on intermediaries. Failure of a counterparty can result in losses.
Regulatory Risk:
Different countries impose varying regulations on trading, capital flows, and taxation. Arbitrage strategies must comply with legal frameworks, or traders risk fines and penalties.
Technological Risk:
Algorithmic and high-frequency trading rely on robust infrastructure. Any malfunction or latency can result in missed opportunities or losses.
Currency and Political Risk:
For international arbitrage, currency fluctuations and political events can quickly erode potential profits.
Global Examples of Arbitrage
Forex Markets:
A classic example is triangular arbitrage among major currencies (USD, EUR, JPY). Even small inefficiencies can generate millions in profit when leveraged across large volumes.
Commodity Markets:
Oil, gold, and agricultural commodities are traded globally. Traders exploit differences in local futures prices or spot markets to profit.
Equity Markets:
Stock exchanges like NYSE, NASDAQ, and LSE often have slight price differences for dual-listed companies. High-frequency traders exploit these micro-movements.
Cryptocurrency Markets:
With the rise of digital assets, arbitrage opportunities emerge across crypto exchanges. Bitcoin, for example, might trade at slightly different prices on Binance, Coinbase, and Kraken.
Part 2: Strategies and Techniques of Arbitrage in Global Markets
1. Classical Arbitrage Strategies
Even in the modern, high-speed trading era, many fundamental arbitrage strategies remain relevant:
a) Cash-and-Carry Arbitrage
Mechanism: Involves buying an asset in the spot market and simultaneously selling its futures contract if the futures price is higher than the spot price plus carrying costs (storage, insurance, interest).
Example: Suppose gold is trading at $2,000/oz in the spot market, while the 3-month futures contract is $2,050/oz. Buying gold today and selling the futures contract locks in a profit, minus carrying costs.
Significance: This strategy aligns spot and futures prices and reduces market mispricing.
b) Reverse Cash-and-Carry Arbitrage
Mechanism: Happens when futures prices are lower than the spot plus carrying costs. Traders sell the spot asset short and buy futures.
Impact: Prevents futures prices from diverging significantly from spot prices, stabilizing derivative markets.
c) Triangular Currency Arbitrage
Mechanism: Exploits discrepancies in exchange rates among three currencies. Traders convert Currency A → B → C → A, aiming for a net gain.
Practical Note: Most forex platforms now detect and automatically exploit small discrepancies, leaving minimal manual opportunities.
2. Statistical and Quantitative Arbitrage (StatArb)
Modern arbitrage increasingly relies on data and algorithms. Statistical arbitrage differs from classical arbitrage because it:
Uses historical price data, correlations, and probability models.
Trades pairs of assets that historically move together but temporarily diverge.
Example: Pairs Trading
Identify two historically correlated stocks, say Stock X and Stock Y.
If X rises significantly while Y lags, buy Y and short X, betting their prices will converge.
Advantage: Market-neutral; profits even in volatile markets if divergence corrects.
Tools Used
Machine learning algorithms to detect anomalies.
High-frequency trading systems for rapid execution.
Risk management frameworks to prevent losses if correlations fail.
3. Risk Arbitrage (Merger Arbitrage)
Mechanism: Focuses on corporate events, such as mergers or acquisitions.
Strategy: Buy shares of the target company at a discount to the announced acquisition price and sell shares of the acquiring company if applicable.
Risks: Deals may fail due to regulatory rejection, shareholder opposition, or financing issues.
Example: If Company A announces it will acquire Company B for $100 per share, and B’s stock trades at $95, arbitrageurs may buy B’s stock hoping it rises to $100 upon deal completion.
4. Technology and Algorithmic Arbitrage
Global markets are increasingly dominated by high-frequency trading (HFT) and automated arbitrage:
Speed Matters: Price discrepancies may exist for mere milliseconds. Only advanced trading algorithms can detect and execute trades fast enough.
Co-location Services: Many hedge funds place servers physically close to exchange servers to reduce latency.
Cross-Market Monitoring: Algorithms monitor multiple global exchanges in real-time for mispricing opportunities.
Example: Buying an undervalued stock in the London Stock Exchange and simultaneously selling its equivalent in the NYSE within milliseconds.
5. Global Commodity Arbitrage
Arbitrage in commodities markets often exploits:
Geographical differences: Prices of oil, gas, or metals vary by region due to local demand, transportation costs, and storage constraints.
Time-based differences: Futures contracts may temporarily misprice compared to spot prices.
Example: Crude oil may be cheaper in the Middle East than in Europe due to local supply-demand imbalances. Traders can transport and sell it at a higher price.
6. Cryptocurrency Arbitrage
Cryptocurrencies present a new frontier:
Exchange Arbitrage: Prices of the same cryptocurrency differ slightly across exchanges like Binance, Coinbase, and Kraken.
Triangular Crypto Arbitrage: Similar to forex, using three crypto pairs.
Decentralized Exchange Arbitrage: Differences between decentralized and centralized exchanges can yield opportunities.
Challenges: High transaction fees, blockchain confirmation delays, and regulatory risks can reduce profits.
7. Implementing Arbitrage: Key Considerations
Even seasoned traders must navigate practical and operational challenges:
Transaction Costs: Profits can evaporate after commissions, spreads, and taxes.
Liquidity: Thinly traded markets can prevent large trades without moving prices.
Currency Conversion: International arbitrage often requires currency conversions, introducing risk.
Legal Compliance: Cross-border trades must comply with regulations, taxes, and anti-money laundering laws.
Capital Requirements: Arbitrage often involves leveraging large amounts of capital to generate meaningful profits.
8. Real-World Examples of Arbitrage in Global Markets
Forex Arbitrage: Major banks frequently exploit triangular currency arbitrage, though opportunities are brief due to automated trading.
Stock Market Arbitrage: Dual-listed companies, e.g., Royal Dutch Shell in London and Amsterdam, present opportunities for price convergence.
Commodity Arbitrage: During periods of supply disruption, oil traders profit from regional price differences.
Crypto Arbitrage: Bitcoin and Ethereum trades across global exchanges illustrate how rapid price movements create opportunities.
Buying momentum is buildingBuying momentum is building in the daily structure of the S&P 500 futures market. The expectation is for continuation to the upside with the next objective being 6770.

Day 5 100 to 1,000,000 The Hour tf was outrunning the 9 ema, was waiting to see a pull back. Jumped into lower tf"s starting first on the 15m then 5m marking all respected gaps and liquidity. then finally the 1m for my entry and exit.

SPX Mid-TermSome thoughts on SPX. I don't want to outline the logic too clear but this chart summarizes it. I am aiming for a decent correction.
MESZ2025 WEEK 39 SEPT 21ST Looking for MON, TUE, WED to be the low of the week, trading towards then away from he daily VIB. Because of PMI on TUES look for early week run
Look for buying opportunities once price has broken below the 3H Bullish breaker #6715. Note that price can run lower into the BOB (Bullish OB) $6703 or $6700 before turning around.
IF- price closes below the 3H OB at $6797. Hold to see if price runs lower breaking and closing below 3H swing lows. You could be wrong in your analysis and price may be trying to run lower.
NOTE we are entering MC-NM. This is typically a retracement which should be to the up side given market structure.
NOTE: you are looking to hold for a 12 point run based on the fib. The best BUYs will be formed below $6715
CALENDAR EVENT
MON
- 12PM - FOMC SPEAKER
TUES
- 9:45AM - PMI (HIGH)
- 12:35AM - POWELL SPEAKS (HIGH)
WED
- 10AM - NEW HOMES SALES
THUR
- 8:30AM - FINAL GDP (HIGH)
- 10AM - EXISTING HOME SALES
FRIDAY
- 8:30AM - CORE PCE INDEX (HIGH)
Final Note
- remember to keep track of midnight/8:30 opening prices. Always refer back to the 1H and 3H
to confirm what side of the market you should be on.
- Alway look to buy in a discount range and sell in a premium range.
Risk- Only risk 150- 200 per trade on initial entry. you can add lots once you confirm trade is good. Refer back to higher TF before adding lots.
Max two trades per session.

day 4 100 to 1 millionlong time frames were to hot to be looking for a short of that significance. In that situation one is better off not trading at all.
I thank God for this lesson I learned, and am eager to learn and share.

Asia may set the tone for Monday's price actionThe expectation is continuation to the upside in the S&P 500 daily chart. A clue to that follow-through to the upside may be the Asia session which begins at 5 o'clock central time on Sunday evening.

ID: 2025 - 0095.5.2025
Trade #9 of 2025 executed.
Trade entry at 137 DTE (days to expiration).
Trade construct is a PDS (put debit spread) at Delta 15 combined with a PCS (put credit spread) at Delta 15. Overlapping short strikes give it the "unbalanced" butterfly nomenclature.
Sizing and strike selection is designed to keep the risk/reward "AT EXPIRATION" to a 1:1 risk profile. This lets charm work it's magic (second order greek), while exploiting the fact that this is a non-directional bias. The process is a disciplined and systematic approach letting time decay evaporate the extrinsic time value from the short options until target profit is achieved.
OF NOTE: This trade opened at EXCELLENT fills, and there is zero risk to the upside. The danger is of a catastrophic move to the downside, which will bring in phenomenal gains for ID 006 and 008. 😊
Happy Trading!
-kevin
