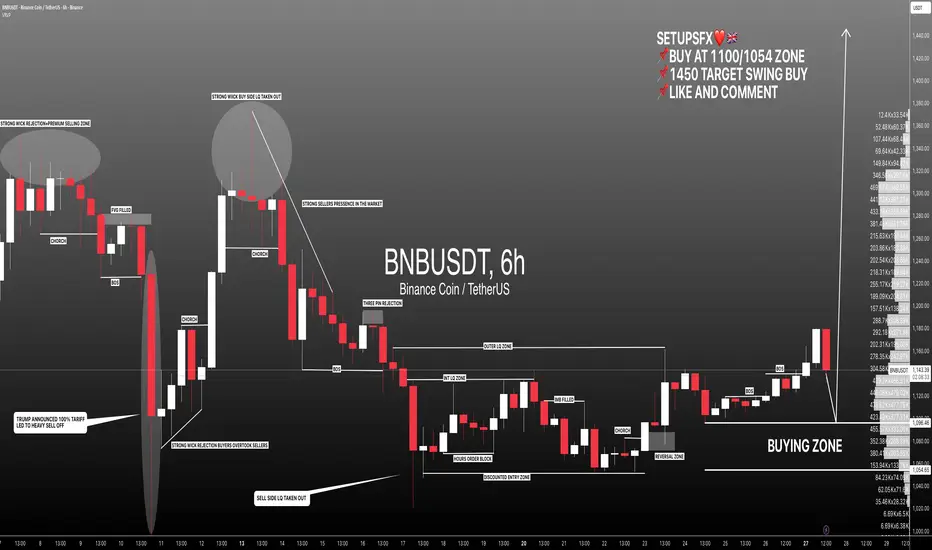
#BNBUSDT: Targeting 1450, One Swing Entry And Target**BINANCE:BNBUSDT**
Buyers still have control in the market in the daily time frame. However, there is still sellers’ pressure for the short term which is favourable. We want the price to reach our buying zone and move sharply upwards.
This is possible as there is major news coming up this week on Friday which is the Non-Farm Payroll (NFP) data. This economic data will influence the crypto market and other financial instruments.
Our target is to swing buy and close the position at 1450. However, the final closing price is at your discretion.
If you find our work helpful please like and comment.
Team Setupsfx_
Trade ideas
BNNBUSDT Forming Bullish MomentumBNBUSDT is showing signs of strong bullish momentum, forming a classic bullish wave pattern on the chart. This pattern typically indicates the continuation of an upward trend following a period of consolidation. The recent increase in trading volume supports the potential for another bullish leg as buyers continue to accumulate at current price levels. BNB, being a leading asset in the crypto market, often acts as a barometer for overall investor confidence, and the latest structure suggests renewed optimism among traders.
With an expected gain of 50% to 60%+, BNBUSDT could be preparing for a significant upside move if key resistance levels are broken. The formation of higher lows and sustained volume inflows indicate that market participants are positioning for potential breakout opportunities. Technical indicators such as momentum oscillators and moving averages are aligning with this bullish setup, providing further confirmation that BNB may continue to strengthen against USDT.
Investor interest in Binance Coin remains high as the project continues to play a central role in the broader crypto ecosystem. This ongoing engagement from traders and institutions provides fundamental support to the bullish technical outlook. If momentum continues to build, BNB could enter a new phase of price expansion, attracting more attention from both short-term traders and long-term investors.
✅ Show your support by hitting the like button and
✅ Leaving a comment below! (What is You opinion about this Coin)
Your feedback and engagement keep me inspired to share more insightful market analysis with you!
TradeCityPro BNBUSDT Heading Toward a New ATH?👋 Welcome to TradeCityPro Channel!
Let’s dive into the BNB (Binance Coin) analysis — one of the strongest and most bullish charts in the market. Currently, after correcting from its All-Time High (ATH), the price is consolidating within a sideways range, showing that buyers and sellers are in a tug-of-war.
🌐 Overview of Bitcoin
Before we begin, note that we’ve moved the Bitcoin analysis to a dedicated daily report for deeper insights into its market behavior, dominance, and trend structure:
👉 TradeCityPro Bitcoin Daily Analysis
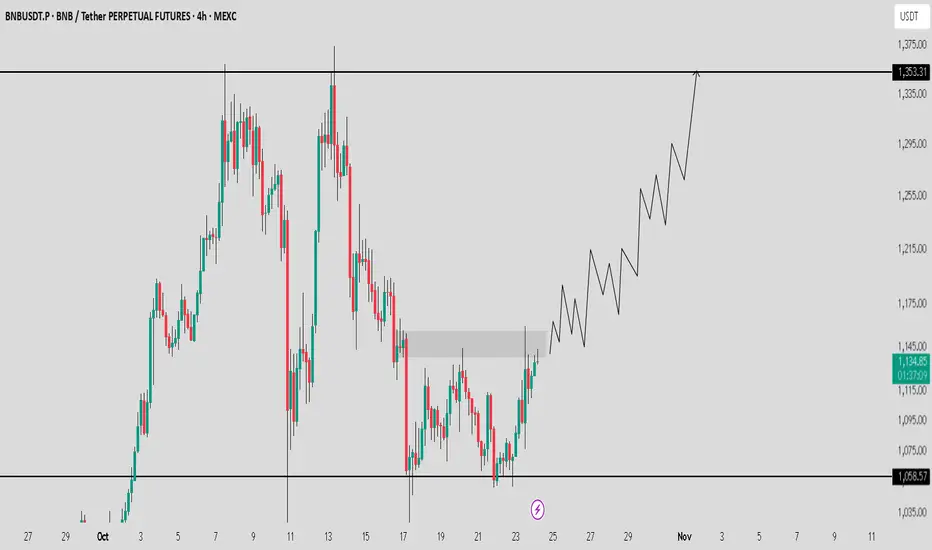
📊 Technical Overview (4H Timeframe)
After facing a heavy rejection from its ATH, BNB once again attempted to retest that level. However, a fake breakout (false move above resistance) led to another sharp correction, pushing the price back down into the range.
Interestingly, this correction bounced exactly from the $1054 support zone, the same level that previously acted as a strong reversal point. This repeated reaction confirms how critical this support is — not only because it aligns with the 50% Fibonacci retracement level, but also due to its importance in the Dow Theory structure as a mid-wave equilibrium.
📈 Long Setup (Bullish Scenario)
If price breaks above $1129, it could trigger an early long position setup — signaling that buyers are regaining control before another major leg up. This move would likely be the early breakout signal ahead of a potential new ATH attempt.
📉 Short Setup (Bearish Scenario)
For short positions, the $1054 level remains the key trigger. A clean breakdown below this zone would indicate the loss of a major support and could open the way for a deeper retracement.
However, keep in mind — this is a high-impact support zone, so avoid placing tight stop-losses or over-leveraged entries. Price volatility is expected to increase around this level.
🎯 Conclusion
BNB remains one of the strongest altcoins structurally, and as long as it holds above the $1050 region, the bullish structure remains valid. The next few sessions will be crucial — watch the $1129 breakout for confirmation of renewed bullish momentum, or the $1054 breakdown for signs of weakness.
📝 Final Thoughts
Stay calm, trade wisely, and let's capture the market's best opportunities!
This analysis reflects our opinions and is not financial advice.

BNB Holds Strong Support — Potential Rebound AheadBNB Holds Strong Support — Potential Rebound Ahead
BNB is currently trading near a strong support zone around 1,065–1,080, which has been tested multiple times in the past. This area has proven to be a key level where buyers tend to step in.
As long as the price remains above this support, a bullish rebound is likely. The first resistance to watch is around 1,140, followed by 1,190 and 1,240 as higher upside targets.
If the support at 1,065 breaks decisively, however, it could signal further downside pressure. But for now, the structure suggests a potential short-term recovery from the current levels.
You may find more details in the chart!
Thank you and Good Luck!
❤️PS: Please support with a like or comment if you find this analysis useful for your trading day❤️

BNB / USDT Gearing up for a Bullish move towards $1350BNB is looking strong and showing solid momentum for a move towards $1300 - $1350. Once it clears the key resistance level, we can expect a bullish continuation in the coming days.
Always manage risk wisely and wait for confirmation before entering.
BNBUSDT the double top dump it, now price near critical support The current technical structure presents a clear and critical juncture. Price is now testing a major support zone at the $1,000 level, a decisive point for future direction.
The market's trajectory is now contingent upon the price action at this pivotal support:
Bearish Scenario (Breakdown): A confirmed breakdown and sustained close below the $1,000 support, particularly on elevated volume, would signal a failure of buyer defense. This breach would invalidate the current consolidation structure and likely trigger a significant sell-off. The subsequent measured move projects a decline toward a target range of $600 to $800, representing the next significant area of historical liquidity and support.
Bullish Scenario (Holding & Reversal): Conversely, a strong rejection from this $1,000 zone—evidenced by bullish reversal patterns like a hammer or bullish engulfing candle—would demonstrate robust demand at this key level. This would reaffirm the support's integrity and could catalyze a robust bullish impulse. The initial technical objective would be a retest of the upper boundary of the prevailing trading channel. A decisive breakout above this channel resistance would then open a clear path toward higher targets, beginning with the $1,500 region.
In summary, the $1,000 level is our line in the sand. Traders should monitor price action here closely to gauge the next dominant directional move.
DISCLAIMER: ((trade based on your own decision))
<<press like👍 if you enjoy💚

BNBUSDT: Price Rises Up Slowly, Failed To Break The Support!..Hi traders,
BNBUSDT has been ranging up gradually, after it failed to break under the lower zone. there was an assumption of breakdown below this area, based on the chat pattern structure been perceived. As the Bullish range continues, we anticipate $1,312 as potential target.
Meanwhile a breakdown below this support would trigger downside movement.
Like and follow up for more insight on the market.
Thanks for reading.

BNB the move to 1500$ soon can start As observed and previously outlined in our earlier analysis, we were monitoring the resilience of the critical $1,000 support level. This level, further reinforced by the newly formed ascending channel's support, has demonstrated significant strength by holding firmly. This successful defense against selling pressure indicates a consolidation of bullish momentum. Consequently, the price structure now suggests a high probability of a strong upward move, with our projected targets residing at $1,300 and $1,500.
DISCLAIMER: ((trade based on your own decision))
<<press like👍 if you enjoy💚

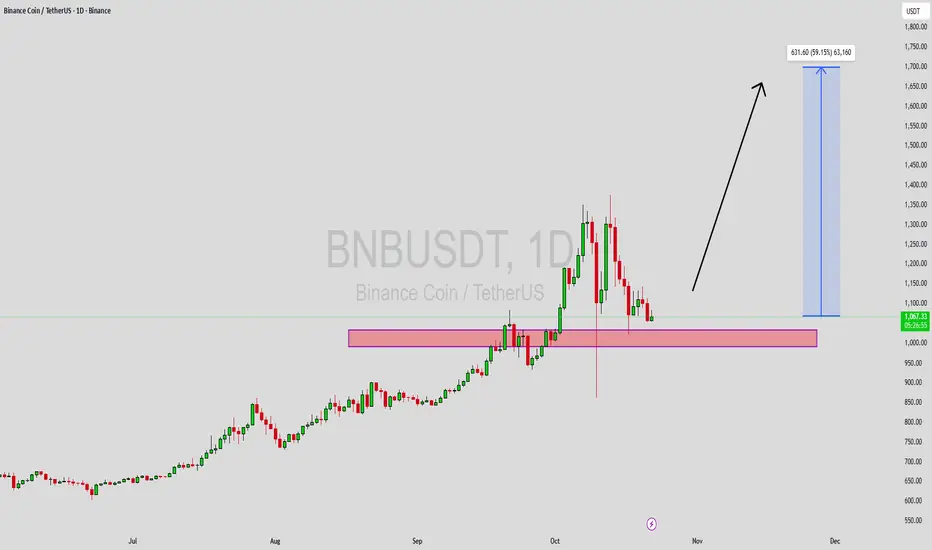
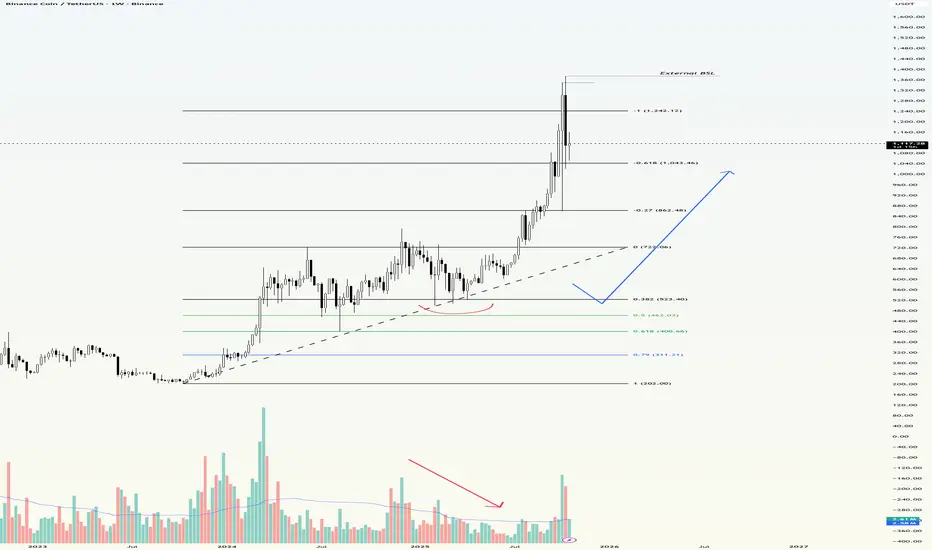
BNB/USDT | BNB Update – Correction After New ATH!By analyzing the #BNB chart on the weekly timeframe, we can see that after reaching a new all-time high at $1,376, BNB entered a healthy correction phase and is now trading around $1,100. Despite this pullback, the structure remains bullish as long as the price holds above $1,050, which currently acts as the key support zone.
If BNB manages to stay above this level, the uptrend could resume, with potential upside targets at $1,300, $1,400, and $1,550 — consistent with previous projections. However, a confirmed break below $1,050 could open the door for a deeper drop toward the $850 region.
For now, bulls still have control, but the next few days will be crucial to confirm whether this correction is just a pause or the start of a deeper retracement.
Please support me with your likes and comments to motivate me to share more analysis with you and share your opinion about the possible trend of this chart with me !
Best Regards , Arman Shaban

BNB/USDT 1H chart short-term📊 1. Trend structure
• We see an upward channel (black trend lines) - the price rebounds from the lower support line and gradually heads upwards.
• Currently, the rate oscillates in the middle zone of the channel - approx. 1,115 USDT.
• As long as the lower trend line (approx. USDT 1,090) holds, the bullish structure is intact.
⸻
🟩 2. Support and resistance zones
Support:
• 1,106 USDT → local intraday support (already tested several times).
• 1,090 USDT → stronger support + trend line.
• 1,056 USDT and 1,016 USDT → lower zones, in case of a stronger correction.
Resistance:
• 1,125 USDT → local resistance that is currently blocking the upward move.
• 1,148 USDT → another strong resistance, after breaking it, a test of 1,174 USDT (upper border of the channel) is possible.
⸻
📈 3. Indicator – Stochastic RSI
• Currently, the Stoch RSI lines are starting to bounce from bottom to top, after previously entering the oversold zone.
➡️ This is a short-term rebound signal, but not yet a strong buy signal - confirmation of the break through of the ~1,125 USDT level is needed.
⸻
⚙️ 4. Technical scenarios
Bullish:
• Maintaining 1,106–1,090 USDT and breaking above 1,125 USDT → target 1,148 → 1,174 USDT.
• The trend support at 1,090 USDT acts as a buying zone for swing traders.
Bearish:
• A break below 1,090 USDT will negate the channel structure → a possible drop to 1,056 USDT and then 1,016 USDT.
• The RSI will then likely enter a strong oversold zone.

$BNB 1h Looking hot 🟢 Entry : 1084$ - 1070$
🎯 Tps : 1110$ - 1130$ - 1160$ - 1200$
🔴 Invalidation : 1025$
📌 Do proper money management.. Use low leverage.. DYOR... BINANCE:BNBUSDT.P

BNBUSDT.P - October 23, 2025The current price action is testing a major 4-hour resistance zone near $1,142.74, which is an ideal entry for a short-sell setup. The target for the short would be to ride the price back down to the recent swing low around the $1,076 support. Plan your trades accordingly; this is an extremely high-risk setup given the major economic and geopolitical announcements expected from President Trump, which could trigger immediate, sharp volatility.

DeGRAM | BNBUSD is under the resistance line📊 Technical Analysis
● BNB/USD continues its decline within a descending structure, repeatedly rejecting resistance near 1,100, signaling sustained bearish control.
● The price remains below key trendlines, and a confirmed breakdown below 1,020 could trigger a move toward the major support area near 960.
💡 Fundamental Analysis
● BNB faces pressure amid regulatory uncertainty around Binance and slower ecosystem growth, while broader crypto risk sentiment remains fragile.
✨ Summary
● Short bias below 1,100; objectives 1,020–960. Technical weakness and regulatory headwinds reinforce the medium-term bearish outlook.
-------------------
Share your opinion in the comments and support the idea with a like. Thanks for your support!

BNB 1H ChartCRYPTOCAP:BNB 1H Chart
Forming a Cup & Handle pattern.
Price holding above the FVG 1H zone, watching for a breakout above ~$1.1k
Next target: $1,190 (+7–8%) if momentum continues. 🚀

Binance Coin (BNB): Smaller Bullish Trend | EMAs Are SecuredBNB is slowly forming a smaller bullish trend — buyers have managed to break above the EMAs and are now working on a clean re-test, which looks like an ideal entry for a long. As long as they manage to hold this structure, we could see another strong leg up toward the upper zones we’ve marked.
Looks healthy so far, just need buyers to keep control over these short-term supports.
Swallow Academy

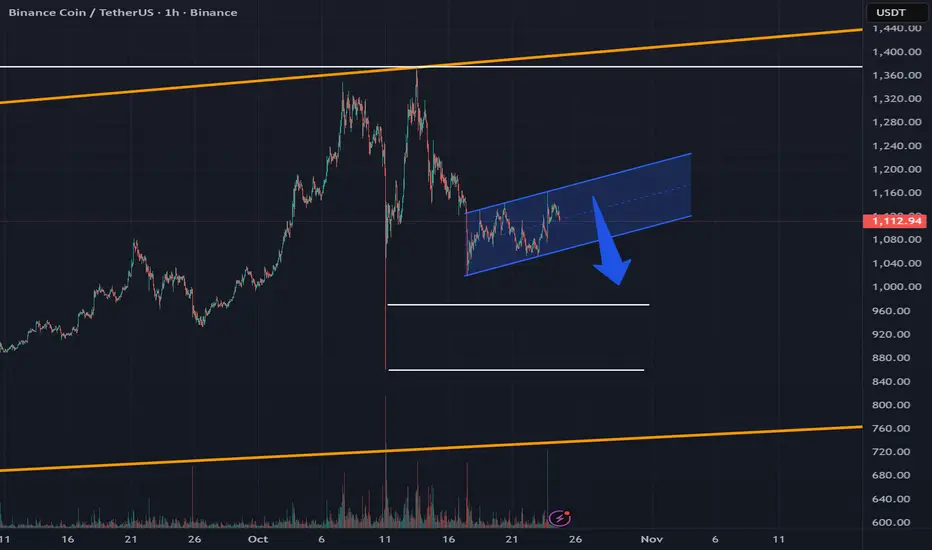
BNB forms bearish flag after double topBNB is moving in an ascending channel, which could turn into a bear flag at any moment. The chart has already completed a double top pattern. A bear flag pattern has formed locally; recent news about CZ has provided upward momentum, but the movement has remained within the local bearish pattern
Current price: $1,134
Probable movement according to the pattern to the nearest level of $1080 . If the lower channel of the corridor is broken, then with a high probability we can continue the movement to $1000
A speculative breakdown of the bearish scenario is likely if the upper channel is broken at $1225
Important!
This coin is extremely overheated, please be careful with it
---
More detailed analysis, additional charts, and key levels to watch are available on our site
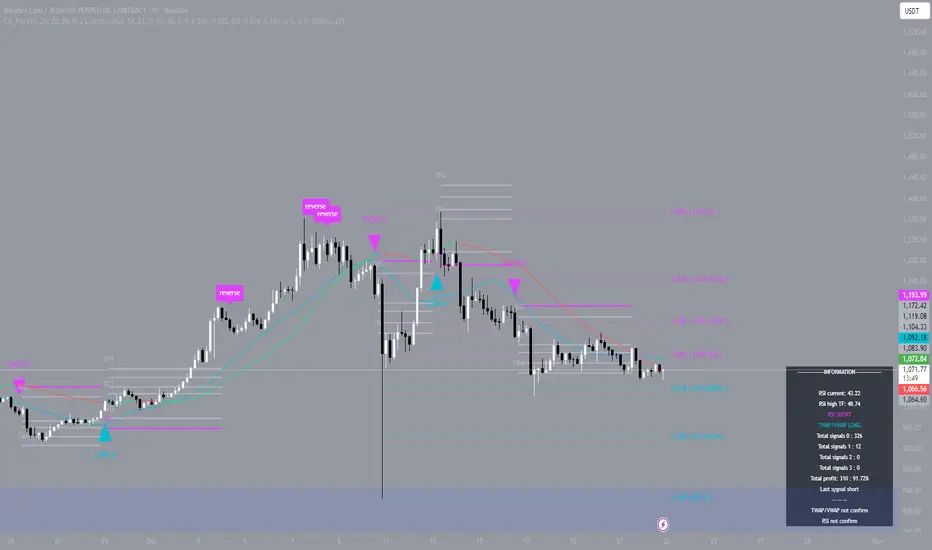
BNB rises after calmOn October 10, I watched the BNB 4-hour chart carefully. The market looked unstable, so I decided not to open a position, waiting for confirmation. That choice turned out to be right — a strong drop followed soon after, but previous take-profit levels had already been hit, which protected my balance.
On October 13, I entered on the next candle and closed the first target, taking about 2 percent profit without leverage. Nothing spectacular, but it was more about patience and discipline than chasing big moves. Then, on October 16, the setup repeated itself, but this time the momentum was stronger. All four targets were reached in sequence, giving me roughly 10 percent profit using 2x leverage.
I applied my secret custom strategy that helps analyze market structure without emotions. The indicator clearly highlighted fixation zones and confirmed trend stability. There are thousands of financial indicators on TradingView, but only a few can stay objective during turbulence. That objectivity becomes the true advantage when the market tests every trader’s discipline.
Neutral positionWhat scenario is possible? End of trend or continuation? This is not financial advice!
$BNB (daily): GOLDEN POCKET bounce, SPOT POSITION opened.Bought some CRYPTOCAP:BNB exactly in the GOLDEN POCKET as per my post published last nite.
Also, my Elliot's Wave count is getting a confirmation of a WAVE A, and if it's complete, we will have to see today. If complete, then a DEAD CAT BOUNCE is next, targetting $1156, $1198 or even $1240. And these are my 3 profit targets for this SPOT trade.
All the recent liquidity below has been swept nicely, always a bonus in terms of probabilities.
Any profit in these conditions is an achievement and takes skills while protecting your capital remains a priority over profits, just my 2c.
Stop loss is obvious to me, 50% of the trade below the GOLDEN POCKET, and another 50% below the 50 SMA (yellow upcurved line, at $1018 right now).
Candle closes, unless a bloodshed starts happening today in the US markets, if so, I will close manually. 👽💙

BNB/USDT 1D chart review📊 1️⃣ General context
• BNB price is approximately USDT 1,100, after correction approximately -0.85%.
• It is clear that the market is in a corrective phase after a strong increase - recent highs reached ~1,340 USDT.
• Currently, the rate is balancing between support ~1069 USDT and resistance ~1149 USDT.
⸻
🟢 2️⃣ Supports and resistances (key levels)
• Closest support:
🔸 1069 USDT (short term, red line)
🔸 985 USDT – stronger support (previously tested, below EMA 50)
🔸 884 USDT – strong long-term support (potential correction low)
• Resistances:
🔹 1149 USDT – first level to break
🔹 1226 USDT – important daily resistance
🔹 1344 USDT – main peak, border of the previous impulse
⸻
📈 3️⃣ Moving Averages (SMA/EMA 50/200)
• We see the yellow EMA 50 line and the green SMA 200 line crossed (EMA Cross 50/200).
👉 This is a golden cross - a medium-term growth signal.
• Currently, however, the price has fallen below EMA 50, which means supply pressure in the short term.
• As long as it stays above the 200 SMA (~1060-1070), the macro trend remains bullish.
⸻
📉 4️⃣ MACD
• The histogram is red and decreasing - this confirms that the downward momentum continues but may be weakening.
• The MACD line (blue) is approaching the signal line (orange), which may indicate an impending bounce.
⸻
🪫 5️⃣ RSI
• RSI is around 40-45, which is close to the oversold zone.
• This suggests that sellers may be losing strength and a technical rebound may occur soon.

BNB SHORTThe wave (3) traveled 162% of the distance, reached the trend line of the structure, and realized the potential of the wave (4) on a logarithmic scale. It's time for correction. Given the momentum formation scenario, this is the best point for a reversal on the chart.

Sell! (personal opinion, DYOR always)Remember — this is only my personal opinion, it’s emotional, and maybe you shouldn’t trust me. But here’s what I see happening right now.
This CRYPTOCAP:BNB pump looks extremely suspicious.
CZ has turned his back on the community he helped build, and now he seems to serve the same powers manipulating the crypto markets.
🚨 What’s going on:
On October 11th, over $400 billion (yes entired funds collapsed, the total of the liquidation is yet to be accounted for real, brace for a shocking number) in liquidations reportedly happened.
Binance allegedly reported only 5% of that — likely to hide the fact that their system failed catastrophically.
If true, Binance could be liable for massive financial damages.
💰 How it works:
CRYPTOCAP:BNB is being pumped using liquidity minted by Binance on their own CRYPTOCAP:BNB Chain.
They can mint unlimited CRYPTOCAP:USDT , creating fake buying power and distorting the market.
⚖️ What might happen next:
When justice catches up, Binance could face severe investigations and legal actions.
More traders and companies are starting to speak up — and we’ve only seen the tip of the iceberg.
If the justice system audit Binance, then they will have to remove the fake liquidity and rekt the ones who invested.
⚠️ My conclusion:
When the storm hits, CRYPTOCAP:BNB could crash beyond recognition.
Don’t be the one posting “I lost everything.”
There are safer investments — precious metals, bitcoin, solid stocks, real estate in Asia…
But CRYPTOCAP:BNB ? After what happened? It is a high risk asset considering how liable they are.
👉 Stay away until the truth unfolds.
#BNB #Binance #CryptoCrash #CZ #USDT #MarketManipulation #CryptoWarning #CryptoNews #BNBChain #Justice #CryptoInvesting #DYOR

BNB: The Party's Over. Here's the Short Setup.Yo.
Quick-fire analysis on BNB/USDT, looking across the M15 to H4 timeframes. The market gave us a technical bounce, a relief rally for the amateurs. Don't be fooled. The party is over, and the bears are now in control.
The Setup
Let's recap the recent chaos. After last Friday's mass liquidation event, BNB staged an absurd rally, tapping a new ATH around 1375 within three days. Hope you survived the volatility. That move, however, was pure euphoria, completely detached from the broader market reality.
While BNB was flying, BTC showed extreme weakness, failing to reclaim any meaningful levels. This divergence was a massive red flag. It was inevitable that BNB's gravity-defying move would correct, and correct hard.
My setup is classic, no-nonsense technical analysis: multi-timeframe Fibonacci levels, a hard focus on volume profile, and a tactical eye on order flow. The blue Fib levels are drawn on the H4 chart (macro trend), and the red Fibs are for the M15 chart (micro trend since the Friday low).
What's Happening Now
The chart is screaming "SELL" at a major point of technical confluence. For anyone who can read price action, this is crystal clear.
After a first test yesterday, the critical 0.618 Fibonacci support on the H4 timeframe was decisively broken today, October 17th. This wasn't just any Fib level; it was perfectly aligned with the Point of Control (POC) from the entire last uptrend—the area with the highest traded volume. Losing this level means the bulls have lost their single most important line of defense. The structure is broken.
The Levels That Matter
We've already hit our first target at 1022, which corresponds perfectly to the 1.272 Fibonacci extension from the H4 structure. The playbook from here is simple. We are now watching for a pullback to reload short positions.
- Short Entry Zone: I'm watching for a weak pullback into the 1093 zone. This area represents the '1' point of the H4 Fib retracement and is the ideal spot to the bag. Any bounce to this level that shows signs of exhaustion is a gift.
- Invalidation (Stop Loss): The line in the sand is a clean break and hold above 1125. A move above this level would negate the current bearish market structure and signal that the downtrend is compromised.
- Targets: I’m reaching two price
- The 1.414 Fibonacci extension, which brings us to the $988 area.
- A full leg down to the 1.272 extension on the M15 Fib, targeting the $865 region. This level also aligns with the previous major low, making it a powerful magnet for price.
I'm not betting on hope; I'm trading the evidence. The evidence shows the path of least resistance is down. Let's see how it plays out. As always, don't get rekt.
