HolderStat┆BNBUSD fixed above the resistance lineBINANCE:BNBUSDT has completed a flag breakout and is consolidating above $552. Price structure supports further upside toward $590. Key support lies between $545 and $548.
Trade ideas
$BNB LONG TERM VIEWCRYPTOCAP:BNB 🐂
DIRECTIONS: LONG 🟢
ENTRY: 732.2
SL: 710.9
MAX TP: 794.2
Margin 1-5%
If you've reached TP 1, you can set SL +. If not, set TP 2 to 1.2. ⚠️

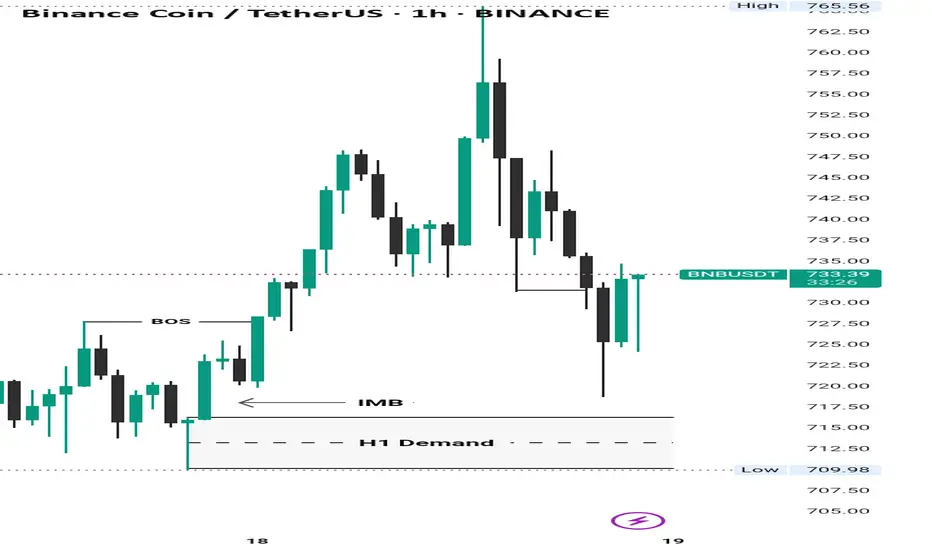
Binance Coin (BNB): Bearish CME + Possible Buying OpportunityBuyers are still showing resistance on BNB while sellers are slowly leading the price down; what we see is another buy-side movement happening very soon.
What we are looking for is either a touch to that bearish CME gap, which would fill the gap, or just an immediate movement from the current zone.
One way or another we are looking for that break of structure where our major buy zone would be sitting. If we fill that CME, then there might also be a good buying opportunity if we form MSB.
Swallow Academy

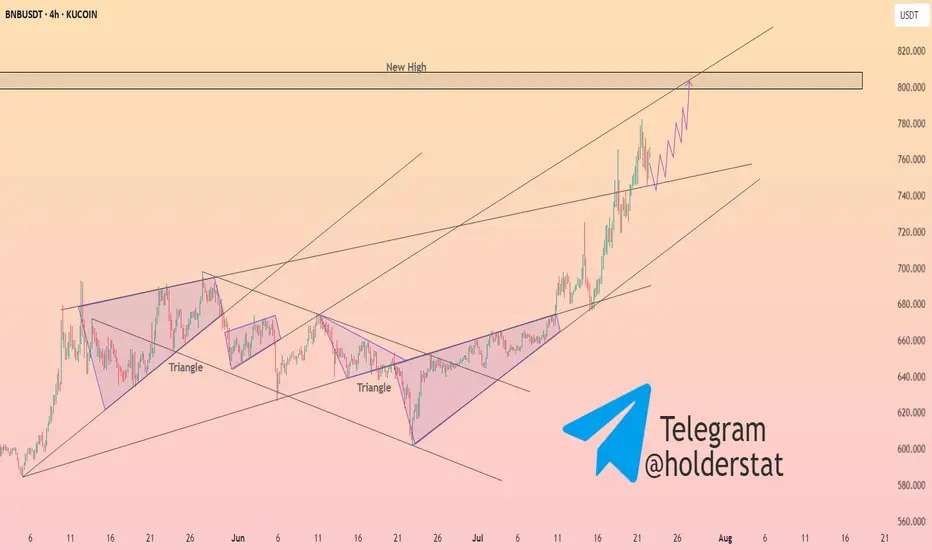
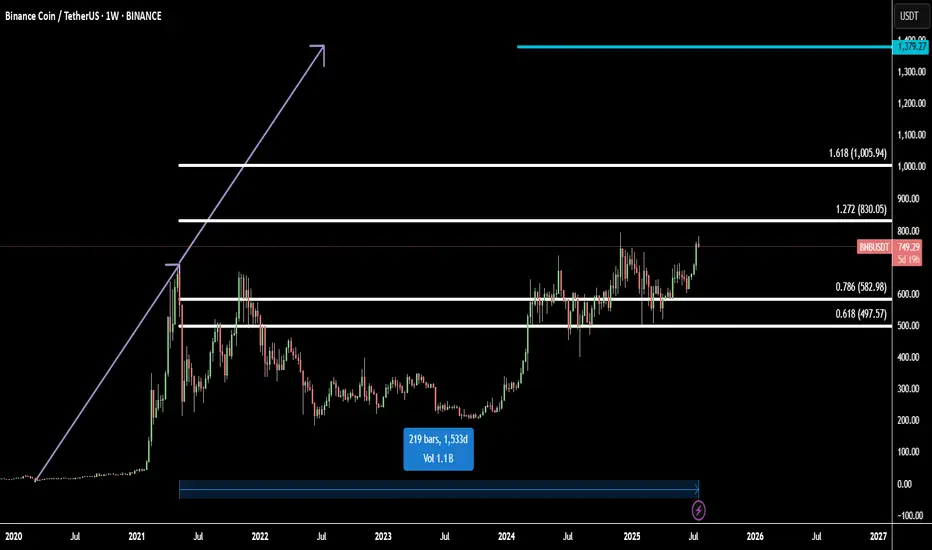
BNB Ready for All-Time High: Fibonacci + 1533-Day FlagBinance Coin (BNBUSD) is setting up for a major breakout, approaching its all-time high with strong momentum.
Technically, BNB has completed a 1533-day flag accumulation — a rare, long-term fractal consolidation that often precedes explosive moves. This massive base acts as a launchpad for the next bullish leg.
Using Fibonacci extensions, we identify two major upside targets:
Target 1: 1.272 Fib – 830.05 - the first resistance and profit zone
Target 2: 1.618 Fib – 1005.94 - key bullish extension from breakout range
Final Target: 1379.27
The final target is projected using fractal symmetry from previous bullish expansions, aligning with the broader market cycle and BNB’s historical price action.
This setup suggests a high-probability move toward new all-time highs and beyond, supported by strong technical structure and breakout energy.
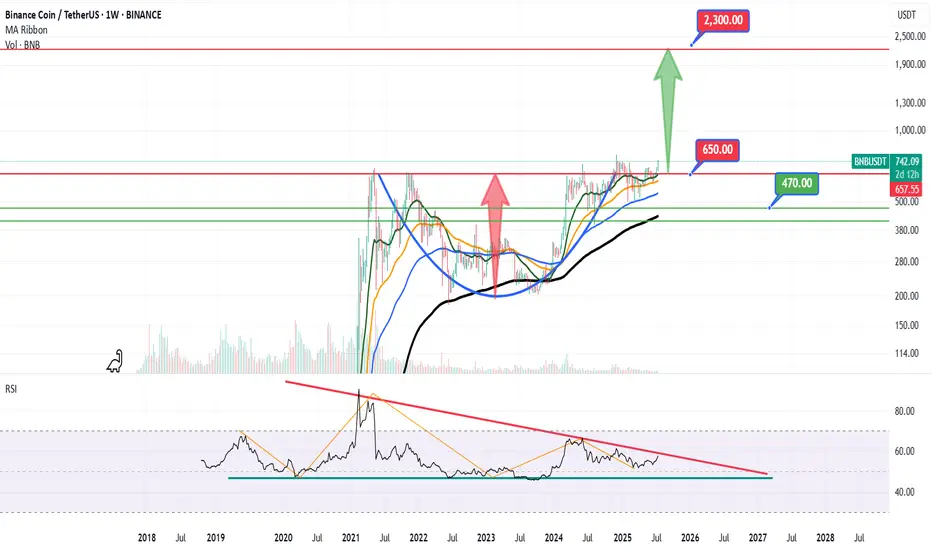
Massive Breakout Coming for BNB? Eyes on 1250, 1700, 2300 LevelsHello✌
Let’s analyze Binance Coin’s upcoming price potential 📈.
BINANCE:BNBUSDT , I expect an upward bullish trend in the long term.
I have three main targets in this analysis: $1250, $1700, and a final target of $2300. These targets could potentially be reached over a period of 2 to 6 years.
The price may form parallel channels along the way, which are shown on the chart. I also expect the current upward bullish channel to remain valid throughout this movement.
✨We put love into every post!
Your support inspires us 💛 Drop a comment we’d love to hear from you! Thanks , Mad Whale🐋
🐋Many of the points and levels shown on the chart are based on personal experience, feeling, and over 7 years of research and daily study of crypto charts.
Some of the lines, channels, and price zones are drawn to make the chart easier to understand and to help imagine possible future price movements.
I’ve also included one very big drop in price even bigger than the others because in the crypto market, it’s common for prices to suddenly fall hard and push out small investors and traders with positions.
The targets on the chart are not guaranteed; they might be reached, or they might not.📚

BNB LongI see a buy zone around 735 just after a significant FVG, and moreover, given the overall bullish strength of BNB, the pullback to happen next won't be a deep pullback but rather a light one. Confirming with the Fib retracement tool that zone sits well at the 38% pull back level, which is a good sign of a light bull back to continue the bullish move

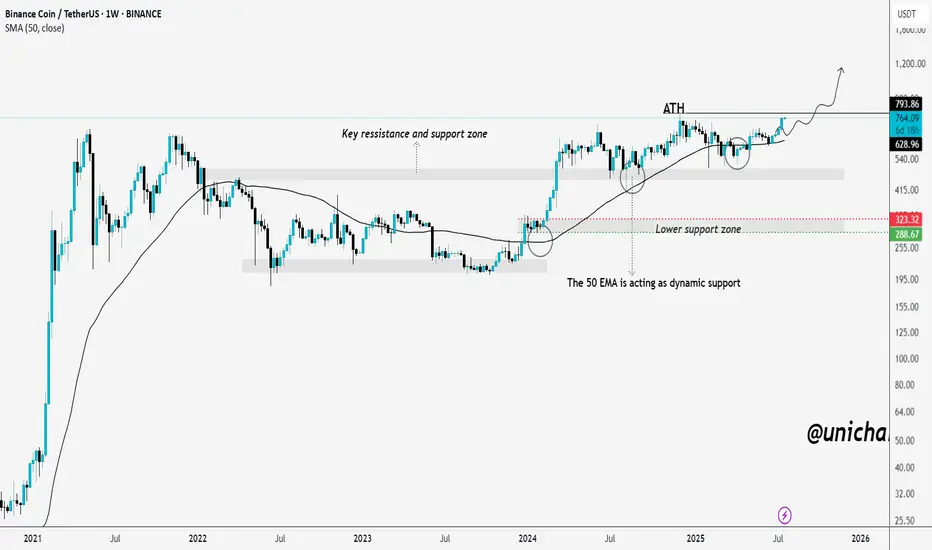
BNB on the Brink of a Breakout – ATH in Sight!We told you earlier — mark our words. BNB is now on the verge of breaking into a new all-time high, and the chart has been signaling this move for months.
The price has consistently respected the key support-resistance zone around $500–$540, and the 50-week EMA has acted as dynamic support throughout the uptrend.
Each dip into the lower support zone between $290–$320 was quickly bought up, showing strong buyer interest and demand. After several healthy consolidations and retests, BNB is once again approaching the previous ATH around $793.
If it breaks above with strong volume, we could enter price discovery mode. All the signs are aligning — and if you caught the early setups, you’re already in a great position. If not, it’s time to stay sharp and watch this breakout zone closely.
The momentum is real, and the fireworks might just be getting started.
THANKS
BNB LongPut limit order. Liquidity will be taken. After that, it has a great chance of going up. Let's see how it plays.a great.

BNB idea BNBUSD is extremely bullish on the daily timeframe
Can the buyers sustain their buying power to the upside
Looking at the H1 for a potential movement to the upside.
BNB/USDT Price Prediction - 1W (Updated)Trend Prediction - BNBUSDT Forecasting -
Resistance and Support Lines
It seems that the cup and handle pattern is forming
**** Yousef Sharafi ****
Follow me here for more analysis
Binance Coin (BNB) to $780? Chart Says 5.8% Rally Incoming!BNBUSDT is currently showcasing a clear bullish structure, supported by consistent demand and a strong breakout beyond previous resistance zones. The price action has steadily evolved into higher highs and higher lows since July 10, confirming bullish market control.
After consolidating around the 707–710 USDT range, the pair decisively broke out, flipping this level into support. The price is now hovering near 736.50 USDT, holding its gains despite brief intraday corrections.
The ascending pattern that started from mid-July saw a short-term dip toward 675 USDT, but strong buying interest quickly stepped in. This bounce marked the formation of a new swing low, followed by a powerful rally above the previous resistance.
The recent long-bodied bullish candles reflect strong momentum and possible accumulation by larger players. Buy and sell signals shown on the chart further validate the demand zone around 674–691 USDT, where bulls aggressively defended support.
The breakout structure is now entering a price discovery phase, with room for a measured move toward the upper resistance near 780 USDT, which is both a psychological round number and the projected Fibonacci extension zone.
________________________________________
📍 Trading Setup (Based on Chart)
• Entry Price: 736.50 USDT (current market price)
• Stop-Loss: 725.00 USDT (just below the recent structure low and horizontal support)
• Take-Profit: 780.22 USDT (Fibonacci target + psychological resistance)
• Risk: 11.78 USDT (~1.60%)
• Reward: 42.94 USDT (~5.82%)
• Risk-Reward Ratio: ~3.65 — favorable for swing-long positions
________________________________________
🧭 Key Zones to Watch
The support zone between 707.54 and 691.35 USDT is now the major demand base. As long as BNBUSDT holds above this area, the bullish thesis remains intact. A retest of this level followed by a bounce would further strengthen the ongoing uptrend.
Immediate resistance is at 737.28 USDT, but the market is attempting to flip this level. If it holds as support on the next retest, upside continuation to 780.22 USDT becomes highly probable.
If bulls fail to defend the 725 USDT level, we could see a deeper retracement toward 707 or 691 USDT, but currently that risk remains low given the strength of the latest breakout.

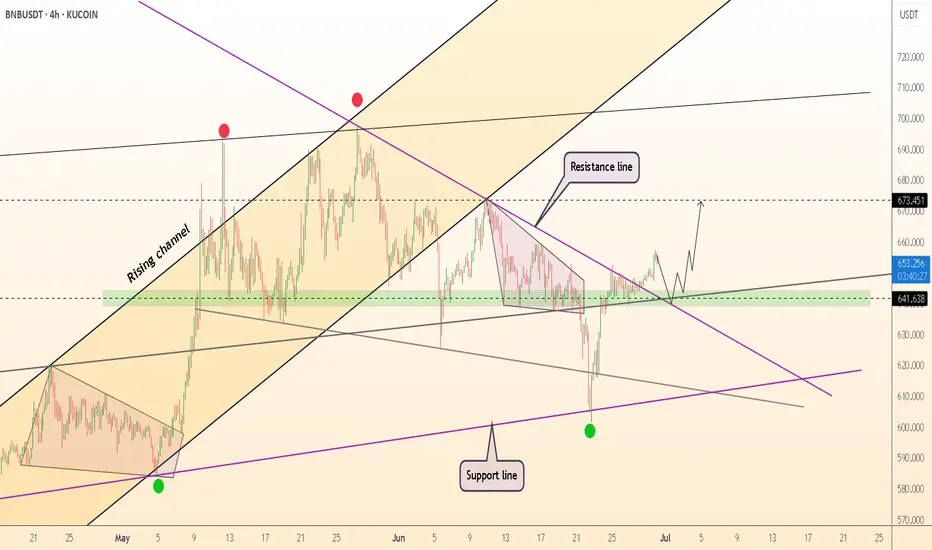
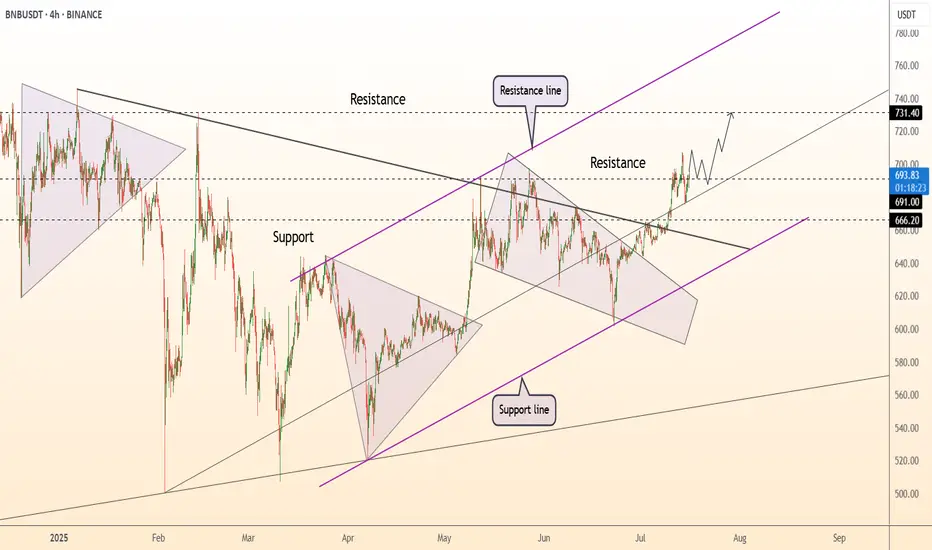
DeGRAM | BNBUSD above the resistance📊 Technical Analysis
● Candle closes have punched through the long-term black resistance and purple trend cap, turning the $666-673 breakout shelf into support as price tracks the grey inner up-sloper inside the rising channel.
● A pennant is coiling just beneath May’s peak; its measured pole and the channel geometry indicate $705 first, then the upper rail / horizontal supply near $731 once $700 gives way.
💡 Fundamental Analysis
● Binance’s 26ᵗʰ quarterly burn, slated for late July, is expected to remove more than 2 M BNB from circulation, reinforcing last week’s TVL uptick and sustaining bid interest .
✨ Summary
Long $666-680; sustained trade above $691 opens $705 → $731. Invalidate on a 4 h close below $641.
-------------------
Share your opinion in the comments and support the idea with a like. Thanks for your support!
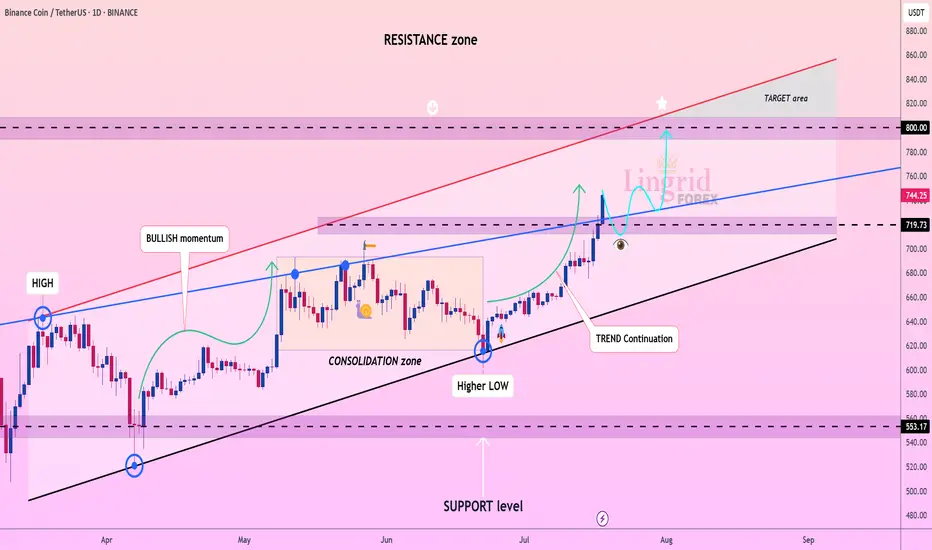
Lingrid | BNBUSDT Bullish MOMENTUM. Long from SUPPORT zoneBINANCE:BNBUSDT is continuing its bullish momentum after bouncing from the support trendline and breaking above the consolidation zone. Price has formed a higher low and followed through with strong impulse candles, pushing past local resistance around 720–740. The breakout confirms trend continuation within the upward channel, with price now aiming toward the 800 psychological level. The next leg higher could accelerate toward the upper resistance zone if support holds near 720.
📉 Key Levels
Buy trigger: Breakout above 740 confirmed
Buy zone: 719–730
Target: 800
Invalidation: Close below 700 support and trendline
💡 Risks
Rejection near horizontal resistance around 760
Bearish divergence on lower timeframes
Macro volatility from regulatory headlines or BTC sharp moves
If this idea resonates with you or you have your own opinion, traders, hit the comments. I’m excited to read your thoughts!

Why BNB Remains Bullish and Its Next Potential Move !Currently,is forming an ascending triangle, indicating a potential price increase. It is anticipated that the price could rise, aligning with the projected price movement (AB=CD).
However, it is crucial to wait for the triangle to break before taking any action.
Stay Awesome , CobraVanguard.

Bnb 4hr time frame iH&SAn activated iH&S pattern is formed a days ago. Targets are 675, 695 and 720.
If the 675 resist its a sign of weakness.
Pattern invalidation if closes below 643

Long BNBBNB has been consolidating above $600-$650 area since March 2024.
BTC dominance continuing to drop is a sign for leading alcoins like BNB to break-out.
Trade setup is as in chart.
Disclaimer:
This analysis is based on my personnal views and is not a financial advice. Risk is under your control.

#BNBUSDT: A Major Bull Move Incoming $1000 Target! Binance coin is currently in consolidation phase, with no clear direction of where it will go. We consider two possible areas where it may reverse. Both of these areas have a chance to hit $1000, which we believe the price could head towards once reversed.
If you like our idea, please like and comment!
Good luck and trade safely,
Team Setupsfx_

HolderStat┆BNBUSD breakoutBINANCE:BNBUSDT has reclaimed $670 support after breaking out from a long-term falling wedge. The bounce has been strong, and the rising structure now targets the $735–$740 resistance zone. Price action confirms bullish intent with consolidation beneath resistance before breakout.

#BNB AnalysisThis chart is screaming I want to explode. Very low volume spike indicating accumulation at these levels. Especially at close to previous ATH. Price structure has been respected forming higher high and striving to make lowers not diverging from market structure at the price nears discovery area. The RSI sits at a medium range not close to overbought territory. Has developed a respected rectangle pattern with few retests on previous highs. A fib extension gives a return of a minimum $987, and it can break above that with the structure formation we have. It also sits well above the median yearly average. Until the structure changes bearish, I am long on this with risk to reward ratio, being higher on the upside.

Is BNB About to Explode—or About to Collapse?Yello Paradisers! Could this be the beginning of the next BNB rally, or just another classic trap to liquidate early longs before the real move begins? Let’s dive into this high-probability setup before it’s too late.
💎BNBUSDT is currently showing good signs of bullish continuation. The price has successfully broken out of a descending channel and performed a precise retest of that structure—an early confirmation of strength. Following this, we’ve seen a strong reaction from a Fair Value Gap (FVG) and the 200 EMA, both of which align perfectly with the inducement taken just before the bounce. This confluence of technical signals significantly increases the probability of a sustained bullish move in the near term.
💎If price pulls back from current levels, it could offer us a more attractive risk-to-reward opportunity for long entries. Traders who are targeting higher RR ratios, such as 1:2 or beyond, may prefer to wait for a deeper pullback into our predefined support zone for a cleaner entry. This zone remains critical for maintaining our bullish bias.
💎However, if the price breaks down and we see a full candle close below that support zone, the entire bullish scenario becomes invalid. In such a case, it would be more prudent to stay on the sidelines and wait for a clearer and more favorable price action setup to emerge before jumping back in.
We are playing it safe right now. If you want to be consistently profitable, you need to be extremely patient and always wait only for the best, highest probability trading opportunities.
MyCryptoParadise
iFeel the success🌴

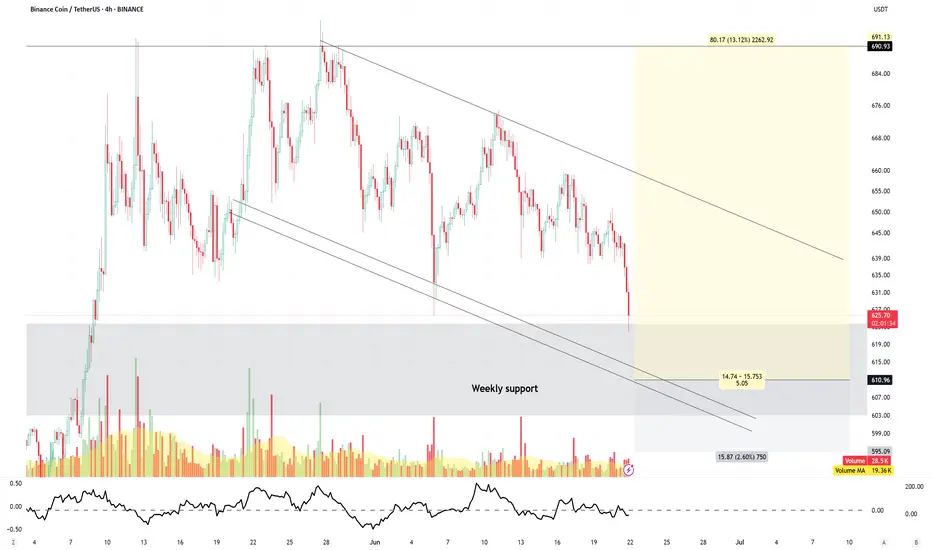
BNB wait for entry
BNB has been consolidating around its current weekly support level for over a year.
Such prolonged consolidation often precedes a significant breakout. Accumulating at this key support zone could present a strong opportunity for long-term positioning.
For short-term trades, it’s best to patiently wait for price to trigger the setup outlined in the chart.
Disclaimer:
This analysis is based on my personnal views and is not a financial advice. Risk is under your control.
DeGRAM | BNBUSD broke the resistance line📊 Technical Analysis
● Breakout: price pierced the purple descending resistance, retested it and the green $641-648 demand cluster, then bounced—confirming the breakout as valid support.
● Rising channel intact; higher-low sequence points to the mid-band confluence at $673. A measured move from the mini flag that is forming inside the channel also projects to $705.
💡 Fundamental Analysis
● Binance’s “Megadrop 2” airdrop locked another 350 k BNB this week while BNB Chain TVL rose 4 %, tightening float and sustaining bid.
✨ Summary
Long $645-655; hold above $641 targets $673 ➜ $705. Invalidate on a 4 h close beneath $604.
-------------------
Share your opinion in the comments and support the idea with a like. Thanks for your support!