BNB Analysis (4H)From the point where we highlighted the red arrow on the chart, the waves of the bullish phase have finished and the bearish phase has begun.
The bearish-phase pattern you see on the chart, which we have labeled, is a symmetrical formation.
The price proportions in this pattern are clearly visible, except for wave A which corresponds to the market crash and if we exclude it, the declines of each wave in this pattern range between 22% and 25%. This time as well, we expect a similar drop for wave I.
It appears that we are currently in wave I of this pattern, and we expect a rejection from the red zone downward so that wave I for Binance Coin can complete.
In the green zone, one can look for buy/long positions.
The closing of a daily candle below the invalidation level will invalidate this analysis.
invalidation level : 640$
For risk management, please don't forget stop loss and capital management
When we reach the first target, save some profit and then change the stop to entry
Comment if you have any questions
Thank You
Market insights

BNB Analysis (12H)As you can see, the Binance Coin structure has turned bearish, but we should not forget that the BNB support zone is not far away.
In the demand zone, we can look for buy/long positions.
The targets are marked on the chart.
A daily candle closing below the invalidation level will invalidate this analysis.
Do not enter the position without capital management and stop setting
Comment if you have any questions
thank you

BNB has cleared an important resistance level (12H)We have a shift in outlook for BNB.
Price has cleared a key supply zone, and now we can look for potential buy/long positions around the demand area.
The targets are marked on the chart.
A daily candle closing below the invalidation level would invalidate this analysis.
Do not enter the position without capital management and stop setting
Comment if you have any questions
thank you

BNBUSDT 1D#BNB has broken above the bullish flag on the daily chart. It may retest the flag before the next leg up. In case of a successful bounce, the potential targets are:
🎯 $1000.52
🎯 $1058.21
🎯 $1115.90
🎯 $1198.03
🎯 $1302.65
⚠️ Always remember to use a tight stop-loss and maintain proper risk management.

BNBUSDTENTRY: 840.40
SL: 847.60
TP:821.41
***Please observe capital management. There is no responsibility for your profits or losses.***

FireHoseReel | BNB Daily Analysis #23🔥 Welcome To FireHoseReel !
Let’s dive into Binance Coin (BNB) analysis.
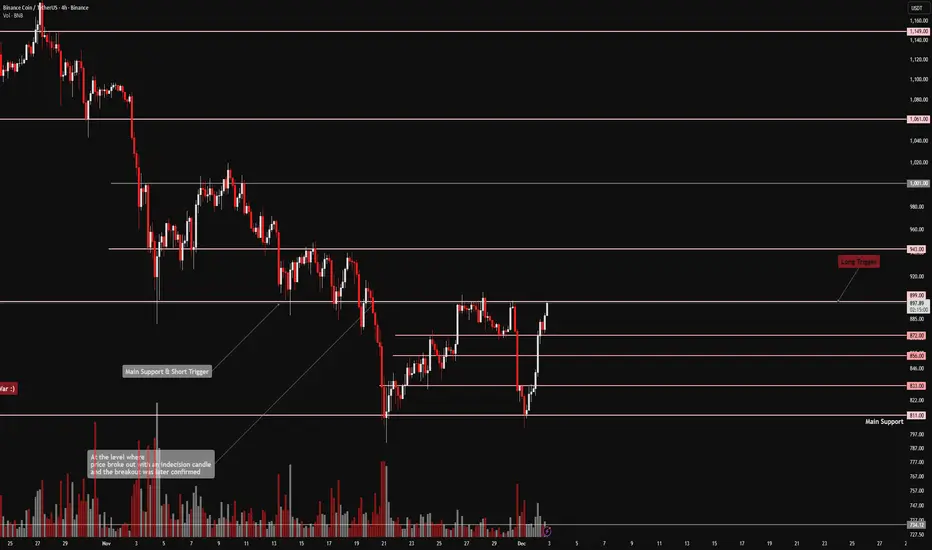
👀 BNB 4H Overview
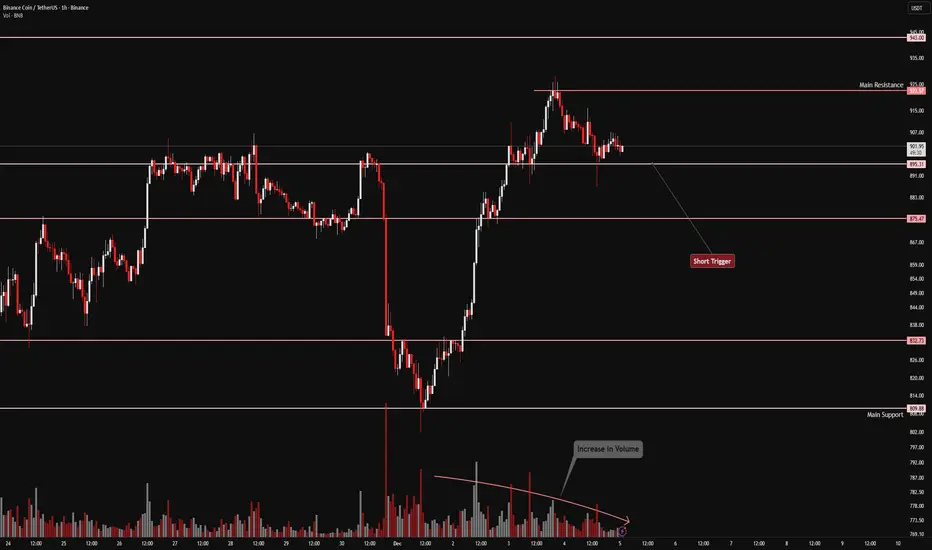
BNB has broken its newly formed support, activating our pre-breakout trigger with a strong 4-hour candle. Price is now moving toward the bottom of the range.
📊 Volume Analysis
After breaking the multi-timeframe support highlighted in the previous analysis, BNB’s volume increased significantly. If selling pressure continues, price could extend its move toward the range low.
✍️ BNB Trading Scenarios
🟢 Long Scenario:
A break above $876, accompanied by rising buying volume, strong momentum, and a fakeout of the current zone, could offer a long opportunity. This setup is high risk, so if taking a long, a maximum risk of 0.25% is recommended.
🔴 Short Scenario:
Waiting for BNB to form a new structure and identify fresh trigger zones would be the more logical approach for short positions. We remain patient until clearer short setups appear.
🧠 Protect your capital first. No setup is worth blowing your account. If risk isn’t controlled, profit means nothing. Trade with rules, not emotions.

FireHoseReel | BNB Daily Analysis #22🔥 Welcome To FireHoseReel !
Let’s dive into BinanceCoin (BNB) analysis.
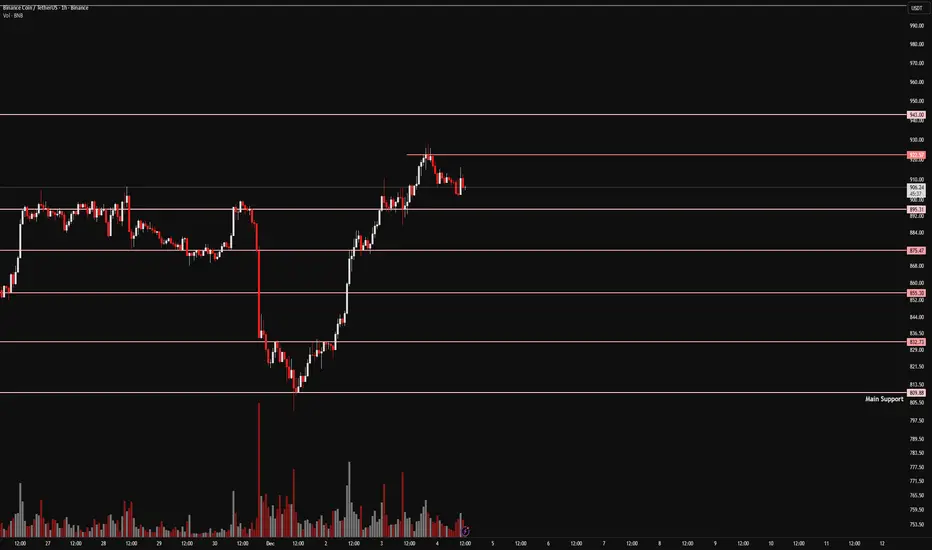
👀 BNB 1D Overview
On the daily timeframe, BNB is forming a trading range of roughly 10%. If this structure continues, it will likely develop into a clear daily box and consolidation zone. The upper boundary of this range is at $923, while the lower boundary is at $823.
📊 Volume Analysis
After printing an ATH at $1,376, BNB’s volume dropped sharply. With volume currently compressed, the next expansion in volume could trigger a move larger than expected.
✍️ BNB Trading Scenarios
🟢 Long Scenario 1:
A break above $923, which marks the top of the trading range, accompanied by strong buying volume confirmation, could provide a solid long setup on BNB.
🔴 Short Scenario:
A break below $823, the bottom of the trading range, confirmed by increasing selling volume, could offer a valid short opportunity on BNB.
🧠 Protect your capital first. No setup is worth blowing your account. If risk isn’t controlled, profit means nothing. Trade with rules, not emotions.

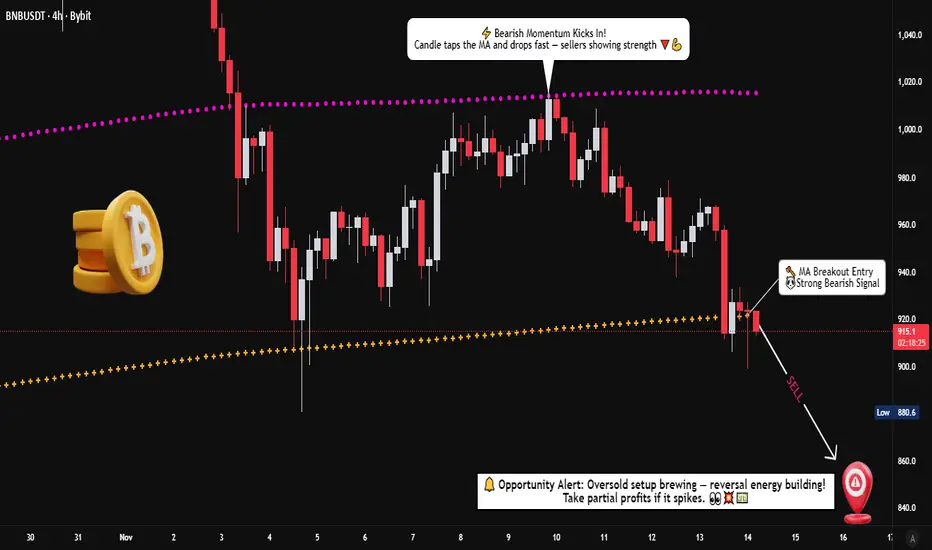
BNB/USDT – Momentum Shift Indicates Controlled Bearish Pressure📊 BNB/USDT: CRYPTO MARKET OPPORTUNITY BLUEPRINT | Swing Trade Analysis
🎯 TRADE SETUP OVERVIEW
Asset: BNB/USDT (Binance Coin vs Tether)
Timeframe: Swing Trade
Bias: 🔴 BEARISH | Confirmed via Weighted Moving Average Dynamic Support Breakout
📍 ENTRY STRATEGY: LAYERING METHOD
Entry Approach: Multiple Limit Order Layering (Dollar-Cost Average Entry Style)
Layer 1: $960.0 (Initial Entry)
Layer 2: $940.0 (Add Position)
Layer 3: $920.0 (Scale Entry)
💡 Customize layer levels based on your risk tolerance & capital allocation
🛑 STOP LOSS (SL)
Thief OG's SL Level: 🎪 $970.0
⚠️ CRITICAL: Place SL only after breakout confirmation is validated on price action
📌 Disclaimer: Adjust SL based on your personal strategy & risk management rules. This is YOUR capital at risk.
🎁 PROFIT TARGET (TP)
Target Level: 🏁 $850.0
Why This Level?
✅ Moving Average acts as strong resistance zone
✅ Overbought conditions present
✅ Previous support-turned-resistance trap identified
✅ Optimal risk-to-reward structure
📌 Disclaimer: This is a reference target. Take profits at YOUR discretion. Partial profit-taking recommended.
🔗 CORRELATED PAIRS TO MONITOR
Direct Correlations (High Impact)
1. ETH/USDT (Ethereum) - 📈 POSITIVE CORRELATION
Why Watch: BTC & ETH dominance typically drives altcoin movement
Key Point: If ETH breaks down, BNB often follows within 2-4 hours
Action: Use as confirmation signal for BNB downtrend continuation
2. BTC/USDT (Bitcoin) - 📈 POSITIVE CORRELATION
Why Watch: Bitcoin is the market leader; BNB is highly correlated
Key Point: Major Bitcoin support/resistance breaks precede BNB moves
Action: Monitor BTC for early trend reversal signals
3. BNB/BTC (Binance Coin vs Bitcoin) - 🔄 RELATIVE STRENGTH
Why Watch: Shows BNB's strength independently from Bitcoin
Key Point: If BNB/BTC weakens while BTC holds, downtrend is stronger
Action: Confirmation of bearish bias strength
Secondary Watch Pairs (Market Context)
4. USDT Dominance - 💰 INVERSE CORRELATION
Key Point: Rising USDT dominance = increased selling pressure on alts
Action: Check Tether flows into/out of BNB pairs
5. Crypto Fear & Greed Index - 📊 SENTIMENT INDICATOR
Why Watch: Extreme readings often precede reversals
Key Point: Greedy sentiment before drops = trap setup (like here)
Action: Validate bearish thesis with sentiment extremes
⚡ RISK MANAGEMENT CHECKLIST
✅ Breakout confirmation required before entry
✅ Risk:Reward ratio minimum 1:2 for this setup
✅ Position size = (Account Risk % × Capital) ÷ (Entry - SL)
✅ Scale entries across 3 layers to reduce slippage
✅ Monitor correlations for early exit signals
✅ Take profits in tiers: 33% at 900.0 | 33% at 875.0 | 34% at 850.0
📊 Summary
BNB has shifted into a bearish structure after losing dynamic support. With a layered entry method, flexible SL/TP management, and clear correlation signals across major crypto assets, this setup provides a properly structured swing opportunity for disciplined traders.
BNB/USDT Setup – Will the Moving Average Confirm the Bull Move?💎 BNB/USDT – "BINANCE COIN VS TETHER" 💰
Crypto Market Opportunity Blueprint (Swing Trade)
📈 Plan: BULLISH
After a period of compression within a triangular structure, BNB is preparing for a potential breakout. The breakout above the triangular moving average could trigger a new bullish wave — offering a solid opportunity for swing traders!
💥 Entry:
✅ Any price level after confirmed breakout above the triangular moving average.
Patience = profits. Wait for confirmation to avoid fake moves.
🛑 Stop Loss:
This is the “Thief SL” @ 920.0 💀
⚠️ Note: Dear Ladies & Gentlemen (Thief OG’s) — adjust SL based on your strategy & risk appetite. Place it only after breakout confirmation, not before!
🎯 Target:
The moving average acts as a strong resistance zone, combined with overbought signals and potential trap activity.
Our target: @ 1120.0 💰
💬 Take profits smartly — your capital, your rules.
🧭 Related Pairs to Watch (Correlation Insight)
🔹 BINANCE:BTCUSDT – Bitcoin’s momentum drives most altcoin sentiment. A BTC breakout usually strengthens BNB bullish continuation.
🔹 BINANCE:ETHUSDT – Ethereum & Binance Coin often move in tandem within similar risk cycles; ETH strength confirms market-wide bullish tone.
🔹 BINANCE:SOLUSDT – Competes in smart-contract dominance; if SOL rallies, BNB tends to mirror short-term volatility shifts.
🔹 BINANCE:BNBBTC – Tracks BNB’s relative strength against BTC. Watch for BNB outperforming BTC — a hidden signal of accumulation by whales.
⚡ Key Points
Volume confirmation is crucial ⚙️
Wait for candle close above MA 🕒
Manage risk; don’t blindly copy setups 🚫
Follow the trend, not emotions 💭
🧠 Final Note:
This is not financial advice. Trade wisely, respect your plan, and remember — smart exits matter more than perfect entries.
🚀 Stay patient, stay sharp — Thief OG’s never chase, they calculate.

FireHoseReel | BNB Daily Analysis #19🔥 Welcome To FireHoseReel !
Let’s dive into BinanceCoin (BNB) analysis.
👀 BNB 4H Overview
BNB is currently trading inside a large 4H range box. A breakout from this box could trigger a major move.
The $922 level stands as both the top of the range and the 38% Fibonacci retracement of the previous bearish leg.
On the downside, $881 is acting as a freshly formed support zone.
📊 Volume Analysis
Volume slightly increased during the attempt to break $922, but buyers lacked enough strength and selling pressure followed.
A strong and sustained increase in volume will significantly raise the probability of a valid breakout.
✍️ BNB Trading Scenarios
🟢 Long Scenario 1:
A confirmed breakout above $922 creates a solid long opportunity.
Entry confirmation should come from a stable increase in buying volume.
🟢 Long Scenario 2:
You may enter on the 4th test using a stop-buy order with a wider stop, targeting around RR = 2.
⚠️ This type of entry should be executed with maximum 0.5% risk per trade to avoid heavy losses.
🔴 Short Scenario:
Since the broader structure behind price is strongly bearish, and the market previously experienced an aggressive drop from a distribution zone,
a break below the newly formed $881 support can activate a short position, confirmed by rising sell volume.
🧠 Protect your capital first. No setup is worth blowing your account. If risk isn’t controlled, profit means nothing. Trade with rules, not emotions.

FireHoseReel | BNB Daily Analysis #19🔥 Welcome To FireHoseReel !
Let’s dive into BinanceCoin (BNB) analysis.
👀 BNB 1H Overview
BNB reacted to its resistance yesterday and activated its long trigger. It is now still struggling with the same resistance zone, while we have slightly moved the resistance higher for the new trigger.
📊 Volume Analysis
BNB volume has formed a divergence with price. A clear resistance breakout requires rising buy volume for confirmation. Keep in mind that all valid breakouts need volume convergence—otherwise, a fakeout is very likely.
✍️ BNB Trading Scenarios
🟢 Long Scenario:
A breakout above the current resistance at $904, supported by increasing buy volume, could open a valid long setup.
🔴 Short Scenario:
A breakdown below the maker-buyer low at $877, confirmed with strong selling pressure on the 1H timeframe, could activate a short setup.
🧠 Protect your capital first. No setup is worth blowing your account. If risk isn’t controlled, profit means nothing. Trade with rules, not emotions.

FireHoseReel | BNB Daily Analysis #18🔥 Welcome To FireHoseReel !
Let’s dive into BinanceCoin (BNB) analysis.
👀 BNB 1H Overview
BNB is still holding the same position as yesterday, and due to the holiday period, the market hasn’t shown major changes. I’ve only adjusted the newly formed resistance slightly and moved it to $898.22.
📊 Volume Analysis
BNB volume was very low yesterday, but today it’s showing a moderate increase. Sundays usually bring more activity than Saturdays, so with rising volume, any trigger activation could lead to a faster move.
✍️ BNB Trading Scenarios
🟢 Long Scenario:
A breakout above the newly formed resistance at $898.22, supported by rising buy volume, could act as a risky long trigger. The next key long level lies around $922.57.
🔴 Short Scenario:
A 15-minute base has formed in this zone, which may offer a quick entry with a tight stop. The main short trigger is at $877.33—a confirmed break with volume could validate a short entry.
🧠 Protect your capital first. No setup is worth blowing your account. If risk isn’t controlled, profit means nothing. Trade with rules, not emotions.

FireHoseReel | BNB Daily Analysis #16🔥 Welcome To FireHoseReel !
Let’s dive into BinanceCoin (BNB) analysis.
👀 BNB 1H Overview
BNB is currently hovering near a key support zone. A breakdown below this level could trigger a deeper correction toward lower prices.
📊 Volume Analysis
Trading volume has dropped sharply at this corrective level. A new surge in either buy or sell volume could ignite a strong momentum move.
✍️ BNB Trading Scenarios
🟢 Long Scenario:
A breakout above $922.57 with rising buy volume could offer a solid long opportunity.
🔴 Short Scenario:
A breakdown below the current support at $895, accompanied by strong selling pressure, could trigger a valid short setup.
🧠 Protect your capital first. No setup is worth blowing your account. If risk isn’t controlled, profit means nothing. Trade with rules, not emotions.
FireHoseReel | BNB Daily Analysis #15🔥 Welcome to FireHoseReel!
Let’s dive into the Binance Coin (BNB) analysis.
👀 BNB – 1H Overview
BNB has successfully activated its long trigger and is now moving higher.
At the moment, BNB is forming a higher low compared to the previous bottom, which strengthens the bullish structure and keeps the upside continuation in play.
📊 Volume Analysis
After the long trigger was activated, BNB volume increased strongly, supporting the upward move.
If buying pressure remains sustained, BNB can continue its rally toward the next key resistance zone.
✍️ BNB Trading Scenarios
🟢 Long Scenario
The main long trigger is already active.
However, the risk-on long trigger will activate with a break above the current high, offering a more aggressive continuation setup.
🔴 Short Scenario
If BNB forms a lower high and a lower low below the $895 level, strong selling pressure could emerge.
That said, on the 4H timeframe, there is still a high probability that this short scenario may fail.
DeGRAM | BNBUSD soon bounced back from $900📊 Technical Analysis
● BNB continues to trade inside a well-defined rising channel after rebounding from the 874 support zone, with higher lows confirming strengthening bullish structure.
● A breakout above 899 turned into support, and price now targets the mid-channel resistance near 939, with potential extension toward 1,004 if momentum holds.
💡 Fundamental Analysis
● BNB sentiment improves as broader crypto inflows rise and market risk appetite strengthens following softer U.S. data.
✨ Summary
● Bullish above 899. Targets: 939 → 1,004. Support: 874 / 899.
-------------------
Share your opinion in the comments and support the idea with a like. Thanks for your support!

$BNB/USDT ANALYSISBNB/USDT on the 4-hour chart has successfully broken out of the descending channel that has been controlling its movement since October. After the breakout, the price managed to retest the upper boundary of the channel and is now holding above both the EMA line and the Ichimoku cloud, showing that short-term momentum has shifted from bearish to bullish. The strong bullish candle that pushed price out of the channel confirms a breakout with volume support, suggesting buyers are gaining control.
If BNB holds above the $890–$900 range, this breakout could extend toward the next resistance zone around $1,040–$1,100, and possibly reach the higher target near $1,180–$1,200. The stop-loss region near $849 remains a safe invalidation level below the retest zone. Overall, BNB is showing a potential trend reversal from the downtrend into a bullish phase, and as long as it maintains support above the breakout zone, upside continuation toward $1,200 remains likely.

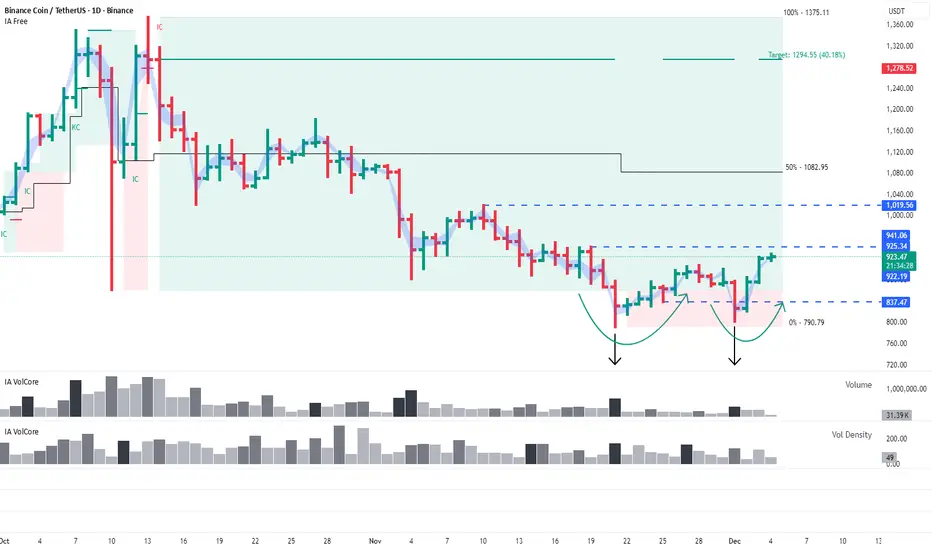
BNB: Buyers defend the lower boundary of the range againThis analysis is based on the Initiative Analysis (IA) method.
Hello traders and investors!
A reminder: the daily timeframe is still in a sideways range.
At its lower boundary, another false-break pattern has formed — this time at the 837 level: a seller’s attack on high volume followed by a confident absorption by buyers.
The nearest targets remain the same: 941 and 1019.
Wishing you profitable trades!
$BNB BreakoutSeeing a breakout of this zone upside before retracement to the mid point of the zone and then turning bullish again.
Bullish January expected.

FireHoseReel | BNB Daily Analysis #14🔥 Welcome to FireHoseReel!
Let’s dive into the Binance Coin (BNB) analysis.
👀 BNB – 4H Overview
BNB is currently trading just below its major resistance at $900, a level that holds both strong psychological and technical importance.
A clean break above this zone could activate our primary long trigger.
📊 Volume Analysis
During the recent market crash, BNB faced heavy selling pressure, followed by strong buyer absorption, which allowed price to recover with rising buy volume.
If this buy-side momentum remains sustained, BNB will have a strong chance to break above the $900 resistance.
✍️ BNB Trading Scenarios
Here are the active scenarios you can use alongside your own trading strategy:
🟢 Long Scenario (Breakout Setup)
A confirmed breakout above $900, supported by a clear increase in buy volume, can provide a solid long entry opportunity.
🟢 Long Scenario (Low-Risk, Fast R:R Setup)
For traders seeking tight stops and quick risk-to-reward, wait for price to consolidate, then enter during the pullback with decreasing volume, followed by the first signs of volume expansion.
🔴 Short Scenario
A breakdown below $872, followed by the formation of a lower high, could create a multi-timeframe bearish structure. A confirmed structure break on that pattern may open a short setup.
❤️ Risk Management & Emotional Discipline
Crypto trading is highly risky. Without proper risk management and emotional control, trading is no different from gambling.
Logic must always come before emotions. Learn to manage your trades, and enjoy the process of trading with control and discipline.
BNB Bulls Near Breakout: Reversal Pattern Emerges
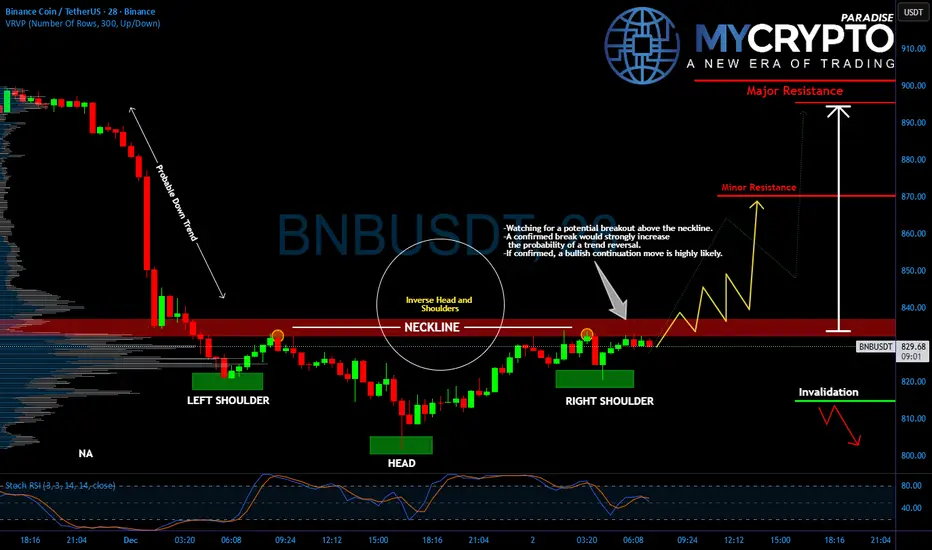
Yello, Paradisers, is this the turning point for BNB? After the recent brutal drop, signs of a powerful reversal are emerging, and what we’re seeing now could trap late sellers in a dangerous spot.
💎#BNBUSDT has formed a textbook inverse head and shoulders pattern, signaling a potential bullish reversal after a steep downtrend. The neckline around the $834–$836 level has become a critical zone to watch. Price is currently testing this area, and a confirmed breakout above it could trigger a strong continuation move.
💎This structure forms after a sharp downtrend and often acts as a springboard for upside momentum when confirmed. If #BNB manages to break and hold above the neckline with volume, the next target lies near $870, minor resistance, with the $890–$900 zone acting as major resistance.
💎However, if bulls fail to break out and the price gets rejected from the neckline again, we could see a retracement back toward the $810 invalidation level, which would weaken the reversal setup and put short-term downside back in play.
💎The Stochastic RSI is also approaching overbought territory, suggesting bulls need to act quickly before momentum fades. Volume confirmation remains key here.
Stay sharp, the setup is clean, but it’s also a classic trap zone.
MyCryptoParadise
iFeel the success🌴
BNB Market Structure ReviewBNB is moving within global patterns, an ascending expanding wedge within which a bullish flag has formed.
Five liquidity zones have formed above.
Below, two liquidity zones have formed, the first from January 2025 and the second from February 2024.
Given the Fed's rate tightening plan, the movement is more likely to be upward. Globally, it could reach the previous ATH or even the upper boundary of the wedge.
Also, on the longs and shorts map, it appears that longs are currently in excess.
The liquidity map shows that the enormous liquidity is forming at the top, not the bottom.
According to the media, the indicator is positive, in response to CZ's comment regarding the Fed.
Also, given that BTC is being prevented from breaking the lower boundary of the pattern we discussed in our previous review, BNB's movement against BTC is more likely to be upward along the designated liquidity zones.
If the lower boundary of the pattern is broken, and the candlestick forms deeper than the previous candlestick, the movement is more likely to be upward. downward, with a false breakout to the liquidity area highlighted in red

FireHoseReel | BNB Daily Analysis #13🔥 Welcome to FireHoseReel !
Let’s dive into the Binance Coin ( BNB ) analysis.
👀 BNB – 1H Overview
After the recent decline, BNB has entered a new short-term structure and is now moving toward the $871 resistance with strong momentum and rising volume.
One or two clear reactions to this resistance, followed by a confirmed breakout, could activate our long trigger.
📊 Volume Analysis
Volume is the key factor to monitor here. During BNB’s corrective move after the bearish leg, buy volume was decreasing.
However, once the multi-timeframe resistance at $833 broke, buy volume expanded sharply, marking a sentiment shift that traders needed to react to.
✍️ BNB Trading Scenarios
Below are the active scenarios you can use alongside your own trading strategy:
🟢 Long Scenario
A break above $871 with rising buy volume can activate a long setup.
The second touch and breakout usually offers a better risk-to-reward with a tighter stop.
🔴 Short Scenario
The formation of bearish patterns such as failure swing, non-failure swing, or double top, confirmed by volume, can provide a valid short setup.
❤️ Risk Management & Emotional Discipline
Crypto trading is highly risky. Without proper risk management and emotional control, trading is no different from gambling.
Logic must always come before emotions. Learn to manage your trades—and enjoy the process with control and discipline.

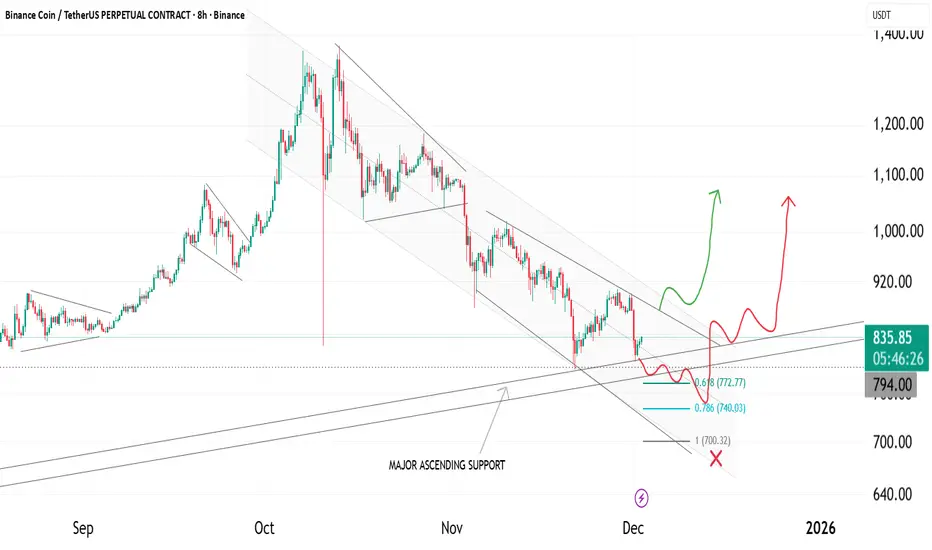
BNB at Make-or-Break Support– Final Sweep or Major Reversal ZoneBNB is approaching a very important area where two major structures meet: the descending channel and the long-term ascending support. This region has historically triggered strong reactions, and price is now retesting it again.
The recent drop pushed BNB directly into the confluence of
• 0.618 fib (772)
• 0.786 fib (740)
• major ascending support
• the bottom of the falling channel
This combination forms a high-value reaction zone where volatility usually expands.
If price holds this zone and reclaims the smaller descending trendline, the market can begin the next corrective leg to the upside. However, failure to hold this support may trigger a deeper sweep before any recovery attempt.
Key Structure Notes
• BNB is trading inside a falling channel
• Price is sitting at a multi-month ascending support
• Fib confluence strengthens the potential for a rebound
• A clean reclaim of the inner trendline would confirm strength
• A breakdown below 740 would invalidate this scenario
Invalidation
A confirmed close below 740 invalidates the bullish recovery idea and opens the door for a deeper move toward 700.
Simple Explanation
BNB is sitting at a major support cluster. If this area holds and the trendline is reclaimed, upside continuation can follow. If it breaks, expect another sweep lower before any meaningful bounce.