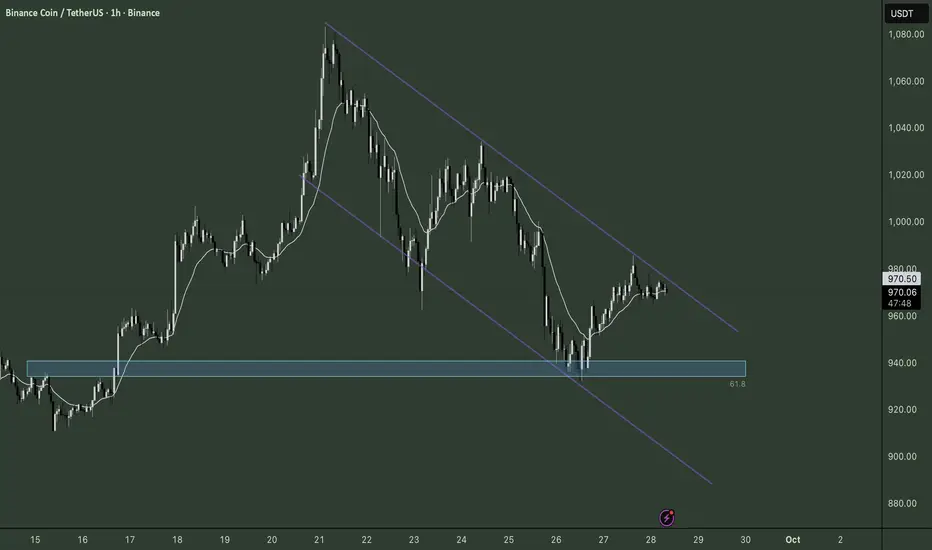
BNB – Loading Up Energy Inside the Wedge📊 Current Setup
BNB’s been surfin’ inside a falling wedge ⬇️, testing the waters 🌊. Last dip tagged the 61.8 fib zone (~$940) 🎯 and bounced, showing bulls 🐂 still flexin’. But right now the bullish push is runnin’ low on juice ⚡ — momentum looks weak, and lower TFs ⏱️ are flashin’ bearish reversal vibes 😈.
🚦 Scenarios
👉 Likely dip back toward the $940–950 support beach 🏝️ before any real bull run 🏇 takes off.
👉 If that zone holds, we could see BNB blast out of the wedge 💥 and ride a fresh wave higher 🌊🚀.
👉 If it cracks, the $900 safety net 🛑 comes into play — but structure suggests that breakdown is less likely.
🧭 My Take
Short-term dip risk 📉, but the long-term wave’s still brewin’ 📈. Best move is to stay patient, protect your board, and ride the bigger set when it rolls in 🤙🌴.
💬 What do you think about this scenario? Only share your idea if you’ve got another opinion — otherwise just hit that button 👍
BNBUSDT.5S trade ideas
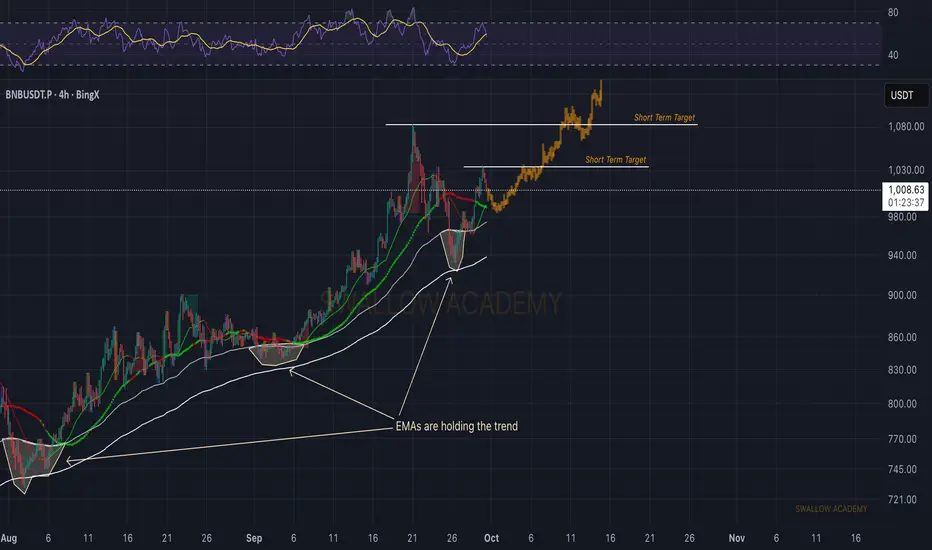
Binance Coin (BNB): Respecting the EMAs | Bullish AFBNB continues to respect the EMAs, with each dip finding strong support and buyers stepping in to hold the trend.
The bounce from the latest retest shows momentum is still in buyers’ favor, and as long as this structure is protected, short-term targets are around $1,030 and $1,080 (as long as buyers maintain the EMAs).
Swallow Academy
Long trade
📌 Trade Journal Entry – BNBUSDT
Trade Type: Buyside
Date/Time: Friday, 26th Sept 2025 – 11:00 AM
Session: London to New York Session AM
Pair: BNBUSDT Perpetual (1H timeframe)
🔑 Trade Details
Entry: 1,042.02
Profit Level (TP): 1,082.87 (+14.93%)
Stop Level (SL): 1,035.16 (-0.75%)
Risk–Reward Ratio (RR): 19.92
📊 Technical Structure
Range Sweep: Price cleared the range low at 942.23, triggering liquidity
Origin & Base Line: Demand confirmed at the sweep origin, providing a strong confluence.
Break of Structure (BOS): Bullish intent confirmed post-sweep with higher highs forming.
Fair Value Gaps (FVGs): Multiple unfilled bullish FVGs supported displacement and continuation.
EMA/WMA Alignment: Momentum confirmed with EMA trending above WMA.
🏦 Narrative
This setup is a Wyckoff spring into bullish expansion:
Market swept the range liquidity at 942.23.
Aggressive buy-side pressure created immediate displacement, and BOS aligned with the previous Asian high & low range, demand zone conviction, and an entry placed at 1,042.02 just above the validation zone. Expansion target 1,082.87 liquidity pool.
⚡ Summary
BNB’s move reflects a classic liquidity sweep → accumulation → expansion cycle.
The confluence of structural confirmation and demand validation.

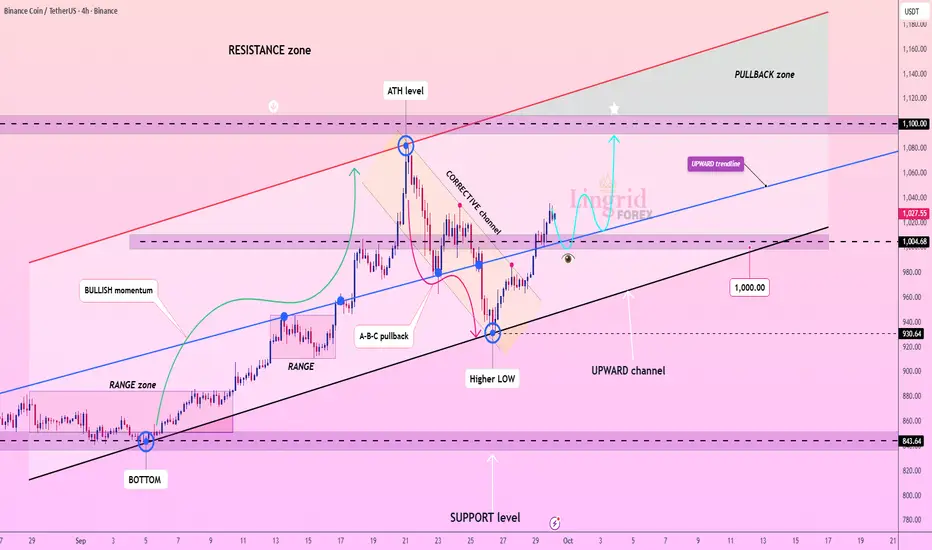
Lingrid | BNBUSDT Targeting ATH Level After PullbackThe price perfectly fulfilled my previous idea . BINANCE:BNBUSDT is trading inside an upward channel after a corrective pullback from the ATH level near 1,080. Price action shows a rebound from a higher low around 1,000, confirming structural support. If buyers defend the 1,000–1,010 zone, momentum could extend toward the pullback area at 1,100+. Broader context supports bullish continuation as long as the channel trendline holds.
⚠️ Risks:
Failure to maintain above 1,000 could invite deeper correction toward 930 support.
Strong USD strength or negative market sentiment may weigh on upside.
Macro-driven volatility around regulatory or Binance-related news could trigger sharp moves
If this idea resonates with you or you have your own opinion, traders, hit the comments. I’m excited to read your thoughts!
Binance Coin (BNB): Similar Pattern Forming / Liquidity HuntingBNB coin has pretty similar price ation compared to Novemenr 2024 bullish buildup we had. Lately price has been rather trading in a sideways chanel with quite some liqudiity huntings on the way as well.
What we are expecting currently is a further buyside dominance which would lead the price to local high area, from where we might be seeing some strong downard movement and from wher ewe will be trying to catch a short position as well.
P.S. not our favourite coin to trade but scalping is pretty decent on this one tbh.
Swallow Academy

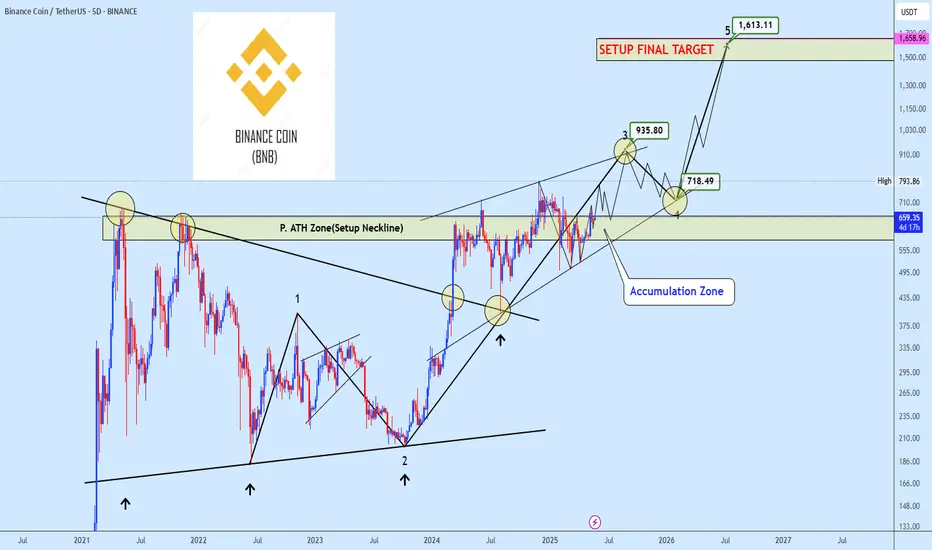
BNBUSDT preparing for major upside RallyBNBUSDT has broken out of a major bullish structure and has since transitioned into a well defined ascending wedge, suggesting the development of an extended Wave 3 within an impulsive Elliott sequence.
Price is currently progressing toward the projected Wave 3 target around $935, a level that also coincides with a significant historical supply zone. Once reached, this area may trigger a sharp corrective pullback, likely forming Wave 4.
Should this correction hold above key structural support, the final impulsive leg toward the $1,613 region is expected to complete the ongoing trading cycle for BNB.
We invite you to share your perspective in the comments and revisit our earlier BNB analysis linked below for broader context on this setup.
BNB needs to restThe higher the BNB rises without consolidation, the sharper the correction risk becomes. The correction is coming, and this is the target:
www.cointrust.com
BNB Swing Long Idea - TTKZ Model📊 Market Sentiment
FED has resumed its rate-cutting cycle, starting with a 0.25% cut in September, with two more 0.25% cuts expected in the coming months. Additionally, institutional liquidity inflows have accelerated as the U.S. officially adopts crypto as part of its reserves. While inflation remains elevated, the weakening labor market is forcing the FED to ease, driving more capital into risk-on assets.
📈 Technical Analysis
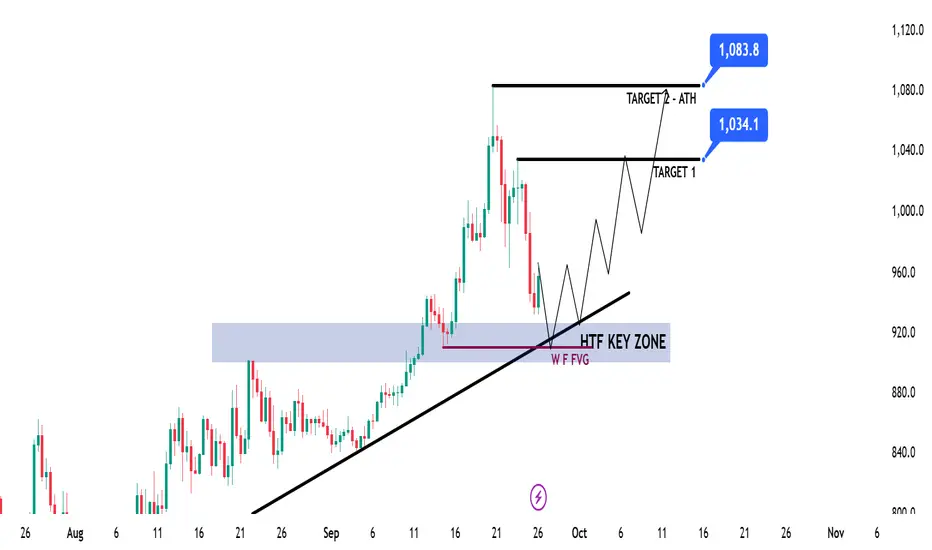
Price is making new all-time highs continuously. The HTF Weekly–Daily structure remains bullish, so my bias is only long.
Currently, price is retracing toward the HTF bullish trendline and a HTF Key Zone, both of which I assume are strong levels for a potential bounce and continuation higher.
📘 Model to be used – Trendline Test w HTF Key Zone (TTKZ)
In this model, I look for a clear HTF trendline that continuously supports price. When price comes back to test that line, I check if there’s also a HTF Key Zone aligned for confluence. Strong overlapping zones create higher probability bounce areas for long setups.
📌 Game Plan
1-Wait for a test of the HTF trendline
2-Confirm test of the HTF Key Zone
🎯 Setup Trigger
I will be waiting for a 4H break of structure before entering the trade.
📋 Trade Management
Stoploss: Below the 4H swing low that creates the break of structure
Targets: TP1: 1034$ | TP2: 1083$
Once TP1 is reached, stoploss will be moved to breakeven.
💬 Like, follow, and comment if this breakdown supports your trading! More setups and market insights coming soon — stay connected!
⚠️ Disclaimer: This content is for informational and educational purposes only and does not constitute financial, investment, or trading advice. Always DYOR before making any financial decisions.
Binance Coin Positioned For 16% Upside Toward $1,280 TargetHello✌️
Let’s analyze Binance Coin’s price action both technically and fundamentally 📈.
🔍Fundamental analysis:
BNB burns have cut supply ~30% since 2017, while big holders like BNB Network Company push demand. Less supply and concentrated buying could boost price, as past burns often led to big rallies.
📊Technical analysis:
BINANCE:BNBUSDT has precisely reached its previous target and is trading within a rising channel, now approaching the upper boundary; a breakout could trigger a 16% rally toward $1,280.
📈Using My Analysis to Open Your Position:
You can use my fundamental and technical insights along with the chart. The red and green arrows on the left help you set entry, take-profit, and stop-loss levels, serving as clear signals for your trades.⚡️ Also, please review the TradingView disclaimer carefully.🛡
✨We put love into every post!
Your support inspires us 💛 Drop a comment we’d love to hear from you! Thanks, Mad Whale

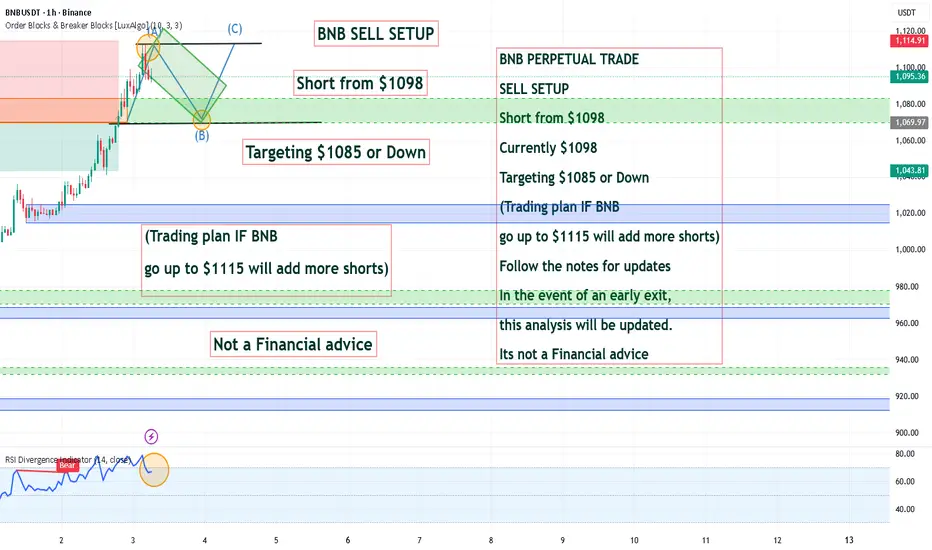
BNB PERPETUAL TRADE SELL SETUP Short from $1098BNB PERPETUAL TRADE
SELL SETUP
Short from $1098
Currently $1098
Targeting $1085 or Down
(Trading plan IF BNB
go up to $1115 will add more shorts)
Follow the notes for updates
In the event of an early exit,
this analysis will be updated.
Its not a Financial advice
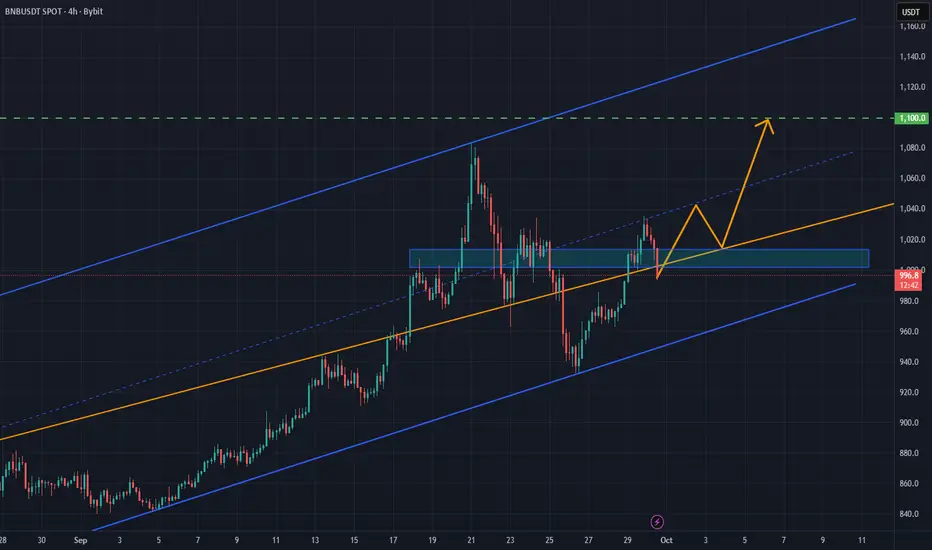
BNB/USDT: Bullish Structure Intact Above Key Support ZoneBNB/USDT is trading within a well-defined upward channel following a corrective pullback from its all-time high near 1,080. The recent rebound from a higher low around 1,000 confirms the presence of structural support and sustained bullish momentum.
If buyers continue to defend the 1,000–1,010 zone, price could push toward the 1,100+ pullback area. As long as the channel trendline remains intact, the broader outlook supports a bullish continuation toward higher levels.
BNBUSDT 4H#BNB has formed a falling wedge pattern on the 4-hour timeframe chart. In case of a breakout above it, the potential targets are:
🎯 $993
🎯 $1012
🎯 $1035
🎯 $1073
Support Levels:
🛡 $947
🛡 $923
⚠️ Always remember to use a tight stop-loss and follow proper risk management.

BNB Eyes 9% Upside, Targeting 1110 USD Next RallyHello✌️
Let’s analyze BNB’s price action both technically and fundamentally 📈.
🔍Fundamental analysis:
BNB keeps shrinking supply with its auto-burn, while daily activity and DeFi use stay strong. If demand holds, it’s bullish long-term but slower adoption could cut the effect.
📊Technical analysis:
BNB is trading within a strong ascending channel, hitting new all-time highs with robust volume 🚀. Holding this zone could support at least a 9% upside, targeting 1110 USD 📈.
📈Using My Analysis to Open Your Position:
You can use my fundamental and technical insights along with the chart. The red and green arrows on the left help you set entry, take-profit, and stop-loss levels, serving as clear signals for your trades.⚡️ Also, please review the TradingView disclaimer carefully.🛡
✨We put love into every post!
Your support inspires us 💛 Drop a comment we’d love to hear from you! Thanks, Mad Whale

BNBUSDT | Red Box as Potential Hedge ZoneOn BNB, I’m watching the red box resistance carefully. If price reaches that area and CDV gives the kind of signal I’m expecting, I’ll treat it as an opportunity.
Not to flip my long-term view, but to hedge existing long positions with a tactical short. That way, I protect gains while still leaving room in case the broader move continues.
This isn’t a blind short. I’ll only act if CDV divergence and footprint confirm selling pressure at the red box. Without those signs, I let it go.
I keep my charts clean and simple because I believe clarity leads to better decisions.
My approach is built on years of experience and a solid track record. I don’t claim to know it all, but I’m confident in my ability to spot high-probability setups.
If you would like to learn how to use the heatmap, cumulative volume delta and volume footprint techniques that I use below to determine very accurate demand regions, you can send me a private message. I help anyone who wants it completely free of charge.
I have a long list of my proven technique below:
🎯 ZENUSDT.P: Patience & Profitability | %230 Reaction from the Sniper Entry
🐶 DOGEUSDT.P: Next Move
🎨 RENDERUSDT.P: Opportunity of the Month
💎 ETHUSDT.P: Where to Retrace
🟢 BNBUSDT.P: Potential Surge
📊 BTC Dominance: Reaction Zone
🌊 WAVESUSDT.P: Demand Zone Potential
🟣 UNIUSDT.P: Long-Term Trade
🔵 XRPUSDT.P: Entry Zones
🔗 LINKUSDT.P: Follow The River
📈 BTCUSDT.P: Two Key Demand Zones
🟩 POLUSDT: Bullish Momentum
🌟 PENDLEUSDT.P: Where Opportunity Meets Precision
🔥 BTCUSDT.P: Liquidation of Highly Leveraged Longs
🌊 SOLUSDT.P: SOL's Dip - Your Opportunity
🐸 1000PEPEUSDT.P: Prime Bounce Zone Unlocked
🚀 ETHUSDT.P: Set to Explode - Don't Miss This Game Changer
🤖 IQUSDT: Smart Plan
⚡️ PONDUSDT: A Trade Not Taken Is Better Than a Losing One
💼 STMXUSDT: 2 Buying Areas
🐢 TURBOUSDT: Buy Zones and Buyer Presence
🌍 ICPUSDT.P: Massive Upside Potential | Check the Trade Update For Seeing Results
🟠 IDEXUSDT: Spot Buy Area | %26 Profit if You Trade with MSB
📌 USUALUSDT: Buyers Are Active + %70 Profit in Total
🌟 FORTHUSDT: Sniper Entry +%26 Reaction
🐳 QKCUSDT: Sniper Entry +%57 Reaction
📊 BTC.D: Retest of Key Area Highly Likely
📉 TIAUSDT
: Still No Buyers, Bearish Outlook
🎭 BELUSDT
: Manipulation Masterclass – Buyers in Control
📈 OGNUSDT: One of Today’s Top Volume Gainers +32.44%
🛑 GMTUSDT: Resistance & Strategy
⚠️ TRXUSDT: 150% Daily Volume Spike – No Buyers Yet
🔄 AAVEUSDT: Retracement Opportunity

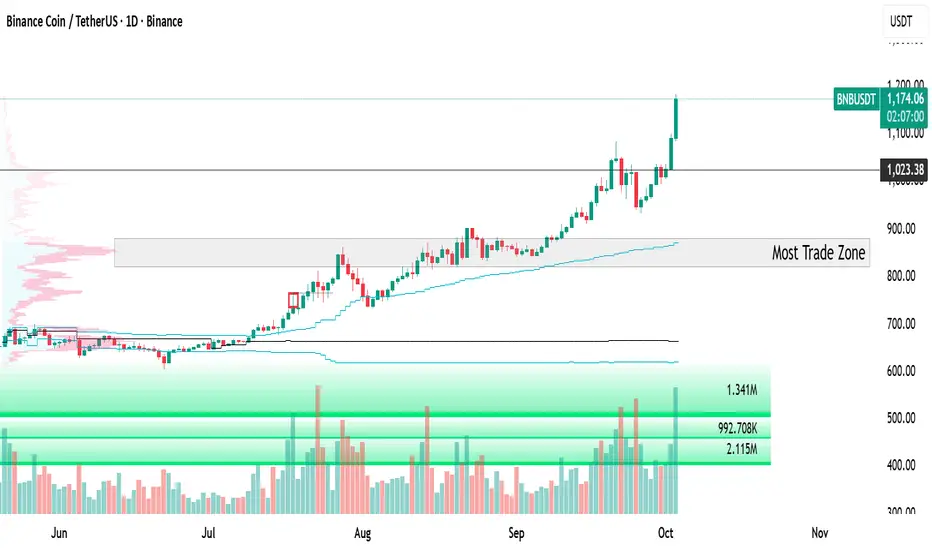
Resistance Zone: 977.90-1047.80
Hello, fellow traders!
Follow us to get the latest information quickly.
Have a great day!
-------------------------------------
(BNBUSDT 1M Chart)
We achieved our target by touching the Fibonacci level of 1.618 (1057.16).
We need to see if the price can rise towards Fibonacci ratio 2 (1259.05).
-
(1D chart)
The HA-High ~ DOM (60) range has formed at 977.90-1047.80.
Therefore, the 977.90-1047.80 range could act as resistance.
If it falls below 977.90, it could encounter the M-Signal indicator on the 1M chart.
Before that, we need to see if the price rises along the uptrend line (1).
-
Thank you for reading to the end.
I wish you successful trading.
--------------------------------------------------

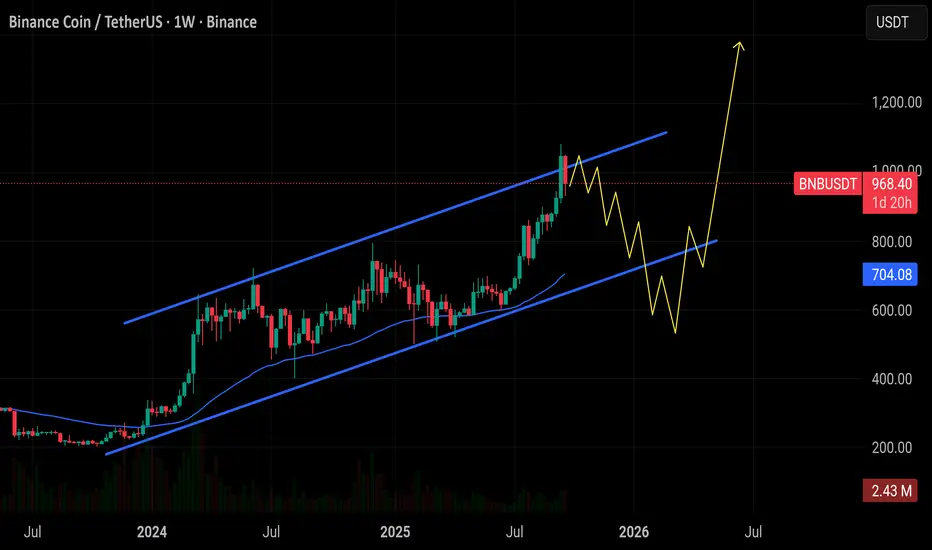
$BNB is holding near $968 with solid momentum, but ? CRYPTOCAP:BNB is holding near $968 with solid momentum, but I expect a healthy dip toward the $710–550 support zone before the next big move. That’s the area I’ll be looking to load, with eyes on a breakout toward $1,200+.
BNB 1H Analysis - Key Triggers Ahead😃 Hey , how's it going ? Come over here — Satoshi got something for you!
⏰ We’re analyzing BNB on the 1-Hour timeframe.
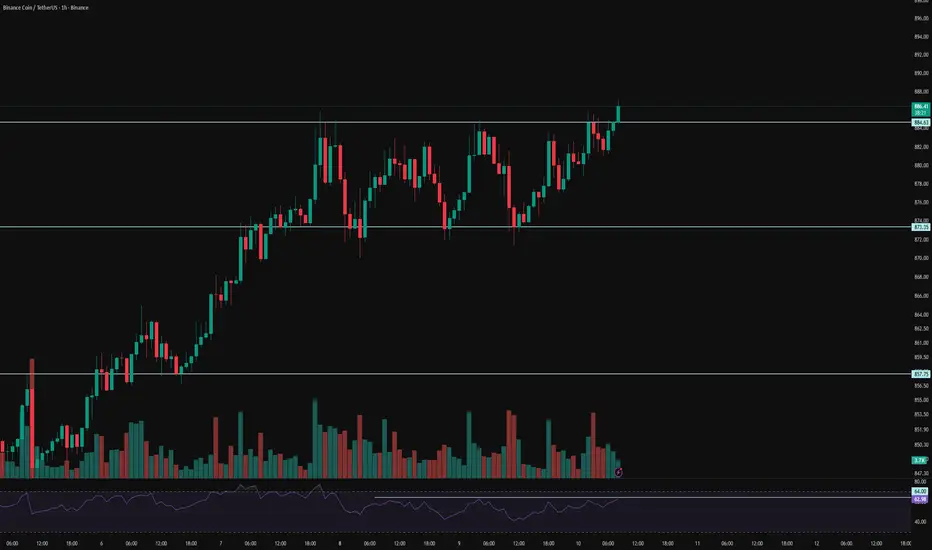
👀 On the 1-hour timeframe of Binance Coin we can see that this coin, the popular token of Binance exchange with very strong backing, has formed a very important resistance at $885. With a breakout and confirmation above this level, and if the PPI news is positive, BNB could start another strong upward move.
⚙️ The key RSI level for this coin is at 64, and breaking above this level could give BNB higher volatility and even a price surge.
🕯 The volume, size, and number of green candles are increasing, and it seems we are almost exiting the range structure. With buying pressure and rising volatility, BNB could form more green candles and experience solid price growth.
🌒 On the 1-hour timeframe of the BNBBTC pair we can see that it has been rejected from the 0.007915 zone, which has created a trigger for a breakout at this level. If this zone is broken, BNB could also break its marked resistance in the USDT pair and move upward.
💡 This coin had resistance at $885, which has now been broken, and it is moving upward. A pullback to this resistance also happened during this breakout, which was executed well. For confirmation, you can also check the 15-minute timeframe.
❤️ Disclaimer : This analysis is purely based on my personal opinion and I only trade if the stated triggers are activated .
BNB - Just take the juice out!Small tight scalps and tight upmoves as said and as doodled here! Im not descriptive btw

BNB - short in a case of a BULL trapBNB - short in a case of a BULL trap
Coin alreadyy did 100% rise
also Oi started dropping that;s often a signal for range creation or a pullback

BNB in Strong Uptrend | AB=CD Pattern + Breakout SetupDescription:
#BNB is currently moving in a strong uptrend with high volume, showing no bearish signs on the chart. On the 4H timeframe, price action is forming a bullish AB=CD pattern, which strengthens the upside potential.
Trading Plan:
Waiting for a clear breakout above the resistance level
Entering long trade only after breakout confirmation
Applying strict risk management (SL below support)
High-volume breakout setups often lead to strong continuation moves.
Let’s see if #BNB can continue its bullish momentum and head towards new highs!
#BNB #Crypto #Altcoins #PriceAction #TechnicalAnalysis #Trading #ChartPatterns #CryptoTrading #Breakout #ABCDPattern #4HChart #RiskManagement
BNB
📊 **Setup BNB/USDT (15m)**
🟢 **Entry Zone (Demand):**
≈ 1,009 – 1,011
🔻 **Stop Loss (SL):**
1,000
🎯 **Take Profit (TP):**
* TP1 👉 1,016
* TP2 👉 1,026
* TP Max 🚀👉 1,036
📌 **Analisa Singkat:**
BNB rebounded from demand in the 1,009-1,011 area. As long as this demand persists, the potential for an increase to TP1 and TP Max is quite strong. If demand breaks through, be careful, as it could fall further below 1,000.

Congratulations to BNB Holders BINANCE COIN has been one of the Best Performing Altcoin in this Bull Run it's Amazing to acknowledge and congratulate the Hodlers.
Do you care to know the Reasons Behind BNB's Price Surge?
1. Institutional Adoption
Kazakhstan's state-backed Alem Crypto Fund has invested in BNB, lending credibility and long-term confidence to the asset.
2. Binance Blockchain Week 2025 in Dubai The event has sparked market buzz and reinforced confidence in Binance's ecosystem and BNB.
3. Crypto-as-a-Service (CaaS) Binance's new service expands BNB's utility, enabling businesses and governments to integrate digital assets seamlessly.
4. Deflationary Tokenomics BNB's burn mechanism removes tokens from circulation, tightening supply amid rising demand. Recently, 2.1 million BNB worth $1.6 billion were burned.
4. Strong On-Chain Activity BNB Chain processed 13.95 million daily transactions, up 14.46% week-on-week.
5. ETF Speculation Growing optimism around BNB ETFs contributes to bullish momentum.
Technically, BNB's Relative Strength Index (RSI) remains healthy between 63-65, avoiding overbought territory. The MACD indicates weakening bearish momentum, supporting the bullish narrative. Key resistance lies at $1,080, with potential targets of $1,145 if bulls maintain control.
Overall, BNB's blend of strong fundamentals, institutional backing, and ecosystem expansion positions it favorably in the current crypto landscape.

BNB Breakout Play – Eyeing the Next Wave📊 Current Setup
BNB surprised the market at the start of the week. Instead of continuing its downward channel and making that next leg down, price broke out above the channel — a strong bullish signal. This breakout shows that sellers lost momentum, and bulls are starting to take the driver’s seat 🐂⚡.
Right now, after such a push, we’re seeing the market cooling off — a natural correction phase after a bullish impulse. This correction isn’t weakness, it’s just the market recharging for the next wave.
🚦 Trading Plan
👉 I’m watching the $950 support area as a prime entry zone 🌴. If price pulls back there and shows signs of holding, that’s the beach where bulls can reload.
👉 Target: Riding the wave up toward $1,075 🎯. That’s the level where profit-taking makes sense as it lines up with previous structure.
👉 Stop-loss: Tucked around $925 🛑 to stay safe in case the setup fails.
🧭 My Take
The breakout from the downward channel flipped the vibe on BNB. Short-term corrections are healthy, and I see the $950 zone as a solid opportunity to step in for the next run. The risk is defined, the reward is solid, and the trend shift adds weight to the bullish case.
This is less about chasing green candles and more about waiting for the chart to reset — patience now sets up a cleaner ride later 🌊🚀.
💬 What do you think about this scenario? Only share your idea if you’ve got another opinion — otherwise just hit that button 👍
