BNBUSDT.5S trade ideas

Binance coin has dropped from $860 ┆ HolderStatOKX:BNBUSDT on the 6h chart shows a double top near 880, a sign of temporary weakness. However, the market is holding above the $800 critical level. Past triangle and sideways patterns hint at continued accumulation, with upside potential once 860 is cleared.

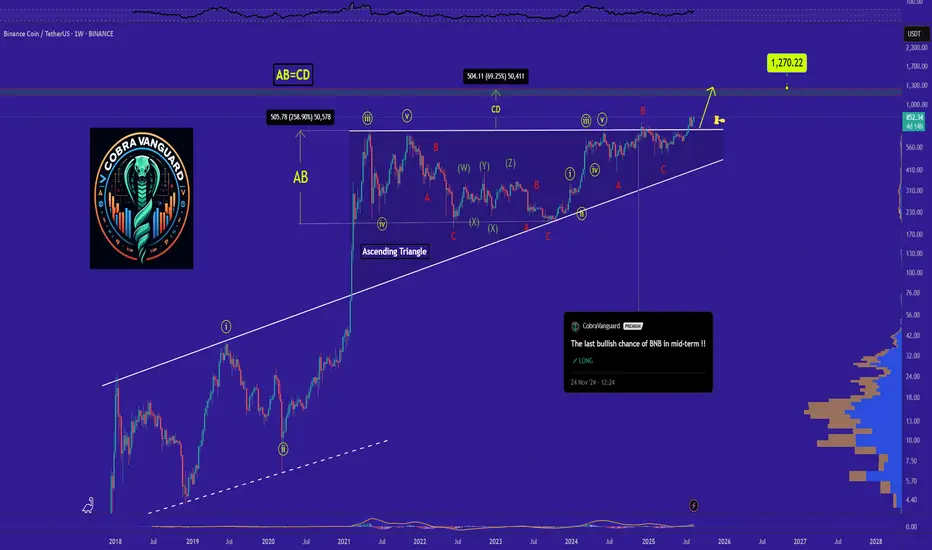
Do you think I'm joking ???As I said, BNB broke the triangle, it could surge to $1000 , and you still think I'm joking!!
The price is currently supported well, which can increase the price.
Stay Awesome , CobraVanguard
Previous analysis
BNB - Bread and BreadIts not AirBnB its oly bread with no butter and u know where u can get the butter atleast

Bnb short to $806sl: 834.25
tp: 806
bnb just closed below daily support and it doesn't look like it have the strength ot even correct up a lot before it dumps more based on my candlestick analysis. Its seen much clearer on the daily tf


Binance Coin (BNB): Looking For Another Bounce ZoneBNB has had a decent upside movement since the last time we touched the zone of EMA, where the price got recently rejected near the local resistance zone.
As we got rejected, we are seeing further downside movement and pressure, so we are looking for another movement toward the EMAs, where we will be looking for similar MSB like last time we touched those zones.
We set few entry zones that we will be keeping an eye on; once we reach them, we are going to look for MSB and then another movement towards the resistance area.
Swallow Academy

Bnb long to $870Just now opened a long position on bnb
Aiming for the higher highs at $870
Sl: 844.10

BNB Wave Analysis – 18 August 2025- BNB reversed from strong resistance level 859.00
- Likely to fall to support level 810.00
BNB cryptocurrency recently reversed from the resistance zone located between the strong resistance level 859.00 and the upper daily Bollinger Band.
The downward reversal from this resistance zone is likely to form the daily Japanese candlesticks reversal pattern Bearish Engulfing.
Given the strength of the resistance level 859.00 and the overbought daily Stochastic, BNB cryptocurrency can be expected to fall to the next support level 810.00 (low of the earlier wave ii).

BNB SHORT TRADE SETUPNew Trade Setup: BNB-USDT
SHORT
Entry: 829.92 OR CMP
Target: TP1: 811.49, TP2: 793.05, TP3: 774.62, TP4: 756.19
Stoploss: 871.86
Leverage: 1X
Technical Analysis: BNB/USDT failed to break its resistance level. As the overall market is falling, we can see a downtrend in BNB also for the next few days.

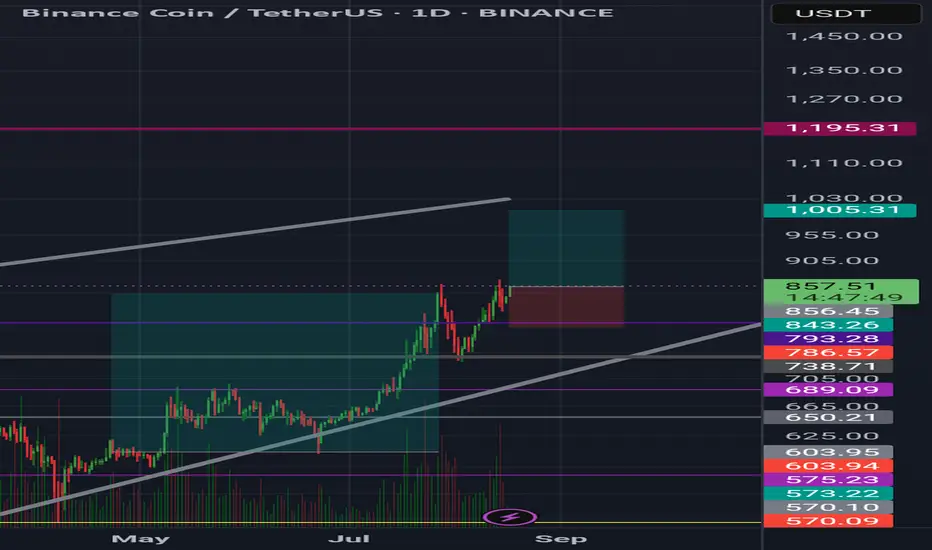
BnBBnb usdt daily analysis
Time frame daily
Risk rewards ratio >2.3 👈👈
Target 1005$
Try to breaks the last high
BNB/USDT 4H chart reviewKey levels:
• Resistance: 845.64 → 867.39 → 898.75
• Support: 819.84 → 788.98 → 765.21
• Current price: ~ 835 USDT
Structure:
• The upward trend is still in force (black rising trend line).
• After the summit around 867, the market made a correction to 819 and bounced.
• Now the price consolidates between 819 and 845, just above the trend line.
Scenarios:
1. Bullish (advantage of buyers)
• If the price stays over Trendline and 845, a possible attack on 867, and then to 898.
• Confirmation of increases will be closed with a 4h candle above 845.
2. Bearish (sellers' advantage)
• Support loss 819 = weakness signal.
• Further goals: 789 and 765 (key support).
• Trendline fracture will further strengthen the pressure of supply.
📊 Summary:
• As long as 819 and the trend line hold the advantage on the bull side.
• 845–867 is a strong resistance zone - here you have to be careful about the implementation of profits.
• Breaking below 819 will open the way to a deeper correction.

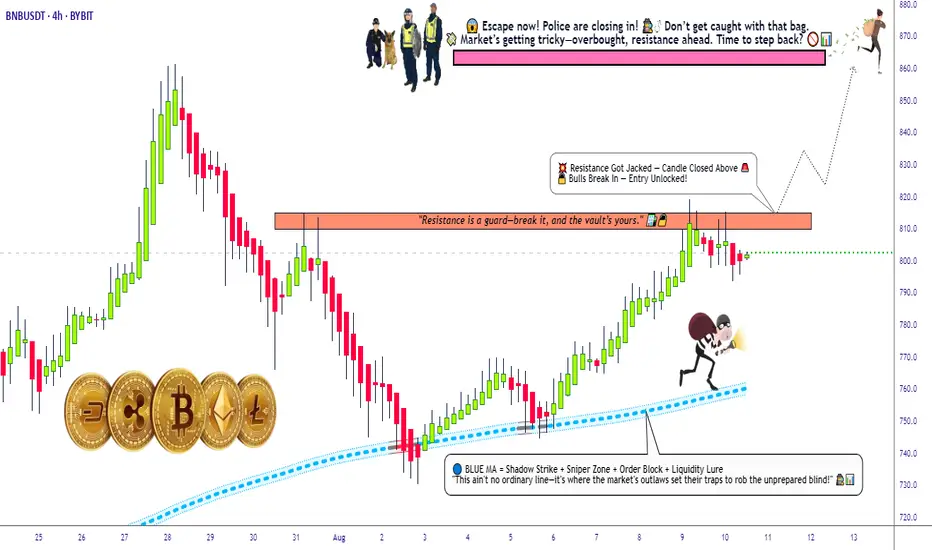
BNB Breakout Masterplan | Police Trap Near Target – Exit Early💎BNB/USDT – The Binance Coin Breakout Heist @820💎
🚨🛡️ Thieves Assemble! 🛡️🚨
The BNB vault doors are about to swing open at 820.0 – and we’re first in line to snatch the loot! This isn’t just a trade; it’s a full-blown breakout robbery plan!
📌 Asset: BNB/USDT "Binance Coin vs Tether"
📌 Plan: Bullish Breakout
📌 Entry: Any price level (load up those layered limit orders like a pro safecracker 🗝️)
📌 Stop Loss: 783.0 (Hide your tracks here if the mission fails)
📌 Target: 860.0 – but remember… the POLICE are waiting near the target 🚓💨, so exit before they close in!
🎯 Mission Brief:
Our technical recon shows BNB is ready to blast past resistance @820.0 – powered by momentum, liquidity traps, and a bit of fear in the bear camp. We layer orders like stacking gold bars, letting the market hand us profit bags one by one.
🛑 Stop Loss Protocol:
Place it with precision at 783.0. Adjust according to your order size & risk appetite – this is no place for sloppy work.
💰 Profit Extraction:
860.0 is the jackpot zone – but if the heat gets too close, escape earlier with your bags full. Use trailing SL to secure the loot.
⚠️ Market Surveillance Alert:
Avoid entering during high-impact news – too many sirens. 🚨
Lock in profits once the market gives you the chance – don’t get greedy.
Scalpers: Only rob on the long side; bears are heavily armed.
💥 Support the crew – Boost this idea so our robbery team grows stronger! Every boost makes us richer in both clout and coin. 🏴☠️💎
Stay sharp, move fast, and escape clean.
We’ll meet again for the next big market heist. 🤑🚀
LONG BNBMulti-Timeframe Bullish Confirmation: Weekly, daily, and 4h charts all show sustained uptrend, with price above key EMAs and strong momentum across time horizons.
Strong Institutional and Ecosystem Support: Recent news highlights large institutional acquisitions and expanding Binance ecosystem utility, affirming BNB’s foundational role in crypto infrastructure.
Clear Technical Targets: Fibonacci extensions and previous highs give a well-defined price objective, with $1,250 as the thesis target and technical resistance only modestly overhead.
Robust Risk Management: Stop loss placed at $626—safely below major technical supports and past swing lows—protects capital while allowing room for volatility.
Healthy Market Structure: No signs of euphoria or volume blow-off, just steady liquidity and rising relative volume, consistent with sustainable growth phases.
Positive Macro and Altcoin Context: Alts have very healthy momentum and inflation as well as risk assets are grinding higher.
Compelling Risk-Reward Profile: Thesis offers an asymmetric opportunity (~1.86 R/R), fitting for a patient multi-week/month position with clear upside and measured downside.

Lingrid | BNBUSDT Buying Opportunity Following Pullbacks The price perfectly fulfilled my previous idea . BINANCE:BNBUSDT is pulling back toward the upward trendline support after forming a higher low, keeping the bullish structure intact. Price action suggests buyers may step in near the 814 zone, aiming for a rebound toward 915 resistance within the channel. Holding above 800 would maintain the second impulse leg toward the projected 920 target. Momentum continuation aligns with the overall uptrend trajectory.
📉 Key Levels
Buy trigger: Break above 860
Buy zone: 814 – 850
Target: 915 – 920
Invalidation: Close below 800
💡 Risks
Failure to hold trendline support at 800
Weak breakout above 860 leading to a bull trap
Increased selling pressure near 915 resistance
If this idea resonates with you or you have your own opinion, traders, hit the comments. I’m excited to read your thoughts!


BNB/USDT 1DTrend and market structure
• The price moves in an upward trend from the hole around 730 USDT, maintaining support on the trend line (orange line).
• Current price: ~ 840 USDT, close to important resistance at ~ 862 USDT.
• Another strong resistance is located at 940–950 USDT.
• The next support is 809 USDT (local horizontal level) and 758 USDT (earlier hole).
⸻
Medium walking (SMA)
• SMA #1 (red) is below the price - this is a growth signal.
• SMA #2 (green, long -term) is also below and inclined up - confirms the upward trend.
• SMA #5 (blue, very long) is far below - the market is still in the growth phase.
⸻
Indicators
• MacD - MacD line pierces the signal line from below, which is a buy signal. The histogram is slightly positive.
• RSI - ~ 66 points, grows towards the purchase zone (70). There is no extreme yet, but it is approaching - the risk of correction after breaking the resistance.
⸻
• (more likely with current dynamics): breaking the level of 862 USDT and continuation in the direction of 940 USDT. There are more profit realizations possible here.
• Bear: rejection from resistance and decrease in the direction of 809 USDT or even a trend line test and level 758 USDT.

DeGRAM | BNBUSD held the support line📊 Technical Analysis
● BNBUSD rebounded from the purple rising support line and is now forming higher lows above the 750 support, aligning with the long-term channel base.
● The price structure suggests a bullish continuation toward 808.5 and 847.3 if price holds above 750, with a zigzag consolidation pattern indicating controlled accumulation.
💡 Fundamental Analysis
● Rising user activity and new project launches on BNB Chain continue to attract liquidity, while Binance's recent compliance wins restore investor confidence.
✨ Summary
Buy 755–765; hold >750 targets 808.5 → 847.3. Setup invalidated on daily close <735.
-------------------
Share your opinion in the comments and support the idea with a like. Thanks for your support!

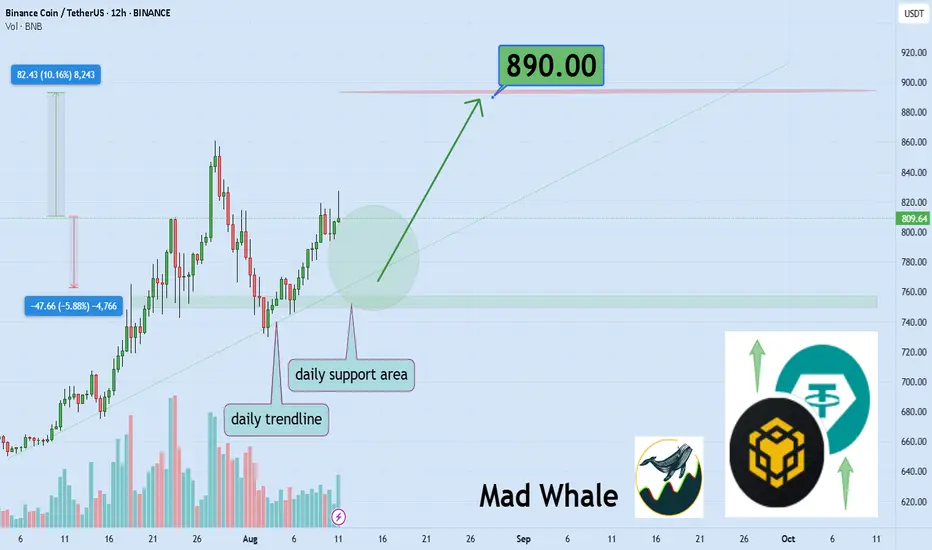
Binance Testing Support, Poised for 10% Rally to $890Hello✌️
Let’s analyze Binance’s price action both technically and fundamentally 📈.
🔍Fundamental analysis:
CEA Industries bought 200K BNB ($160M) in July 2025 as part of a $500M reserve plan, joining other firms adding BNB to their treasuries.
Institutional buying could tighten supply and support BNB toward the $1,000 mark if demand grows. 📈
📊Technical analysis:
BINANCE:BNBUSDT is testing a strong daily support and a key monthly trendline 📉. If these levels hold, a 10% upside move toward $890 is likely 🚀.
✨We put love into every post!
Your support inspires us 💛 Drop a comment we’d love to hear from you! Thanks, Mad Whale
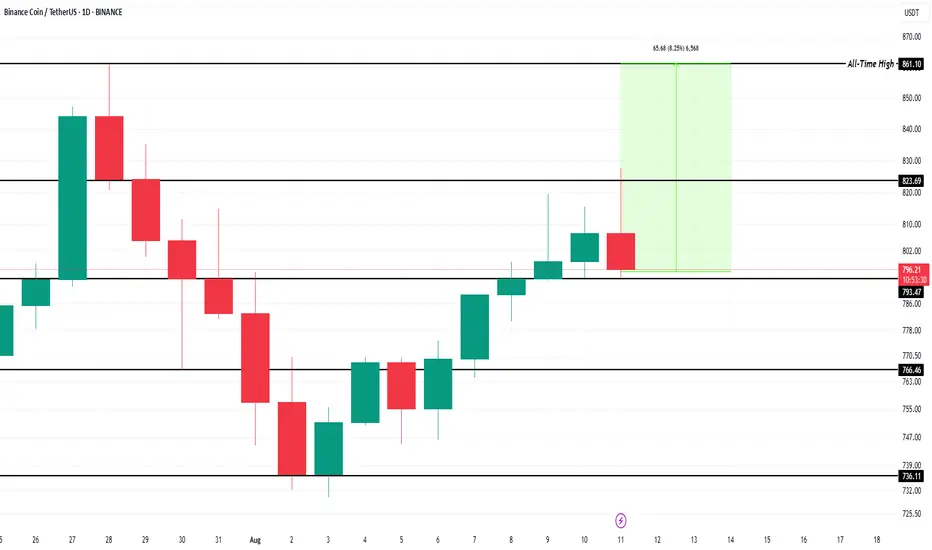
BNB Price Stands Only 8% From ATH, Can It Reach This Week?BINANCE:BNBUSDT is currently the altcoin closest to its all-time high (ATH), trading just 8.25% from the $861 ATH . At $822, it remains poised for a potential breakout. The proximity to its ATH indicates strong market sentiment and potential for further upward movement in the near future.
The previous ATH was set about three weeks ago, and with broader market support, BNB could continue its bullish momentum. If the market conditions remain favorable, BINANCE:BNBUSDT may reach $861 and potentially break through it , surpassing the previous record high within this week.
However, if the broader market fails to maintain its rally, BINANCE:BNBUSDT may struggle to breach the $823 level . In such a scenario, a price drop could occur, pushing BNB down to $793 or potentially lower to $766 . Market conditions will be crucial in determining the direction of BNB’s price.
BNB – Buy Side Liquidity Taken, what next ?BNB just raided a major buy-side liquidity pool, triggering breakout longs before sharply reversing.
Smart Money may now be eyeing downside targets if structure shifts bearish.
📊 Higher Timeframe View (D1):
Price swept the December high (~$860), taking buy stops.
Immediate rejection shows potential exhaustion of bullish momentum.
RSI showing divergence — strength weakening as liquidity is taken.
🎯 Potential Plan:
Bias: Short, only if LTF confirms BOS.
Entry: M15–H1 BOS + retest of supply zone near $820–$830.
Target: $710 first, extended $680.
Stop Loss: Above $865 sweep high.
📚 Lesson:
Liquidity raids often precede strong reversals. Waiting for confirmation prevents getting caught on the wrong side of Smart Money moves.

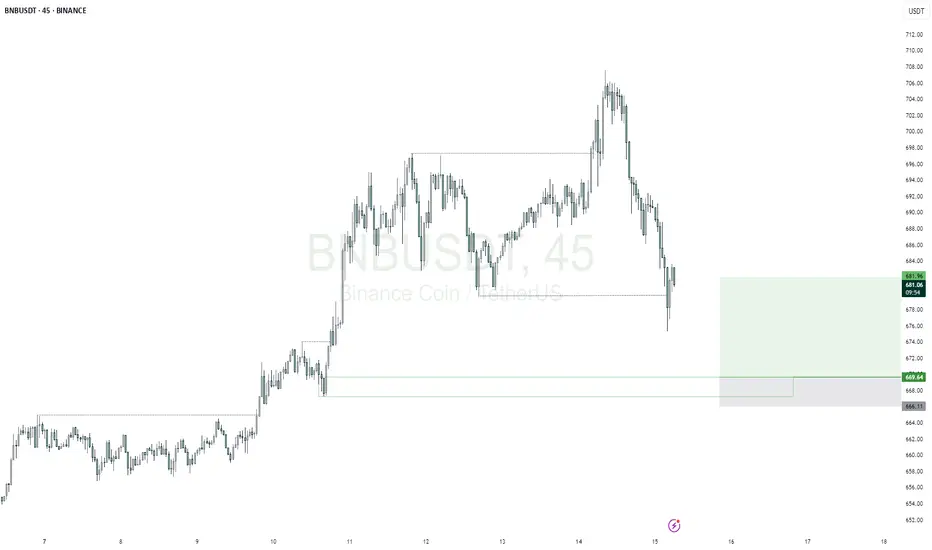
BNBUSDTmy entry on this trade idea is taken from a point of interest below an inducement (X).. I extended my stoploss area to cover for the whole swing as price can target the liquidity there before going as I anticipate.. just a trade idea, not financial advise
Entry; $669.64
Take Profit; $681.96
Stop Loss; $666.11
BNB at the top of Bullish Channel
As it shown, BNB is around top line of Channel ad get ready to drop
