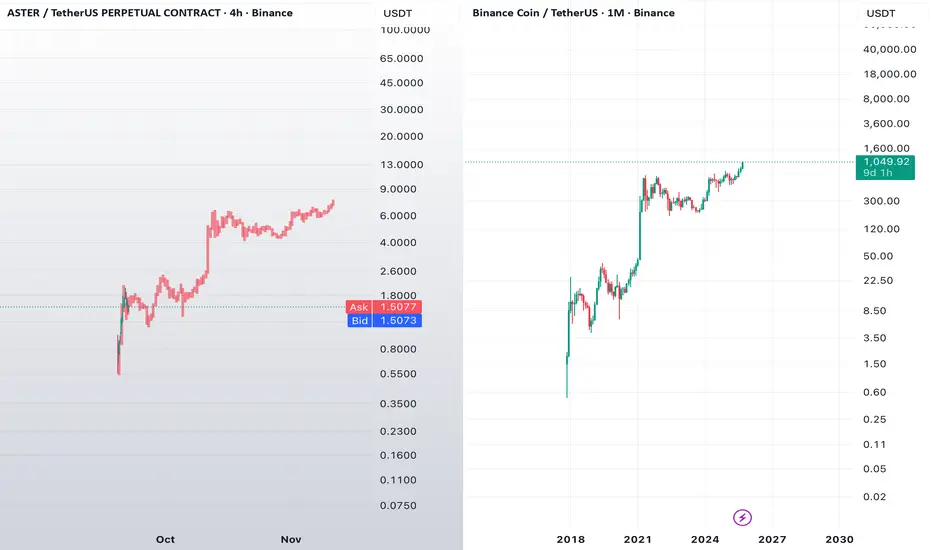
ASTER = the next BNB?The pattern similarity is scary.
ASTER is starting to look like a textbook early-stage winner.
📈 Price action has shown explosive momentum, and now it’s consolidating above $1.50 — a healthy signal of continuation.
If this mirrors even 10–15% of BNB's historical move, we could be looking at $15–50+ targets in the long term.
Why it matters:
– Strong structure with higher lows
– Clean launch, minimal scammy wicks
– Steady volume growth
– Early narrative potential
– Ecosystem token vibes just like early BNB
🧠 Crypto rewards early conviction.
If ASTER becomes the core token of its ecosystem, this might be your second chance at a BNB-like run.
💬 What’s your price target for ASTER this cycle?
Drop your takes ⬇️
BNBUST.P trade ideas
BNB; ATHHello friends
Given the recent growth we have had, the price has formed a double top pattern and is in the specified support areas, we can expect the price to be supported until the specified targets.
*Trade safely with us*

$BNB entering a SHORT POSITION at $1056I have decided to short CRYPTOCAP:BNB based on the DAILY chart alone.
Entering now SHORT $1056
STOP LOSS: $1115
TAKE profits: $960
RSI very overheated at 81, Wave 5 finishing rally on all main timeframes, LIQUIDITY trapped below the $980 mark from late longs, bear RSI divergences on many longer timeframes, including MONTHLY.
And #bnb has just hit the TRIANGLE (a pattern that started in DEC 2024 and broke out in MAY initially) target at $964 on the DAILY.
Risky long, but I like this trade especially on a Sunday early afternoon 💙👽

$BNB multi-year CUP & HANDLE 15% away from the target ($1220)Going thru some weekly charts and CRYPTOCAP:BNB immediately stands out with this gigantic multiyear CUP & HANDLE which broke out mid-July, actually.
Cup&Handle's rough estimate target would be slightly above $1220 but its obviously very late for this especially with accumulated late longs that are showing on the attached Liquidation Heatmap between $950 and $985. So that's likely where we are heading once this ongoing WAVE 5(5) is finished.
Obviously today will be the highest weekly candle close and we only have to find out what kind of a rejection wick will be on that candle.
I'm starting to take profits from here up to $1200 as the RSI is starting to overheat (76.5 atm), there could be just enough fuel in that tank to reach the pattern's target tbh💙👽

BNB is forming a bearish double top pattern📊 CRYPTOCAP:BNB Market Update
CRYPTOCAP:BNB is forming a bearish double top pattern 🔻 and is now testing the blue support zone 🔵. Watch closely — if support breaks, further downside could follow.
BNB CAN MAKE A NEW ATHi think BINANCE:BNBUSDT still bullish and can make a new ATH in the next Hours . i don't know how far it can reach but a new ATH is in plan!
best entry point can be in 4H FVG

BNB remains extremely bullish and can hit $1400 soonBNB continues to hold a strong bullish structure on the 4H chart, staying above the 50 EMA and maintaining higher highs and higher lows. Momentum indicators remain supportive of the trend.
📌 Plan: Look to buy the dips.
First demand zone: $959 – $975 (Fib 0.618 support + previous structure)
Second demand zone: $939 – $950 (deeper retracement area)
🎯 Upside targets:
$1,050 → short-term extension
$1,280 → continuation
$1,400 → major bullish target

BNB/USDT: Bullish Climb to 965?As the previous analysis worked exactly as predicted, BINANCE:BNBUSDT is gearing up for a bullish move on the 4-hour chart , with an entry zone between 859-868 near a key support and trendline.
First target at 930 marks initial resistance, while the second at 965 signals a potential breakout. Set a stop loss on a daily close below 840 to manage risk effectively. 🌟
A break above 875 with solid volume could trigger this climb, driven by BNB ecosystem news and market momentum. Watch BTC trends! 💡 Ready for this rise? Drop your take below! 👇
📝 Trade Plan:
✅ Entry Zone: 859 – 868 (support + trendline area)
❌ Stop Loss: Daily close below 840 to manage risk
🎯 Target 1: 930 (initial resistance)
🎯 Target 2: 965 (potential breakout zone)
Ready for this rise? Drop your take below! 👇


BNB THE $1000 ATH on wayBNB did a new ATH and can complete it over $1000 in the coming time, which makes BNB a strong coin movement.

BNB: (BNBUSDT) ATH Would You Sell Or Hold!?BNB have shown a great significant move by breaking above $1000 for the first time in history it have been among the most favorable cryptocurrency asset of the year, which keeps surging up for couple of months.
Meanwhile do you think it is good to buy and invest at this time..?
Like and follow up my page for more market updates.
Thanks for reading.

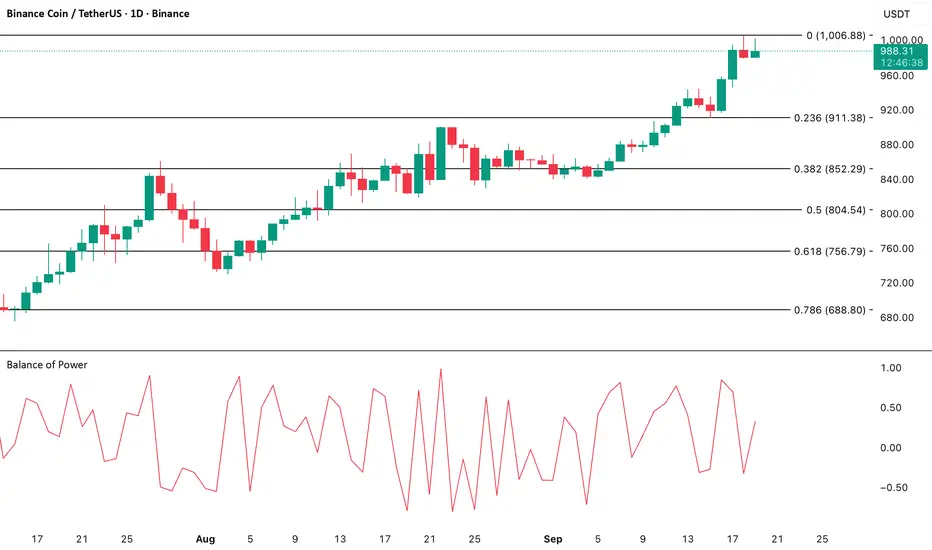
BNB Buyers Hold the Upper HandBNB’s rally above the $1,000 mark has captured the attention of traders. Although the price has eased slightly lower, the coin remains close to its peak, supported by strong bullish sentiment in the market.
The Balance of Power (BOP) indicator currently stands at 0.28, signaling buyers’ dominance. This positive reading suggests bulls remain firmly in control despite BNB’s minor pullback from record highs.
If bullish momentum continues, BNB could retest its all-time high at $1,001 and push for a breakout above it. However, if profit-taking intensifies, a correction lower.
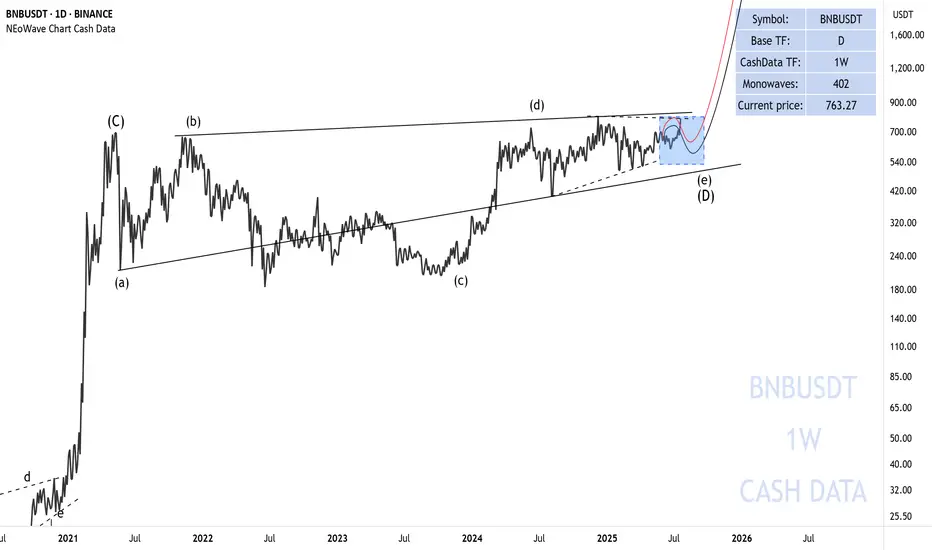
BNB is getting ready to riseThe first bullish move I was expecting for BNB has taken place and it looks like we should be waiting for the formation of wave-e of (e).
After the completion of wave-(e), we expect a big rise for BNB.
Good luck
NEoWave Chart
BNB is bullish now and many Traders don't see it !!As I said, BNB broke the triangle, it reached to $1000 , and you still think I'm joking!!
The price is currently supported well, which can increase the price.
Stay Awesome , CobraVanguard
previuos analysis
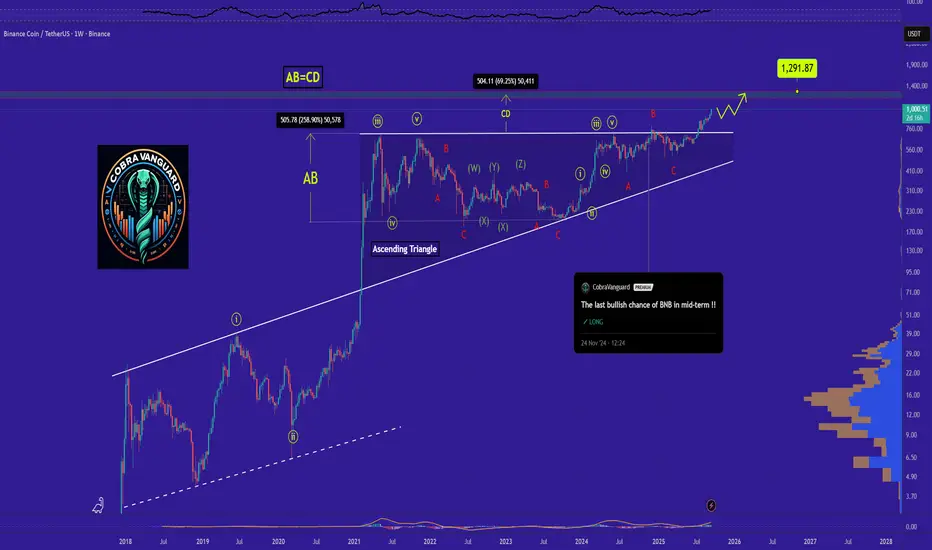
$BNB NEW ATH - GO TO 1000CRYPTOCAP:BNB Ascending triangle with a breakout at the top, candle closes strongly. See how the price develops in search of the target on the chart pattern.

Technical analysis for BNB/USDT1. Overall Trend (Price Action & Market Structure)
• Long-term trend: Strong bullish trend — since March 2025, price broke out of a long consolidation zone (~550–680 USDT) and is now hitting new highs.
• Mid-term trend: After breaking out from the accumulation range, price is forming a sequence of Higher Highs (HH) and Higher Lows (HL).
• Key supports: ~786 USDT (breakout zone + 0.786 Fib), 720 USDT (previous local top).
• Key resistances: Current resistance zone ~860–880 USDT. Next target: ~975–980 USDT (1.618 Fib).
⸻
2. Fibonacci Analysis
From the drawn retracement:
• Price has broken above 0.786 and is now trading beyond the 1.0 Fib.
• Fibonacci extensions:
• 1.272: ~920 USDT
• 1.618: ~975–980 USDT → likely target if momentum stays intact.
• Current price action suggests the market could aim for 1.618 within the coming weeks if no major correction occurs.
⸻
3. Volume
• Breakout from consolidation was supported by increasing volume — confirming strong buying interest.
• Recent bullish candles have moderate volume — not yet euphoric, but demand is clearly exceeding supply.
• If near 880–900 USDT we see large-volume candles with long upper wicks, this could signal distribution.
⸻
4. RSI (Momentum)
• Daily RSI is around ~72 → market is entering overbought territory.
• Two possible scenarios:
• Continuation: RSI can remain overbought during strong trends (overbought can stay overbought).
• Correction: RSI dropping below 70 with bearish divergence forming against price.
⸻
5. Chart Patterns
• Breakout from a wide rectangle range (550–680 USDT).
• Current move resembles a mark-up phase with a possible mini-flag on H4.
• No clear signs of Wyckoff-style distribution yet.
⸻
6. EMAs / SMAs
(Not visible on your chart, but based on typical setups in such a trend):
• EMA20 and EMA50 on D1 are strongly spread apart — confirming bullish momentum.
• Price is far above EMA200 → long-term trend remains healthy.
⸻
7. Scenarios
Bullish:
• Holding above 820–830 USDT → attack on 920 USDT, then 975–980 USDT (1.618 Fib).
• RSI may stay >70 for several days, historically giving BNB an extra few % of gains.
Bearish:
• Drop below 820 USDT → retest of 786 USDT support.
• Break of 786 → deeper correction towards 720 USDT (breakout retest).
⸻
8. Summary
• Trend: Strong bullish trend, momentum still favors buyers.
• Key levels:
• Support: 786 → 720 USDT
• Resistance: 880 → 920 → 975–980 USDT
• Risks: Possible pullback at RSI >70, especially if volume spikes and large upper wicks appear.

DeGRAM | BNBUSD above the $900 level📊 Technical Analysis
● BNB/USD has confirmed a breakout above the 900 level, turning former resistance into support while price continues to respect the ascending channel.
● The structure points to bullish continuation, with buyers likely targeting the 1,000 psychological level if the 900–910 zone holds as a base.
💡 Fundamental Analysis
● Binance’s recent efforts to expand regulatory compliance and strengthen its ecosystem continue to support investor confidence, reinforcing BNB’s role as a core exchange token.
✨ Summary
Bullish above 900; targets 950 → 1,000. Invalidation on a close below 890.
-------------------
Share your opinion in the comments and support the idea with a like. Thanks for your support!

BNB: BREAKING OUT AND TESTING WEEKLY RESISTANCEBinance Coin BNB/USDT is exhibiting 2 interesting patterns at the moment on weekly timeframe
1. A Breakout and re-test of the weekly resistance (since ATH in May 21 to ATH in Jun 24).
2. Although not a perfect cup and handle pattern, yet if considered one, it shows a thrilling target @ $1000 (which is achievable in upcoming bull run)
Best of Luck!!

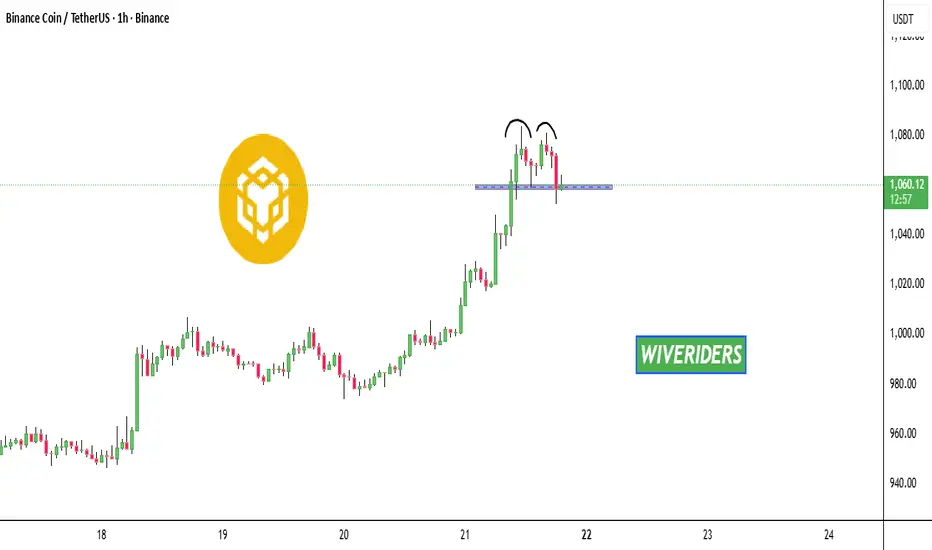
What do you think about $BNB hereWould you want to sell here? I just feel BNB will sell very soon, maybe after the FOMC news update later today.
What do you think?

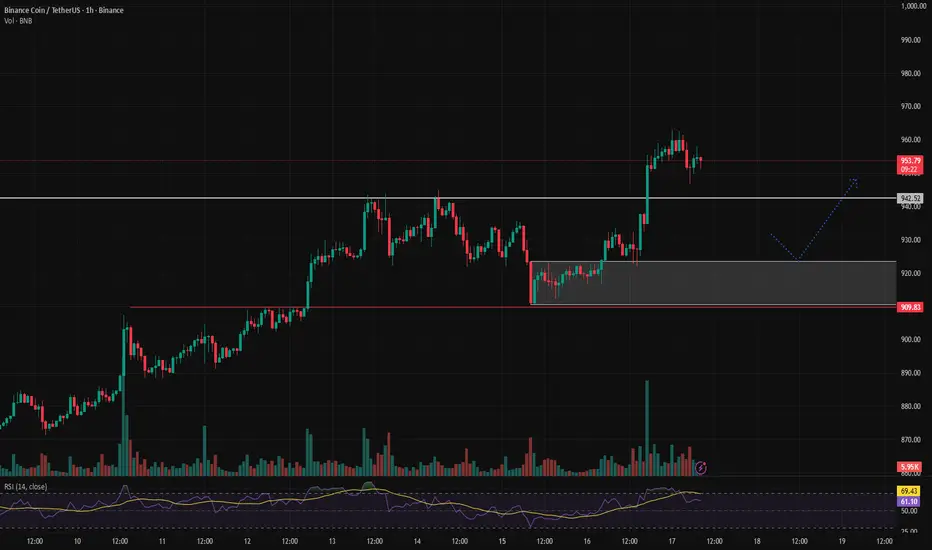
BNBUSDT Technical Analysis (1H Timeframe)Let’s see what opportunities the market might give us to enter! 🚀
BNB price recently broke above the 942 resistance level and rallied sharply to around 955.
It is now undergoing a minor pullback. Based on the current market structure, a potential scenario is a retracement toward the 915–925 demand zone , where buyers may step in again and push the price back up above 942 .
🔹 Key Support Zone: 915 – 925
🔹 Key Short-Term Resistance: 942 – 945
🔹 Likely Scenario: Pullback to demand zone followed by a bullish continuation
BNB Targets $1100–$1200 After Reclaiming All-Time HighsBNB has decisively reclaimed its all-time highs, reinforcing its strong bullish market structure. Technical projections suggest the next Fibonacci extension lies between $1100 and $1200, offering the next clear target zone.
Among major altcoins, BNB has shown one of the most impressive structural recoveries, reclaiming its all-time highs and maintaining strong momentum. The weekly chart highlights a bullish projection with higher targets still to come, supported by Fibonacci extension confluence. Traders now anticipate whether BNB can maintain its trajectory toward the $1100–$1200 zone.
Key Technical Points:
Reclaimed all-time highs, confirming bullish continuation.
Strong weekly trend structure supports further gains.
Next 0.618 Fibonacci extension sits at $1100–$1200.
BNB’s strength lies in its ability to overcome major resistance at previous highs. This reclaim often signals renewed momentum, opening the path to new price discovery zones. Current price action remains bullish across higher timeframes, with no signs of structural weakness.
The 0.618 Fibonacci extension of the current move projects a range between $1100 and $1200. This makes the zone a logical magnet for price action as traders seek new targets. Given the bullish demand observed in the order books and strong participation on the weekly chart, continuation higher remains the dominant bias.
However, traders should remain cautious of corrective pullbacks. Any sharp retests of reclaimed support levels should be viewed in the context of continuation, provided the overall structure of higher lows remains intact.
What to Expect in the Coming Price Action:
BNB’s technicals point toward higher prices in the immediate short term, with the $1100–$1200 zone standing as the next major target. Corrections may occur, but the broader weekly structure remains firmly bullish.

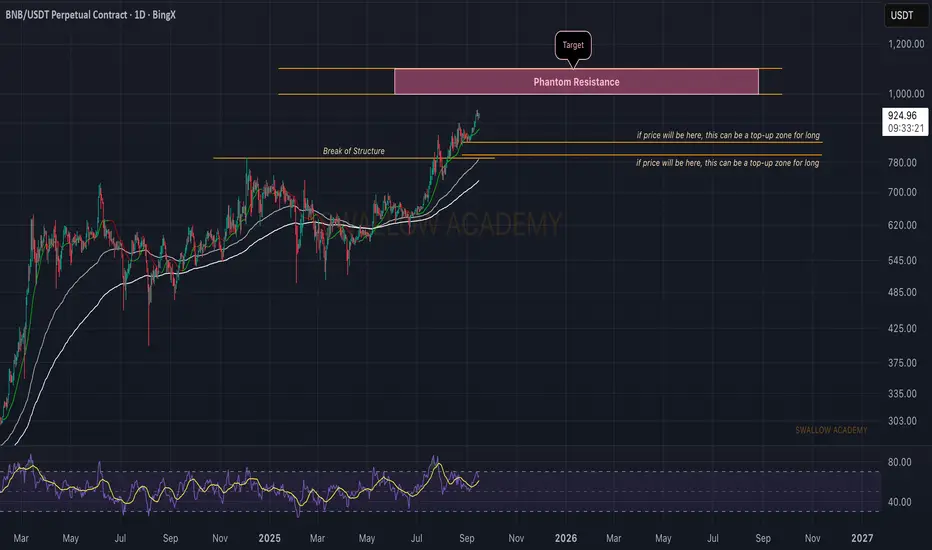
Binance Coin (BNB): 4 Digit ATH Incoming | $1000BNB has been holding strong after the breakup of the structure and is now moving closer to the phantom resistance zone (the new ATH). Buyers are keeping the momentum, and as long as this push continues, we’re looking for the price to reach the $1,000–1,200 area. Any retest of the lower support zones could provide an opportunity to add to long positions.
Swallow Academy
BNB/USDT – 1H OutlookBNB is currently retracing upward into a key supply zone after a recent break of structure to the downside. This supply area stands as a critical decision point, where sellers may look to regain control and drive the price lower. The overall market structure remains bearish, suggesting that this upward move could simply be a temporary pullback rather than a full trend reversal.
If price action shows rejection within supply, it may confirm continuation of the bearish momentum, opening the way for a move towards the lower demand zone. On the other hand, a strong breakout above supply would delay bearish confirmation and potentially allow buyers to extend the rally further.
At this stage, monitoring price behavior within supply is crucial, as it will determine whether the market respects the bearish structure or attempts a short-term shift in sentiment.
