The Impact of News on Price: Should You React?"
In trading, news has always been a powerful factor capable of moving markets by double digits within hours. A single headline in the financial media or a tweet from a politician can send an asset soaring or crashing, wiping out stop-losses and creating waves of panic. Many traders have faced moments when a sudden “breaking story” ruined carefully built plans: technical analysis showed a steady trend, but a flood of headlines turned the market in the opposite direction. Naturally, the question arises: should we react to news immediately, or is it better to stay calm?
Most traders make their biggest mistakes during such moments. The temptation appears to jump straight into a position or close one in fear. Emotions take over: fear of missing out and greed for quick profits. The problem is, these decisions rarely come from a system. More often, they turn trading into gambling, where outcomes depend on luck instead of analysis.
The truth is, news itself doesn’t always have a straightforward impact on the market. What matters more is how participants react. The same piece of information can trigger a rally or a sell-off depending on how major players interpret it. Blindly following the headlines rarely leads to consistent results.
A more effective approach is to treat news as background, not as a direct call to action. At the core of successful trading lies discipline and an understanding of levels, not headlines. If the price is approaching a pre-marked zone, that zone—not a comment on a news feed—defines the scenario. This way, the trader avoids guessing crowd reactions and focuses on what is objectively visible on the chart.
Consider two scenarios. In the first, a trader sees news that a large fund has purchased crypto and instantly opens a long. In the second, the same trader reads the same news but acts only after confirming the move technically, at pre-defined levels. The difference is striking: the first approach is emotional, the second is structured. And it’s the latter that reduces chaotic mistakes.
To trade this way, it’s not enough to simply recognize levels—you need a system to control them. That’s where structured analysis comes in: viewing price step by step, turning trading into a managed process. With this approach, profit targets, risk zones, and scenarios are mapped out in advance. Strong news flow becomes a side factor, not the core driver of decisions.
Experienced traders know that news will always shake markets. Instead of chasing every headline, it’s more effective to build trades that can withstand volatility. What helps here is having a process that removes emotions and focuses on numbers. Automation of analysis and clear visualization of key levels transform trading from chaotic reactions into a disciplined plan.
So, should you react to news? The answer is: yes, but not directly. React through your system. If the news aligns with the technical picture, it can add conviction. If it contradicts it, the priority remains with structure, not emotion. This is what allows you to operate calmly, without panic or euphoria.
Markets will never stop being unpredictable, and news is just one facet of that uncertainty. But discipline, technical analysis, and structured control can turn even the noisiest events into a manageable process. In the end, it’s not the headlines that matter most, but your ability to stay focused and consistent. And this is exactly where tools that automate the process, reduce chaos, and keep logic at the center become indispensable."
BNBUST.P trade ideas
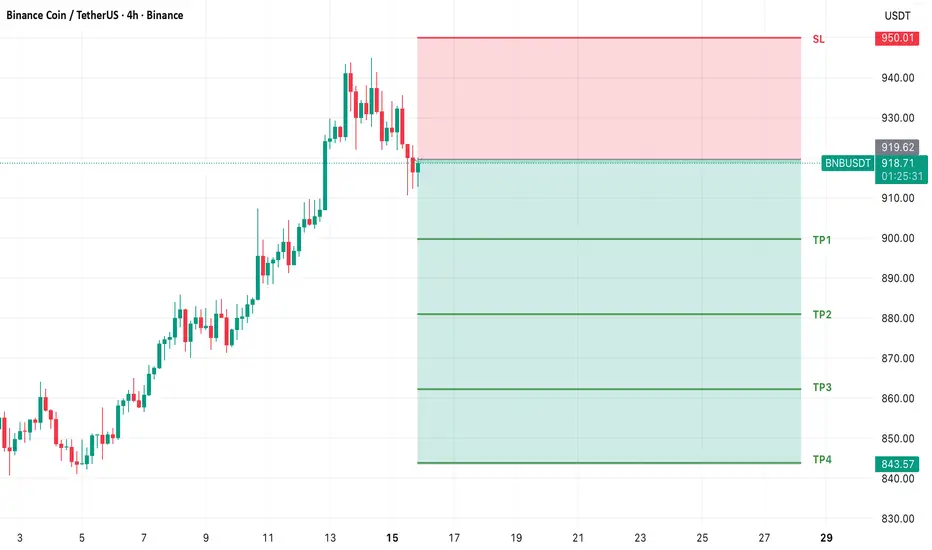
BNB SHORT TRADE SETUPNew Trade Setup: BNB-USDT
SHORT
Entry: 918.52 or CMP
Target: TP1: 899.78, TP2: 881.04, TP3: 862.30, TP4: 843.57
Stoploss: 950.01
Leverage: 1X
Technical Analysis: BNB/USDT is taking reversal at its resistance zone, indicating a high chance of a short-term trend reversal. We may see an downtrend in the short term.
BNB WEEKLYHello friends🙌
🔊We are here with BNB analysis:
A long-term analysis that can be viewed as an investment, but in the long term, with patience and capital management...
You can see that after weeks of price suffering, a good upward move has now been formed by buyers, which has also caused a new ceiling to be set. Considering the market decline and the decline of most currencies, you can see that BNB is well supported and its price has suffered.
⚠Now, with the arrival of buyers, you can enter a long-term buy trade with capital management.
🔥Follow us for more signals🔥
*Trade safely with us*

DeGRAM | BNBUSD held the support level📊 Technical Analysis
● BNB/USD is trending inside an upward channel, with recent price action breaking and retesting the channel boundary, confirming bullish continuation.
● Current structure shows higher lows above 832 support, positioning price for a move toward 936 resistance if momentum sustains.
💡 Fundamental Analysis
● Binance Smart Chain activity has increased with rising DeFi and gaming adoption, while Binance continues expanding regulatory approvals globally, bolstering investor confidence.
✨ Summary
Bullish above 832; targets 900 → 936. Invalidation on a close below 820.
-------------------
Share your opinion in the comments and support the idea with a like. Thanks for your support!

BNB/USDT Technical 4HThe chart displays a rising wedge pattern, formed by two converging trendlines—typically a bearish reversal signal.
A pink trendline, representing short-term support, has recently been broken, suggesting weakening bullish momentum.
The price is now approaching a horizontal support level around $900.19, which could act as a key decision point.
Bearish Case:
The rising wedge breakdown and breach of the pink support line suggest a possible move toward $900.19.
If $900 fails to hold, further downside toward $880–$890 is likely.
Momentum indicators (not shown) may confirm bearish divergence.
Bullish Case:
If price rebounds from $900.19 and reclaims the broken support trendline, a retest of $938.84 is possible.
A breakout above the wedge would invalidate the bearish setup and could trigger a rally toward $950+.

BNB is looking strong to reach $900 region (+25%) BNB is breaking a huge resistance with a monthly candle and could reach the fibonacci 1:1 extension at $900 (+25%) region soon. Very strong momentum for BNB continues to reach higher prices, if the weekly candle could stays above $723 will be a great sign for BNB increase its price at least (+25%).

BNB/USDT Short-Term🔎 Current situation:
• Price: ~ 896.9 USDT.
• Trend: You can see an upward trend short -term, but now the price consolidates just below the resistance.
• Support:
• 892.8 (SMA - short -term).
• 885.5 (key horizontal support).
• resistance:
• 899.5 (local resistance, SMA #1).
• 907.9 (strong resistance - previous peak).
⸻
📊 Indicators:
• SMA: The price balances between the short (892.8) and the long average (green ~ 896). This gives a picture of the "balance point".
• MacD: The lines are close to each other, the histogram decreases → neutral signal, possible transition towards sales, if the signal line goes up above MacD.
• RSI: ~ 50–55 → neutral zone, nor purchase nor sales.
⸻
📈 short -term scenarios (1-6h):
1. Bull (more likely if it stays above 892.8):
• Breaking 899.5 → Attack on 907.9.
• If the volume increases, up to 912+ may occur.
2. Bear (if it goes below 892.8):
• decrease towards 885.5 (key level of support).
• Punction 885.5 → Movement down to 878–880.

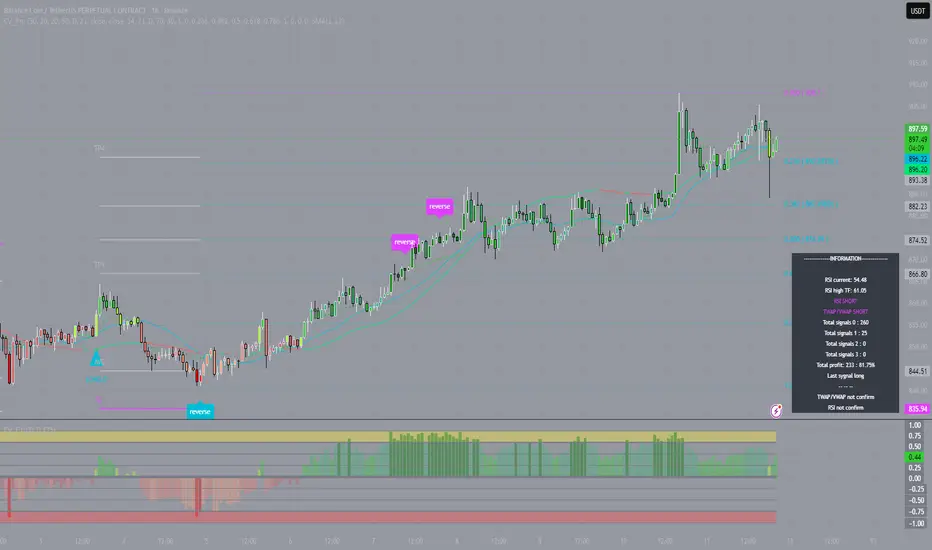
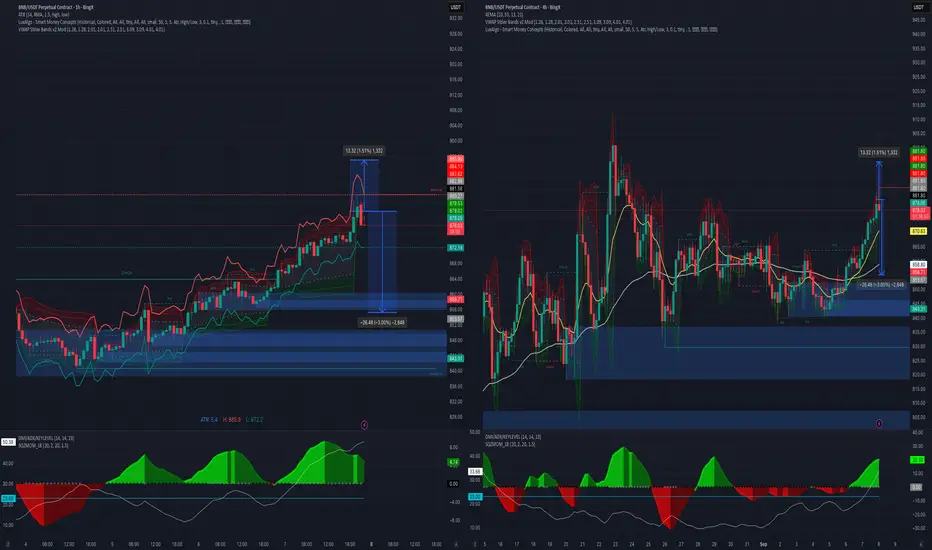
BNB: Controlled MoveOn September 3, I entered a long on the 1-hour chart from $857 with 10x leverage. The upward move turned out to be extended: price reached $908, and along the way four profit-taking levels were hit. The difference of more than $50 per coin was secured — part of the potential was left to the market, but that’s a natural part of the strategy.
The key in this trade was not guessing but working with structure. The indicator highlighted important zones in advance, and I followed the plan step by step. This approach allowed me to stay calm even through sharp price swings and reduced the impact of emotions on the process.
When trading is built systematically, control becomes easier: it’s clear where to take profit, where to keep holding, and where maintaining composure matters most. With leverage, this is exactly what separates stability from chaos.
The market will always remain unpredictable, but discipline and structure make it manageable. That’s how trading turns into a process where results are defined not by luck, but by the ability to follow a system.
BNB - NEW ATH !!!! 🚨 BREAKING: #BNB HITS NEW ALL-TIME HIGH! 💥
REAL FOMO IS KICKING IN!
Is $1,000 the next stop? 🚀
Levels to watch:
$875 - $900
$950 - $960
1000$

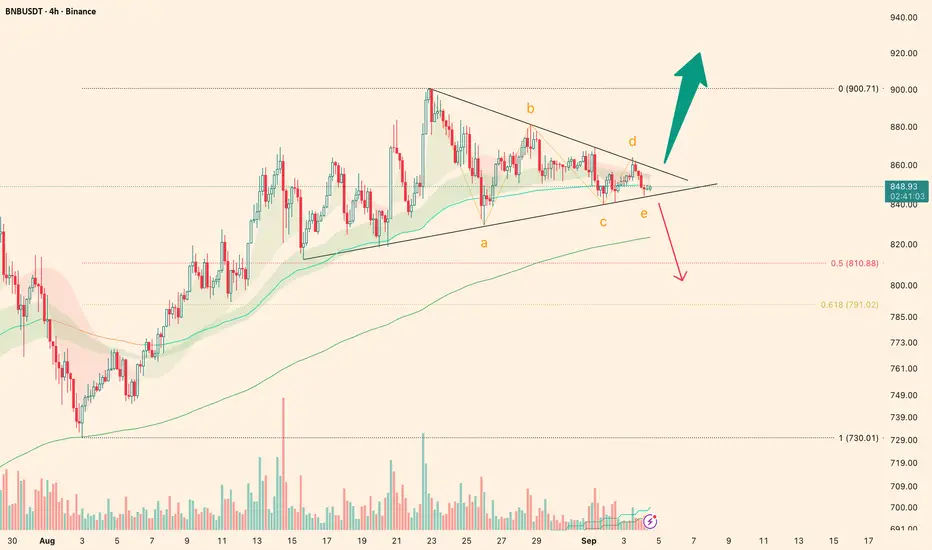
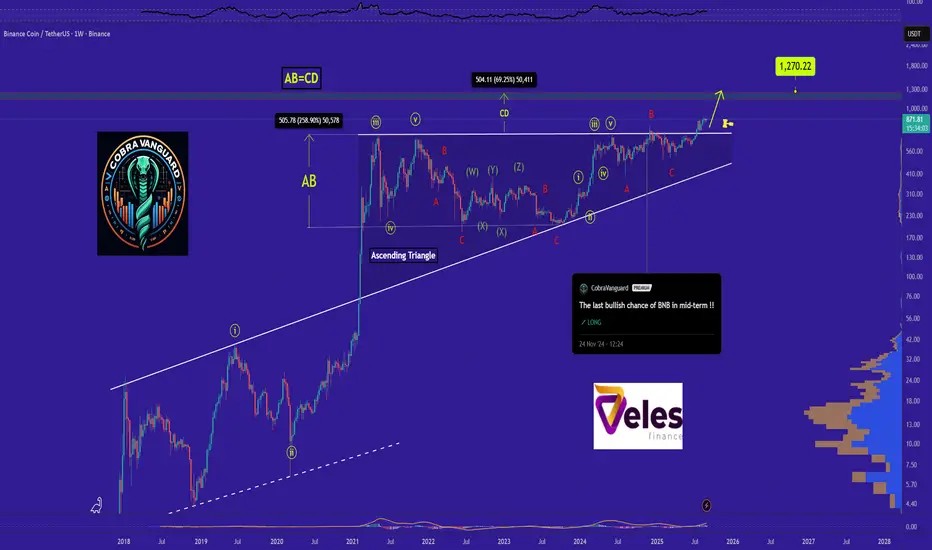
BNB Approaching Triangle Breakout — Long or Short Ahead?BNB’s price is consolidating within an ABCDE triangle . On the chart, two clear trendlines can be drawn: the descending line with 4 touches and the ascending line with 5 touches , highlighting the importance of both.
If the descending trendline breaks, I’ll be looking for long positions, as the price would likely aim to set a new ATH. However, there’s still a chance of a drop within a standard ABC correction.
If the ascending trendline breaks, I’ll be opening short positions with a target in the 810–790 range
BNBUSDT — Bullish consolidation ahead of resumed uptrendThe bullish consolidation in BNBUSDT that I’ve been watching has begun to resolve in the market’s favor. Price action is coiling after two consecutive white spinning-top candles, a pattern that signals indecision but also a readiness to resume the prior trend when confirmed. The move has occurred on heavier volume concentrated in the current price area, and the pair sits roughly halfway between two key Fibonacci retracement levels — a location that commonly precedes a corrective bounce rather than a full trend reversal. Trend Strength sits just above zero, suggesting a fragile bullish bias rather than conviction.
Viewed on a slightly wider timeframe, BNBUSDT is grinding inside a shallow range that resembles a consolidation brick; the path of least resistance still leans toward the upside provided the short-term structure holds. Conventionally, the presence of consecutive indecisive candles on increased volume near mid-Fibonacci territory combined with a mildly positive momentum indicator favors a corrective rebound rather than an extended sell-off.
Key short-term levels to monitor on the way up are the 38.2% Fibonacci retracement as the likeliest target for the initial bounce, with a secondary cap at the 50% retracement if buyers show enough follow-through. Beyond those, a return toward prior highs remains plausible, though that area will present a zone of elevated resistance and will need clear volume-backed breakout confirmation to be trusted.
RSI and other momentum readings are consistent with a measured recovery rather than an impulsive surge, so expect the move to unfold over the coming 2–3 weeks. If the market fails to sustain above the 38.2% level and momentum turns down, the alternate scenario would be a continuation of the consolidation or a deeper retracement toward the lower Fibonacci boundary.
Short summary:
Setup : consolidation with two white spinning-top candles, heavier volume locally, price midway between two Fibonacci levels, Trend Strength slightly > 0.
Base case : corrective bounce to 38.2% (primary) — up to 50% (maximum) — then continuation higher toward prior highs (resistance zone).
Timeframe : ~2–3 weeks.

BNB Strong Resistance Meets Whales Sell Orders – A Good Short BNB Current Market Update
The coin is now trading at its All-Time High , facing a very strong resistance around $900 .
This presents a great short opportunity .
After carefully monitoring buy and sell orders on-chain, I noticed a strong confirmation for the short setup:
Whales and Market Makers sell orders are clustered heavily around the $888 – $890 resistance zone.
✅ My Personal Strategy:
Short Entry: Resistance zone between $888 – $890
🎯 Target 1: $876
🎯 Target 2: $873
Please note:
This is not financial advice – I’m only sharing my personal trades.
Always do your own research before taking action.
👍 Don’t forget to like if you found this useful, and feel free to follow me for more analysis of this kind.
Best of luck 🌹

BNBUSDT 1H coin holding the channelBinance Coin keeps moving inside its upward channel, once again confirming support at the lower boundary. EMAs are aligned below price, creating a local cushion, while the volume profile highlights accumulation around 860–870.
As long as price holds above 838, the structure stays bullish with the next upside target around 920–940.
Fundamentally BNB still carries the weight of the largest exchange behind it, which adds long-term confidence for buyers.
Right now BNB looks like a train on its rails
the direction is clear, only the speed of the ride remains in question.

BNB/USDT: Bullish Momentum Sustains Within Upward ChannelThe BNB/USDT market continues to trade within a strong ascending channel, having rebounded from the 865 support zone, which reaffirmed bullish momentum. The price action displays a clear pattern of higher lows and a steady rise along the upward trendline, signaling firm buyer control.
Currently, the price is aiming for the 932 level, with a possible extension toward the 970 resistance zone if momentum remains intact. While a mid-channel rejection could lead to short-term consolidation, the overall structure supports the likelihood of a continuation rather than a reversal.
As long as the channel holds, the bulls are well-positioned to challenge the overhead resistance zones, keeping the uptrend scenario firmly in play.

BNBUSDT | Sell Setup | 09 Sep 2025 – 08:20 EDTBNBUSDT | Sell Setup | 09 Sep 2025 – 08:20 EDT
Buy Zone: 885– 881
Sell Zone: 877 – 871
Scenario : Sell
Entry: 876
Stop Loss: 885
Targets:
TP1 → 872-870
TP2 → 845
Analysis:
From Sell Zone (877 – 871) creates possibilities for a sell move.
Stay alert on updates here.
⚠️ Disclaimer: This idea is shared for educational purposes only and should not be considered financial advice. Please do your own analysis before making trading decisions.
BINANCE:BNBUSDT_PREMIUM CRYPTO:BNBUSD CRYPTOCAP:BNB DELTAIN:BNBUSD.P DELTA:BNBUSDT.P

Lingrid | BNBUSDT Trend Continuation Pattern Completed. BuyBINANCE:BNBUSDT is trading within a strong upward channel after rebounding from the 865 support zone, confirming bullish momentum. The chart shows a sequence of higher lows and a sustained climb along the trendline, highlighting the strength of buyers. Price is now targeting the 932 level, with potential extension toward the 970 resistance area if momentum holds. As long as the upward channel remains intact, the probability favors continuation rather than reversal. A rejection at mid-channel could still provide consolidation before the next leg higher. Broader structure suggests that bulls are preparing to challenge overhead resistance zones.
💡 Risks:
A break below 865 would invalidate the bullish channel and expose downside toward 748.
Upcoming CPI data could boost USD strength, weighing on crypto market sentiment.
A sudden shift in Fed guidance or risk-off sentiment in equities could stall the breakout attempt.
If this idea resonates with you or you have your own opinion, traders, hit the comments. I’m excited to read your thoughts!

“What I will do today in BNB”Possible entry in BNB around 881.64 with stop at 895.17 and take at 855.14, 1:2 ratio.
BNBUSDTI see a divergence on a daily time frame for BNB.
Lower prices are expected for the upcoming weeks.


BNB is bullish now and many Traders don't see it !!As I said, BNB broke the triangle, it could surge to $1000 , and you still think I'm joking!!
The price is currently supported well, which can increase the price.
Stay Awesome , CobraVanguard
Previous analysis
What Does a Range-Bound Market MeanThe market isn’t always driven by dynamic, trending moves. There are periods when price seems to “freeze” between levels, moving up and down but without a clear direction. This condition is called a range-bound market, or flat (sideways movement). Such phases often become a real test for traders because trend-following strategies stop working, and chaotic trades frequently lead to losses.
What Is a Range-Bound Market
A range-bound market is a section of the chart where price oscillates within a narrow channel, repeatedly testing support and resistance levels without a decisive breakout. In such phases, the market is essentially “resting” after a strong move, consolidating energy and preparing for the next impulse.
From a market psychology perspective, flat conditions represent a balance between buyers and sellers. Some participants wait for a favorable entry point, while others lock in profits or reduce exposure. As a result, price fluctuates within a corridor until an imbalance of forces triggers a breakout.
Why Flat Conditions Are Risky
At first glance, sideways movement may seem safe: price isn’t crashing or soaring dramatically. But this is exactly where the danger lies for traders.
- False breakouts: Price often moves beyond the range briefly, creating the illusion of a new trend, only to snap back. Traders who rushed in usually end up with losses.
- Increased transaction costs: Frequent entries and exits within a range lead to numerous small trades, and commissions eat into potential profits.
- Emotional burnout: A prolonged sideways market makes it hard to stay focused. Mistakes stem from fatigue and the urge to “make something happen.”
That’s why many traders consider a range-bound market the worst state: it offers little directional movement but creates plenty of opportunities to overtrade and lose.
How to Trade During Flat Conditions
The most common mistake is trying to trade a flat market the same way as a trending one. Instead, a different playbook applies here.
- Define the range boundaries: Support and resistance levels become critical. Mark them clearly and pay attention to repeated touches.
- Trade from the edges: It’s usually better to enter near support (buy) or resistance (sell) rather than in the middle of the range.
- Take profits quickly: Don’t expect large moves. Targets in range trading are much smaller than in trending conditions.
- Reduce trade frequency: Avoid reacting to every small price swing. Wait for confirmations at levels and act selectively.
- Watch the volume: Breakouts are often accompanied by a volume spike. That can be the first signal of a directional move ahead.
When to Expect a Breakout
Every range eventually ends. The question is when and in which direction. To avoid guessing, look for signs of preparation:
- Price starts compressing within the range, forming a triangle pattern.
- Trading volume decreases, followed by a sudden surge.
- Support or resistance levels get tested more frequently.
A breakout confirmed by price consolidation above resistance or below support usually marks the start of a new trend. These moments often create the best entry opportunities.
Why a Systematic Approach Matters Most
Most traders lose money in sideways markets not because they lack knowledge, but because they give in to emotions. The urge to chase every move, fear of missing “the breakout,” or frustration from inactivity turn trading into random gambling. A systematic approach changes the picture. When a trader has a clear algorithm—how to spot ranges, which levels to mark, where to take profits, and when to wait for a breakout—the market becomes structured, not chaotic. Discipline is even more important in flat conditions than in trends, because this is where the foundation for the next strong move is laid.
The Practical Value of Automation
Flat phases are where automation tools are especially helpful. Algorithms that highlight levels, suggest take-profit zones, and manage risk allow traders to avoid guesswork and emotional mistakes.
- For beginners, this serves as a navigation tool: they learn to recognize market structure and understand when to act and when to stay out.
- For experienced traders, automation supports discipline, speeds up analysis, and reduces emotional bias.
Conclusion
A range-bound market isn’t the enemy of traders—it’s a natural state of the market. It may be exhausting with its unpredictability and tempting false moves, but these periods build the energy for future trends.
Traders who can identify flat conditions and follow a structured system not only protect their capital but also position themselves for strong moves that always follow consolidation.
The market will always test traders’ nerves. But with discipline, technical analysis, and automation, even the chaos of a sideways phase becomes a controlled process. And that’s what separates random luck from consistent results.

BNB: Downward TrendOn August 24, the BNB market turned into a downward move on the 1-hour chart from the $871 level. Since then, price has steadily moved through profit-taking zones and reached a low of $832, giving a difference of nearly $40 per coin. The trade has already passed four targets and remains active, keeping potential for further continuation.
The main value here lies in management. The algorithm step by step highlighted profit-taking zones and helped relieve emotional pressure. This approach allows traders to hold positions longer and capture more from the move without giving in to fear or greed.
For beginners, it works like a navigator: simplifying chart reading and showing where it’s safer to take profit and where holding makes sense. The market will always be unpredictable, but when the process is structured, trading stops being a chaotic gamble and turns into a system where discipline makes the difference.

BNB WEEKLY CHARTBNB WEEKLY CHART,we are still bullish for BNB until the break of the weekly demand floor ,if we dont break that weekly floor dont think of making careless sell other,
NOTE all buy and sell are given in the structure for reference only
#bnb #bnbusdt
