Microsoft - A very profitable repetition!💰Microsoft ( NASDAQ:MSFT ) just repeats the cycle:
🔎Analysis summary:
At this exact moment, Microsoft is once again retesting the upper channel resistance trendline. Following all previous cycles, there is a 100% chance that we will see a short term retracement. Since the trend remains bullis
Next report date
—
Report period
—
EPS estimate
—
Revenue estimate
—
13.70 USD
101.83 B USD
281.72 B USD
7.32 B
About Microsoft Corp.
Sector
Industry
CEO
Satya Nadella
Website
Headquarters
Redmond
Founded
1975
ISIN
US5949181045
FIGI
BBG000BPH459
Microsoft Corp engages in the development and support of software, services, devices, and solutions. It operates through the following business segments: Productivity and Business Processes; Intelligent Cloud; and More Personal Computing. The Productivity and Business Processes segment comprises products and services in the portfolio of productivity, communication, and information services of the company spanning a variety of devices and platform. The Intelligent Cloud segment refers to the public, private, and hybrid serve products and cloud services of the company which can power modern business. The More Personal Computing segment encompasses products and services geared towards the interests of end users, developers, and IT professionals across all devices. The firm also offers operating systems; cross-device productivity applications; server applications; business solution applications; desktop and server management tools; software development tools; video games; personal computers, tablets; gaming and entertainment consoles; other intelligent devices; and related accessories. The company was founded by Paul Gardner Allen and William Henry Gates III in 1975 and is headquartered in Redmond, WA.
Related stocks

The report is good, but there is no stock dynamicsMSFT gapped up at around $555 on the report and reached a market cap of $4.1 trillion
This happened because the report significantly exceeded expectations on key metrics
The latest quarterly report showed record results.
Revenue for the quarter was $76.4 billion (up 18% y/y)
Net income was $27.2 b
Microsoft Swing Long into Swing Short. Elliot Wave countLook for long setups between 440-480 with current ATH being the initial target. After that look for swing short setups above current ATH. Difficult to determine where exactly the low will be put in. So look for setups and reaction in that 10% zone. A lot of daily and weekly sma's stacking. Anchored

Market Correlations between US, Europe, and AsiaIntroduction
Global financial markets are more connected today than at any other time in history. Advances in technology, international trade, cross-border investments, and geopolitical events have created a web of interdependence between major financial hubs. Among them, the United States, Europe,
What Is a Pyramiding Strategy, and How Does It Work in Trading?What Is a Pyramiding Strategy, and How Does It Work in Trading?
Pyramiding is a trading strategy where traders gradually increase their position size as the market moves in their favour. Instead of committing full capital upfront, they add to winning positions at key levels. This article explains
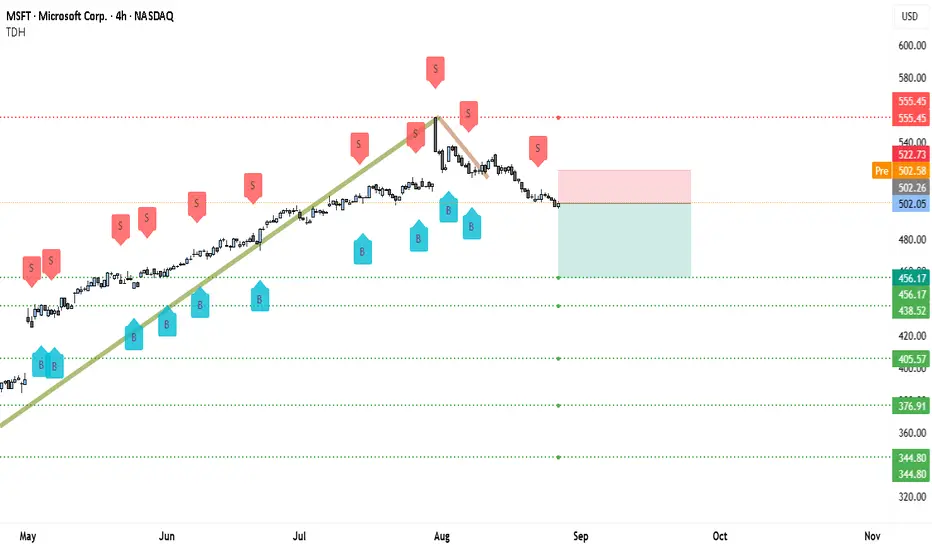
MSFT Breakdown: Eyeing $456 First Profit TargetOn the 4H chart of Microsoft (MSFT), the overall structure has shifted from bullish to bearish. For several months, MSFT respected a strong upward trendline, consistently forming higher highs and higher lows. This uptrend peaked around the $555 zone, after which sellers started dominating. The sharp
MSFT LongBroader Market Structure (MSFT 15M):
Microsoft’s short-term structure shows a clear bearish shift. After printing a high at 511.97, price rolled over, creating a Change of Character (CHoCH) and following through with a Break of Structure (BOS) to the downside at 492.38. This confirmed a shift from b

Microsoft Stock Forecast: Security Risks and Q3 Earnings OutlookTicker: MSFT
Current Price: 504.34
Trend: Correction within ascending channel (540.00–490.00)
⸻
🔵 Bullish Scenario
• Entry: BUY STOP 516.05
• Targets: 540.00
• Stop-Loss: 506.00
🔴 Bearish Scenario
• Entry: SELL STOP 493.95
• Targets: 462.00
• Stop-Loss: 505.00
⸻
📊 Key Levels
• Resistance

a new trend might be forming, =SELLers looking powerful
**1→4: Bullish Exhaustion Phase**
- Solid uptrend from point 1 culminating in a gap up at point 4
- Strong volatility and selling immediately after the gap (potential exhaustion gap)
- Point 4 marks the distribution high around $550 area
**4→7: Clear Distribution & Markdown**
- Series of lower hig

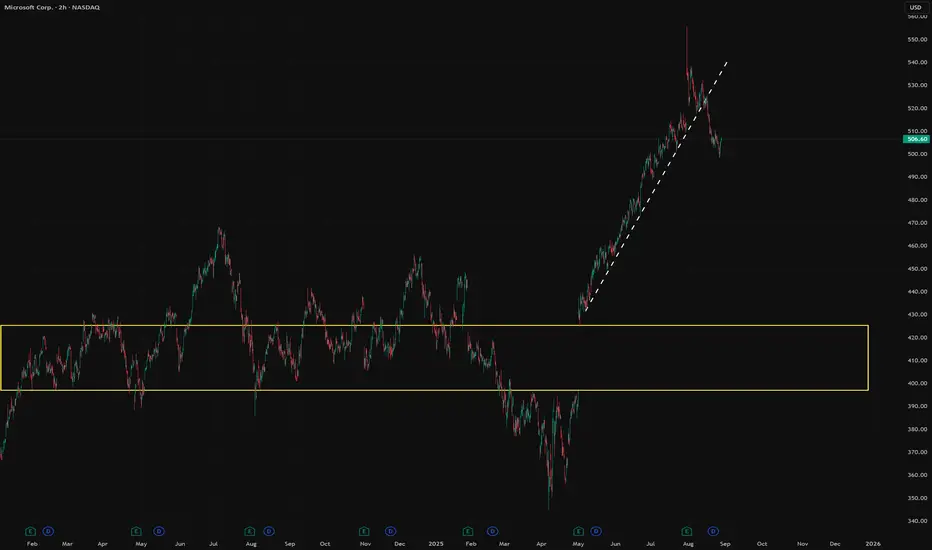
Microsoft - This chart is too obvious!💡Microsoft ( NASDAQ:MSFT ) perfectly respects structure:
🔎Analysis summary:
Back in April of 2025, Microsoft created a textbook all time high bullish break and retest. After this move, Microsoft started a rally of +50%, perfectly in conformity with the rising channel pattern. The trend remain

See all ideas
An aggregate view of professional's ratings.
Neutral
SellBuy
Strong sellStrong buy
Strong sellSellNeutralBuyStrong buy
Neutral
SellBuy
Strong sellStrong buy
Strong sellSellNeutralBuyStrong buy
Neutral
SellBuy
Strong sellStrong buy
Strong sellSellNeutralBuyStrong buy
Displays a symbol's price movements over previous years to identify recurring trends.
Curated watchlists where MSFT is featured.


Frequently Asked Questions
Depending on the exchange, the stock ticker may vary. For instance, on BOATS exchange Microsoft Corp. stocks are traded under the ticker MSFT.
We've gathered analysts' opinions on Microsoft Corp. future price: according to them, MSFT price has a max estimate of 700.00 USD and a min estimate of 485.00 USD. Watch MSFT chart and read a more detailed Microsoft Corp. stock forecast: see what analysts think of Microsoft Corp. and suggest that you do with its stocks.
MSFT reached its all-time high on Jul 31, 2025 with the price of 560.54 USD, and its all-time low was 200.00 USD and was reached on Oct 13, 2022. View more price dynamics on MSFT chart.
See other stocks reaching their highest and lowest prices.
See other stocks reaching their highest and lowest prices.
Yes, you can track Microsoft Corp. financials in yearly and quarterly reports right on TradingView.
Microsoft Corp. is going to release the next earnings report on Oct 28, 2025. Keep track of upcoming events with our Earnings Calendar.
MSFT earnings for the last quarter are 3.65 USD per share, whereas the estimation was 3.37 USD resulting in a 8.16% surprise. The estimated earnings for the next quarter are 3.65 USD per share. See more details about Microsoft Corp. earnings.
Microsoft Corp. revenue for the last quarter amounts to 76.44 B USD, despite the estimated figure of 73.93 B USD. In the next quarter, revenue is expected to reach 75.38 B USD.
MSFT net income for the last quarter is 27.23 B USD, while the quarter before that showed 25.82 B USD of net income which accounts for 5.46% change. Track more Microsoft Corp. financial stats to get the full picture.
Yes, MSFT dividends are paid quarterly. The last dividend per share was 0.83 USD. As of today, Dividend Yield (TTM)% is 0.67%. Tracking Microsoft Corp. dividends might help you take more informed decisions.
Microsoft Corp. dividend yield was 0.67% in 2025, and payout ratio reached 24.34%. The year before the numbers were 0.67% and 25.42% correspondingly. See high-dividend stocks and find more opportunities for your portfolio.
As of Sep 9, 2025, the company has 228 K employees. See our rating of the largest employees — is Microsoft Corp. on this list?
EBITDA measures a company's operating performance, its growth signifies an improvement in the efficiency of a company. Microsoft Corp. EBITDA is 162.68 B USD, and current EBITDA margin is 57.74%. See more stats in Microsoft Corp. financial statements.
Like other stocks, MSFT shares are traded on stock exchanges, e.g. Nasdaq, Nyse, Euronext, and the easiest way to buy them is through an online stock broker. To do this, you need to open an account and follow a broker's procedures, then start trading. You can trade Microsoft Corp. stock right from TradingView charts — choose your broker and connect to your account.