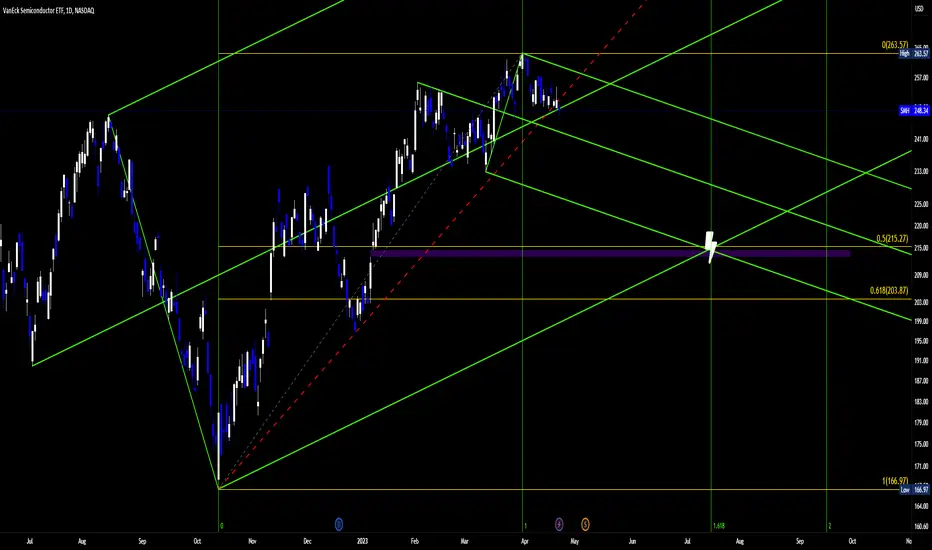
Short the ChipsNASDAQ:SMH
Short the Chips.
Why?
RSI Bearish Swing Rejection
MACD Bear Div
Price broke the ML
Unfilled Gap (212-215)
50% Fib Confluence with Price Gap
1.618 Time Zone
Fib Confluence X Price Gap X Energy Point
Target (Time x Price) = 215 USD on 7/17/23
Fat_Fat
SMH trade ideas
SMH Semiconductors update (weekly) Key areas to watch Semiconductors finally showing some topping pattern, amidst topping RSI (12) that failed to reach the high 70 channel and a shrinking trend of volume. In effect, weakening momentum.
The first level is 244.71, which is a Gann confluence and also a prior pivot (left yellow circle), and is a 7.1% decline off the most recent peak of 263.57. This would take it to the top of the red cloud which could serve as some support.
The second level to watch is 229.18 (right yellow circle) , which is another Gann Confluence, and also a prior pivot, which would be 13.04% off the peak of 263.57. This would take SMH well into the cloud, which could create some future resistance.
Seasonality is at play, so I would expect a rebound in late summer, although there are many factors which could disrupt any projections any farther out and I do not feel worth making now.

SMH BULLISH COUNT STILL NEEDS 269/271 MINI have covered ALL SHORTS TODAY BASED ON this chart I still have a second C wave up to end the double zig zag . I know we have two legs up that are equal to the high but the structure down is corrective and back to 50% I will allow for a last wave up but cycles are running on fumes !!!

Accumulation Manipulation Distribution Ran into this 'AMD' concept on Twitter, never looked at charts as such. Can this NASDAQ:SMH Daily chart play out as such? Does it make sense to indicate Accumulation Manipulation and probable Distribution like this, or do we need more for this (?)
Keeping an eye on it this way is harmless. Let's watch and see how it plays out. Always keep learning.

SMH - LONGI bought some SMH today , S2 uptrend , one of the stronger groups rn. Related stock I may play as well is CRUS too , but has not given me a signal yet / only triggered .

$250 by April 17thThe movement appears to be going towards $250 by the 17th of April and then turning back up gradually for about 2 more weeks before it drops back down to around $225 nearing the end of June beginning of July time frame.

$spy $smh $qqq Bear market bounce?Looks like a very critical point for semi's right here. Failure is not an option.

SMH about to break down?The SMH is triggering a intra day topping formation.
This is likely to play out as money roates out of the overbouhgt tech/ semi space.
NVDA, AMD are some of the leaders already showing weakness today.
If Semis fall they will take this market lower.

Smh (NVDA,AMD) Rejected on yellow trendline resistance.
Sitting right on .236 fib,
Short below 240
Target 226
Should see AMD close gap a 75
And NVDA 208 gap close

SMH (NVDA ,AMD)Do or die for chip sector.
H&Shoulders pattern evident but the right shoulder remains in question... looks like a pennant which on a lower time frame could be bullish. If support is broken Chip will will begin a major correction in which spy most likely will pull back to 380 or lower.
Bulls need a breakout and close above 241.


SMH to $225I believe SMH will complete the AB=CD pattern at $225.
Not financial advice, good luck to all :)

SMH - It's not as bad as you think.....SMH closed today at 234.30, above the Ichimoku Cloud and well above the downtrend channel set from 2022 high to low (grey shaded area). SMH has clearly broken out of this channel, has successfully retested. I see next low at 232.40, which is a Gann confluence line, and then a move back upwards (point D). The reason I see a bounce is that the RSI is approaching oversold on the daily at the confluence line.
Have we broken the bear downtrend? Looks like it to me. In order to resume the bear trend, we would at least need to drop at least to 175 (another Gann Confluence line), which would only take us to approximately the top of the down channel. That would be a 25.6% drop from today's close. If we want to continue the bear trend, then we would need to take out 166.97, the October low, which would be a 28.7% decline from today's close.
Is it possible that we drop another 25 - 28% from here? Of course, anything is possible. However, I don't see it as probable, unless there is a BLACK SWAN event, which no one can predict in any event (by definition). I know that many semi companies have laid off employees, and taken their pill. So future earnings reports may exceed expectations, although product demand remains an uncertainty. But I don't see a 25% drop from here in Semis on organics alone.

SMH (Nvda, Tsm,AMD,)Similar setup as XLK .. pulling back to purple line here . From there we will either bounce or head lower

$SMH inside day with the double inside week. $SMH inside day with the double inside week.
I'm looking for the 2-1-2u with the breakout
Calls over $253.14
Target $255
Puts under $247.55
Target $ 244.58

Smh (Chip sector)The melt up is almost over.
Gapped up to resistance today. Still need to break that yellow uptrend

SOXS play. SMH Short Look at this respect!! SMH tagging long term trend line and pulling back. Also a perfect double bottom on SOXS.

SMH - Semi conductors /Chip sectorMelting up to 231 here; at that point we will either breakout or begin another correction.
So how do you use this sector info to make a trade? First you identify the biggest stocks in the sector (NVDA, TSM).
Secondly , Ask yourself this, "if SMH can move to 231 what will that bullish move do for NVDA"?
Looking at NVDA stock , I see a gap close at 177 that would be my bullish target to match smh move to 231

Opening (IRA): SMH Feb/March 170/154 Short Put LadderComments: My broad market positions are getting a little crowded and busy, so deploying some buying power into some sector ETF's, targeting the <16 delta strike paying around 1% of the strike price in credit.
30-day isn't bad here at 36.3%, but this isn't exactly as weak as it has been, so it's possible that a better entry could be had. Because of that, I'll look to potentially add should better opportunities present themselves.
The goal here is to collect premium and/or to reduce cost basis in shares that you might be eventually assigned and not necessarily to get ideal entries; there is, after all, some "slop"/room to be wrong with these. That being said, being patient and getting paid something decent for a lower strike is always a good thing, since a lower strike means a smaller buying power effect.
February 17th 170: 1.74 credit
March 17th 154: 1.54 credit

Opening (IRA): SMH Feb/March 164/154 Short Put LadderComments: Adding a smidge to my SMH position with two rungs out in February and March, targeting the strikes paying around 1% of the strike price in credit.
February 17th 164: 1.65 credit
March 17th 154: 1.54 credit

VOLUME FLOW: SEMI'S ($SMH) AGAINST THE BROADER MARKET ($SPY)VOLUME FLOW INDEX:
Both $SPY (broader market) and $SMH (semi-conductor industry) are currently in a neutral trend as measured by their 13 Day EMA envelope (top box). Both are also residing in similar places within their longer term downward trends. It is only when we take a look at volume as measured by the Volume Flow Index (VFI) that we can uncover some relative differences that could prove meaningful in the near term.
Volume has yet to breach zero line (white horizontal histogram) to the upside in broader market ($SPY, see left lower box).
Volume has breached the zero line in the semi-conductor sector($SMH, see lower right box), as illustrated by the yellow vertical line. This would indicate good 'force' behind the recent semi-conductor rally as measured by 'volume follow through' which I would consider a measure of 'conviction'.
This could be indicative of a near term preference for the semi's amidst an overall run to defensives in the broader market OR it could just be that semi's are a little bit stickier than the rest of 'growth' and still have some downside wood to chop. Given the semi's association with 'Growth' this divergent volume trend seemed counter-intuitive to the prevailing narrative so I thought I would share.
(Not financial advice)

last stand 2023semiconductors, tech, and the market could make a technical bull case for itself. im not ruling out the shot at a big comeback in 2023. if we turn a sellsided equillibrium to a breakout this is what a weekly reverse head and sgoulders could look like.

October rally ready to resume?If you have been anticipating a resumption in the October rally, this may be the trigger. The SMH/SOX is the (I believe) the last of the major indicies to still have a gap left unfilled. If it closes today (or this week), then maybe we can get going to the upside. Some resource stocks have already started their ascent (GDX, SILJ, UUUU, UEC, NXE, etc.)
