How would you trade this chart in the next 13 weeks?Before answering the question please read this quote:
“We know the past but cannot control it. We control the future but cannot know it.”
(Claude Shannon)
Claude Shannon's quote "We know the past but cannot control it. We control the future but cannot know it" is a profound statement about the nature of time and our relationship to it.
The past is fixed and immutable. We can learn from it, but we cannot change it. The future, on the other hand, is open-ended and uncertain. We can make plans and take action, but we cannot know for sure what will happen.
This duality between the past and the future can be seen in many aspects of our lives. For example, we can learn from the mistakes of the past, but we cannot change those mistakes. We can make plans for the future, but we cannot know for sure if those plans will come to fruition.
Shannon's quote is a reminder that we are limited in our ability to control both the past and the future. However, it also suggests that we can still learn and grow from both. By understanding the past, we can make better choices in the future. And by taking action in the present, we can shape the future in our own way.
Here are some of the implications of Shannon's quote:
We should not dwell on the past, as we cannot change it. Instead, we should learn from it and move on.
We should not be afraid of the future, as we cannot know it. Instead, we should make plans and take action to shape the future in our own way.
We should live in the present moment, as this is the only time we have any control over it.
I will provide my answer soon!
thinking about this chart will give you the opportunity to find solutions to deal with uncertain situations!
Trade ideas

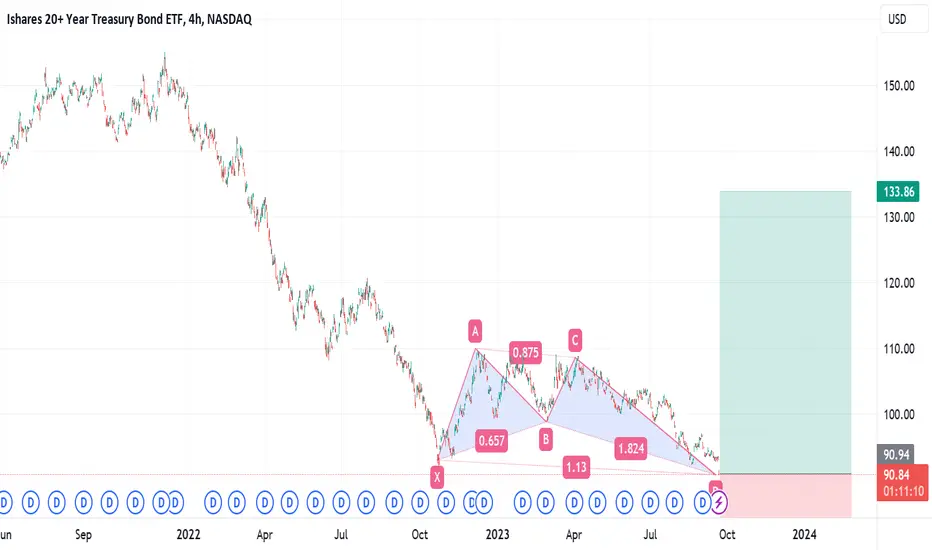
Reverse Triangle (ABCD) set up, D leg of the bullish CypherLooking at the Monthly Chart of the TLT 20yr bond etf. I see a large ABCD Pattern Set up. The Initial Triangle has not completed. Currently there is heavy selling in Bonds (C leg sell off to D leg of the bullish cypher) The Trend Line was breached, and now the sell off is acting like a Magnet to retest 2008 lows.
It's worth noting this sell off appears to be A bullish Cypher pattern set up Around D leg. This set up is also tie to the USA real estate market. Based on the 18 year real estate theory, we're only 13 years removed from the 2009 financial market lows. Also based on the 18yr real estate theory, I see a project crash around 2027-2028. Which is likely due to a property tax crisis.
At the bottom of the chart you'll see the Stochastic has already bottom, however the AD is still in overbought territory. You want to be buying when both the AD and the stoch are bottom together like in 2008-2009 (see white box).. Dollar cost averaging into the 20yr bond etf is not a bad idea either. With Bond yields currently over 4% and likely to reach 6%-7% before the TLT finally bottoms is a good hedge. I also like the fact in the future, I can write cover calls against this position, which will lower my cost basis even more in the future.
I'm not looking to short bonds here, i'm a long term buyer of the dips with a breach of $90... price action could take this below $84, possible $78 but $84 is my target based on the last recession in 2008. Dollar Cost Avg for the win long term for the next 20yrs


TLT it's the thing that gets the thing to another thing... where it all begins and ends ... Rinse and Repeat forever

TLT: waiting a long time. Is it time to buy?One more Fed hike this year and after that bond market will hopefully settle down. When rate cuts start to happen, stock market will most like take a nosedive and a better home for the capital will he right here at TLT. In between now and then I am planning to start accumulating little bit at time bottom fishing some lows, but not too much. TLT is dangerously close to getting bottom fall off. Below about $80.5, it may tank another 30%. So little bit here and there is the way to go right now with options hedge. Fed might keep hiking to infinity destroying US economy and bonds along the way. TLT will not be a good place in that case...
Technical areas: right now will look for a bounce to $ 95- $97. Above $99 there is a good change that the low is in. Otherwise will look for one more lower low to between $87 - $85 area. That is when I will put some more capital in. Below $80 it is game over, sell all, wait and see.

Opening (IRA): TLT November 3rd 88 Short Put... for an .88 credit.
Comments: Targeting the strike paying around 1% of the strike price in credit in the shortest duration contract around 45 days until expiration, looking to pick up shares via assignment in this general area of weakness.

TLTWeekly is teetering on closing in oversold territory again, which is NOT bullish. Last time RSI closed below 30 (blue arrows), price declined the next 5 weeks in a row (aka interest rates rose 5 weeks in a row). Still a few hours left in the week but I won't be holding my breath for a meaningful reversal before the close.

Bullish butterfly in TLT Have a friend who's been asking me for 6 months if it's a good time to go long bonds and consistently I've said it looks early.
But if there's going to be a time to go long bonds, I think now is the time. Stops a bit under the current lows
Opening (IRA): TLT November 17th 90 Short Put... for a .95 credit.
Comments: Squeezing in a short put in the November expiry at the 90 strike. Here, I'm actually looking to pick up shares, so am being more aggressive than I would ordinarily be, with the 90 camped out at the 27 delta.

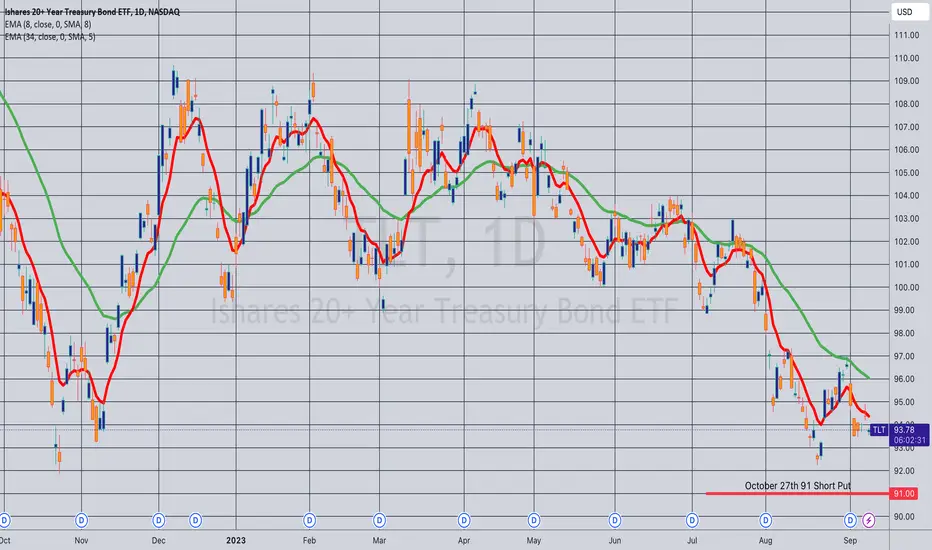
Opening (IRA): TLT October 27th 91 Short Put... for a .96 credit.
Comments: Adding on weakness, targeting the strike paying around 1% of the strike price in credit in the contract nearest 45 days duration.
This is more aggressive than I usually do, since it's at the 30 delta, but I'm looking to pick up shares at or around these lows if at all possible. Because of this, I'll look to run these right up until expiry and/or take them off for "approaching worthless"; I immediately stuck an order in to close it if it gets to .05.
If I get assigned, I'll look to cover with short call.
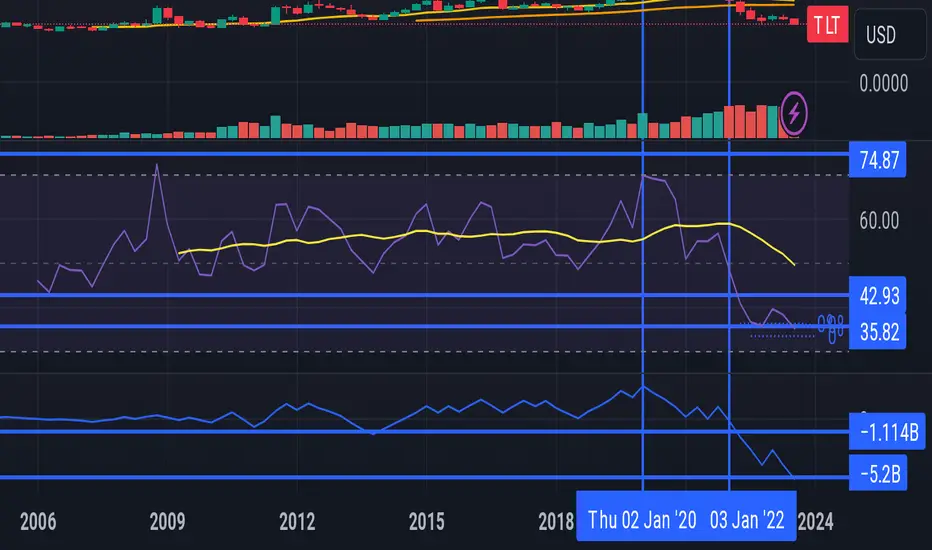
Is TLT a buy or a sell here?In 18 years RSI and OBV have not been this low. RSI around 35 and OBV negative 5 billion. That's 4 times lower than the normal lowest figure. Something happened after January 2022. A war started. A capital war? After the peak in January 2020 it's been all downhill since then. Will RSI and OBV find support here? Where is the bottom? Does the 40 year bull market in bonds end with a whimper or does it go out with a bang? Are there some things that people should not worry about? Can you have yeilds going up like they have and at the same time a fiscal deficit that seems to be out of control? If the world's safest asset isn't safe what is? If bonds are this volatile can they fulfill their purpose? If one person's debt is another person's asset shouldn't it adhere to the principles laid out by Aristotle 2000 years ago? Who wants an asset when it's value cannot be guaranteed? Don't worry be happy! Avoid TLT until these indicators start to reverse and at least show some signs of improvement. Maybe the US election result will give us the required direction. Until then I remain unconvinced.
BEAR STEEPENER - Where's "Tin Cup" is that you Mr J. Powell?Fed wont (can't) cut rates as we go into a recession as has been the case for a very long time (since 1974 - Volker). This is one of those cases where past performance does not equal future results and you who drives a car by looking in the rear view mirror anyway unless your backing up. Unless you have a time machine, one must look forward and ween themselves off of technical overreliance. What's different you might ask? Unless you spent all of your time just drawing lines on charts, you should know that the USA is over its capacity for sustaining its hegemony and budget as a going concern (www.cbo.gov). Just the interest expense alone, at more than a trillion, speaks for itself (See chapter one of cbo link above Net interest status que projection). This is where historically empires lose their hegemony and Fed is desperate to break the human habit of self destruction while a irrefutably and factually corrupt US democrat controlled Government seem hell-bent on forcing fiscal policy spend for what is apparently their own interests in concert with China and Japan forcing the Fed to "pause" or otherwise have to "quantitatively tighten" (Seell bonds from thier balance sheet effectively draining the system of liquidity) to an order of magnitude placing the system in a more precarious state as R-STAR (Natural rate of interest) is unmeasurable since markets are not free to govern themselves for so long (40 years) price discovery is akin to "shooting in the dark" (One cannot measure with out a point of reference), they can only estimate and an overshoot is an even bigger risk than not doing anything at all (it takes a 100% return to break even from a 50% loss, thus a quantum's amplitude is quadratic and without an absolute value consensus for R-STAR, a small difference in Feds measure could mean a huge difference in outcome probability. In other words, put on a blind fold and walk through a mine field slowly throwing rocks or using mine detector or some form of mitigation while holding an alarm clock in your hand that when it goes off will detonate all mines (systemic implosion "systemic risk"). That is what the Fed is up against while facing internal and external challenges (Democrat's, China, Japan YCC (yield curve control policy change due to new governor and political regime ,basically Japan Democrats), thus the "pause." It's hard enough to shoot in the dark when you have head winds blowing from different directions metaphorically speaking. Or, a golfer facing windy conditions, especially headwinds,, is to swing normal or even slightly slower speed. This is the only measure the Fed can do while up against the national debt clock. The greater the Debt the more time dilates the greater the potential for error. Bottom line Fed has to force a recession as stated in their base case scenario. www.federalreserve.gov and www.federalreserve.gov
The Fed secretly hopes for a "black Swan" event to do the work for them and this is a good bet because never has there been so many tail risks stacked up where the bell curve is the tail risks!!!! Geopolitical being the greatest likely potential. Buckle up kiddos its going to get UGLY!!!!!
Back to the Golf analogy, where is "Tin Cup" when you need him? lol www.youtube.com

Treasuries on track to crash Sept-Dec 2023Reminds me of the Final Destination movies - the unsuspecting characters live their peaceful lives, while the invisible hairy hand of the market is meticulously preparing every instrument for a kill.
Treasury yields are scheduled for a big bang this fall, but it will not end in 2023. I think yields will continue to rise into Jan and Feb.
SPX will keep falling all that time. We may see markets bounce a little in the spring 2024. The transition from "low yields forever", to TNX above 10%, will cause an unimaginable amount of pain across the globe.

#TLT Trading The CorrectionIn this update we review the recent price action in the TLT ETF and identify the next high probability trading opportunity and price objectives to target
PAST PERFORMANCE NOT INDICATIVE OF FUTURE RESULTS

TLTNot quiet here yet, but there appears to be a massive setup forming in TLT. Massive bearish divergence (not the chart is inverted as is the RSI).
Michael

TLT - Potential targets to the downsideAs yields persistently keep rising in the US, TLT potentially targets 88 and maybe even 81 to the downside. Both levels are long term horizontal levels of support.

$TLT ETF Double Bottom Weekly ChartThe TLT ETF appears to have formed a potential short-term bottom, characterized by a double bottom pattern on the weekly chart. The iShares 20+ Year Treasury Bond ETF (TLT) is an exchange-traded fund that seeks to track the performance of the ICE U.S. Treasury 20+ Year Bond Index. This ETF focuses on providing investors with exposure to long-term U.S. government bonds.

#TLT Testing Pivotal SupportIn this update we review the recent price action in the TLT ETF and identify the next high probability trading opportunity and price objectives to target
*Past performance not indicative of future results

$TLT Long or short?Last week, the bond markets were a bit volatile, and the US10Y broke below the support ~98. Fitch Downgrade, JP govt selling US treasuries were other catalysts. The US CPI (Y/Y) Jul: 3.2% (est 3.3%; prev 3.0%) also showed inflation easing ...
So, what do you expect?
Case (a) false breakdown, and bonds rallying in the coming months?
or
(b) inflation surprises on the upside for the later half of 2023 would further add to the bond market selling and hence higher yields?

TLTTLT was a 3:1 compression ratio which was broken. It is now a 2:1 ratio which I believe is still tradable to the upside if broken.
TLT - Successful Three Week Test of the LowTLT tests the closing low of three weeks ago. This used to be a pretty reliable indicator and a buy signal for me. Took a pilot position at 99.80. Stocks appear to be overextended so any selloff might cause a move to bonds.

TLT, PFIX lightFeeling that this along with the gap to be filling in TLT means we are going to have lower CPI and PPI. TLT targeting 89, care of TLT gap PFIX shines a light.
PFIX is the only bond like security that has clarity in trades

Yields Prepped to Spike Higher after a Confirmed TLT BreakdownThe TLT has broken down an Ascending Broadening Wedge and given us one Bearish Confirmation back test; now we are looking for a second lower high within the range of the breakdown to truly get convicted on the move. However, for the time being, I do think this chart should be watched, as I have a suspicion that a lot of the shorter- and midterm bond yields are going to spike higher along with the US Dollar for reasons I already explained in this post here:
