BTC.D ANALYSISBTC.D has been falling in recent days, while BTC stabilizes above level 102000 leading to Altcoins to get into new upward momentum, seems that the market dominance will keep in a downtrend for a while, that is if it breaks its current level let's keep watch
Trade ideas

Once againHere we go a battle of the 20mma
Gains below this line
Pain above it.
Only good thing right now Others Dominance looking like some at the moment…

Bitcoin Dominance Rejection and Altcoin Pump👋🏻 Hey everyone! Hope you’re doing great! Welcome to SatoshiFrame channel.
✨ Today we’re diving into the 1-Day Bitcoin Dominance analysis. Stay tuned and follow along!
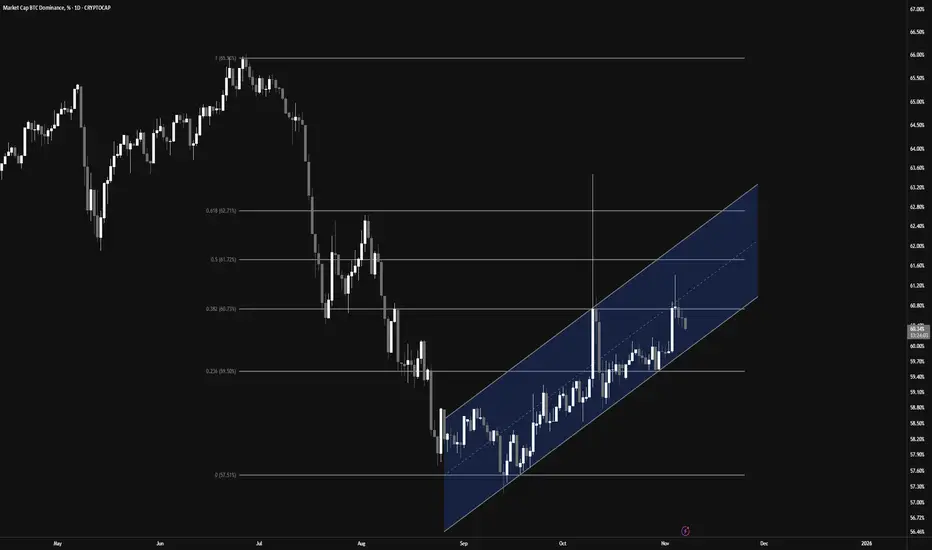
👀 On the daily timeframe, Bitcoin dominance has reached a key resistance zone at 60.73%. If this level breaks, we could see a deeper correction across altcoins. However, a rejection and move downward could trigger a strong rally for altcoins. As Bitcoin’s market weight decreases and capital flows into altcoins, we might be entering an early altseason, presenting potential profit opportunities.
🕯 From a technical perspective, Bitcoin dominance is moving within a well-structured ascending channel. The midline of the channel acts as a solid rejection point. A Fibonacci retracement from the previous downtrend shows a 38% overlap with this midline — a tough level to break. After a strong bearish candle rejection from that area, dominance is now heading lower. If the move continues, we could see a test of the channel’s lower boundary, and a confirmed breakdown would strengthen the altcoin bullish scenario.
💰 Typically, capital rotation in crypto follows this pattern: money flows into Bitcoin, then Ethereum, then the top 10 coins, and finally into smaller altcoins — before converting to USDT and exiting the market. With Bitcoin dominance currently at high levels after a solid Bitcoin season, this could signal the early stages of capital shifting toward altcoins. Traders should watch closely for these shifts to maximize profitability.
❤️ Disclaimer : This analysis is purely based on my personal opinion and I only trade if the stated triggers are activated .
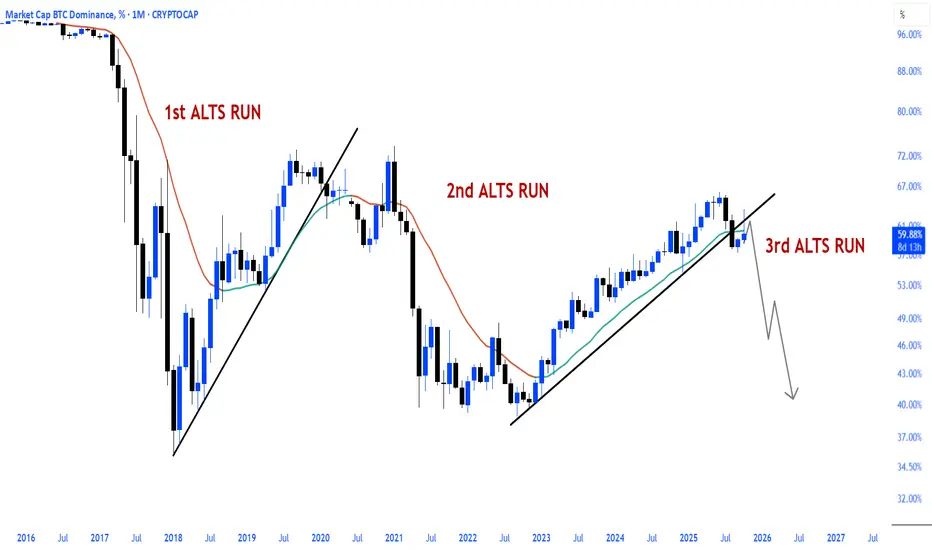
BTC DOMINANCE Final phase of my analysis.
If this high at 60-62% stays here then this high will be the right shoulder.
Anything above will invalidate this idea.
A weekly hns is massive for downside.
So 44% still on table in the overall channel.
Lets see how this plays out nove-dec-jan
Btc should start going up also.

BTC.D and altseason until the end of 2025BTC.D will refuse to show a significant fall in 2025. First week of 2026 is the beginning of altseason preview. It will end in March.
Currently BTC.D is #overbought and relief bounce in alts is imminent lasting for a couple of weeks with suddent reversal.

BTC Dominance Analysis (1D)It seems that wave G is not yet complete because its time frame hasn’t fully played out, and the upward momentum is strong enough that with a little pause, it could move toward higher zones to complete wave G.
A key area has been marked on the chart; if it gets breached, this index could experience a deep drop.
The chart is a bit complex, and for now, this is our view on Bitcoin dominance.
Let’s see what happens.
For risk management, please don't forget stop loss and capital management
When we reach the first target, save some profit and then change the stop to entry
Comment if you have any questions
Thank You

BTC.D May not TOP until next September!Despite alt/BTC pairs looking battered
**Capitulation is likely not complete**
Most Altcoins remain in downtrends v BTC
Timeline:
2025: grind to 63-65%
2026 Final Push to 73%?
Altcoins to seek relief once this finally turns around.
You may be able to start DCA'ing BTC as early as next March in preparation to buy beaten down quality Alts...
focusing on ETH, SOL, and 2's that have usage... not simply clogging up the landscape of empty chains.
BTC.D wyckoff accumation playing outBeen monitoring this for 2,5 years. BTC.D is aiming at 73% after backtesting 53%. Implosion of non-BTC crypto.

BTC DominanceBitcoin Dominance gives up 1 year after each halving. You should accumulate altcoin as long as Bitcoin dominance is above 50%.

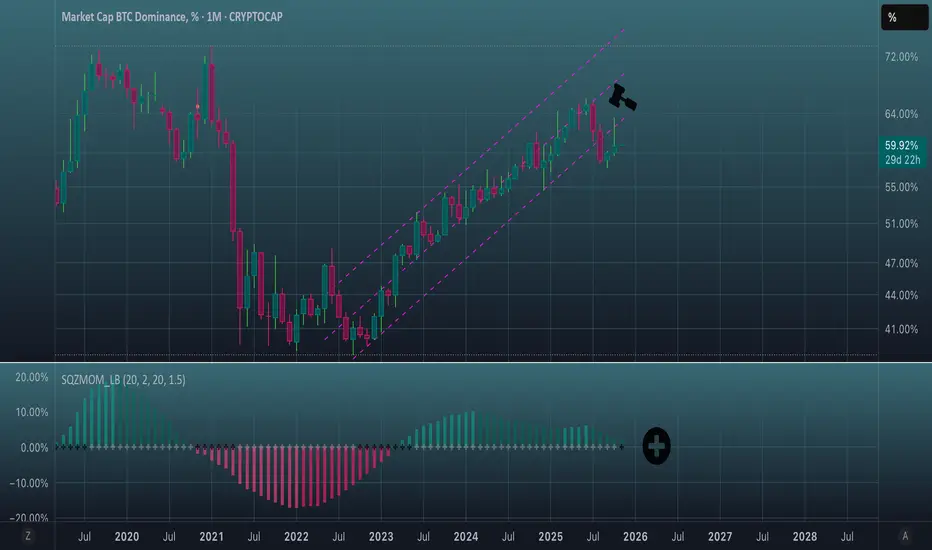
A beautiful picture.The channel breakout was completed.
An aggressive retest of the channel was completed.
SQZMOM implemented a black cross, indicating that a bearish squeeze has begun.
Now it's been months.
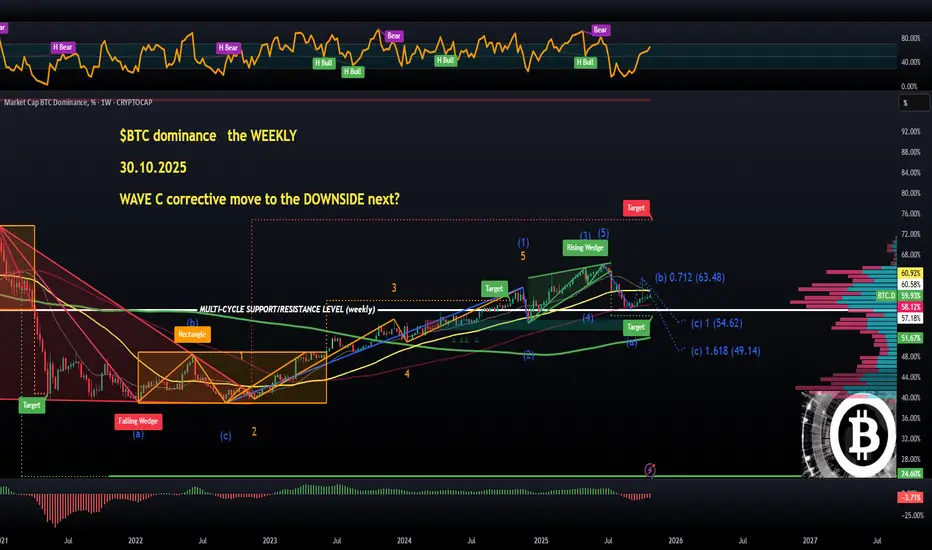
$BTC dominance (WEEKLY): WAVE C to the DOWNSIDE next?One of the last bits of hopium that still makes sense from a technical perspective is this WEEKLY CRYPTOCAP:BTC Dominance chart, which shows a clean Elliott Wave structure.
Based on this count, the dominance either has completed, or is currently in the middle of a dead cat bounce (WAVE B) — which briefly peaked around 63.5% during the 10/10 market collapse.
If that’s correct, the next move should be a WAVE1 C down, targeting a deeper correction toward 54.6% or even 49.1%.
This outlook perfectly aligns with the expected #Altseason which typically kicks in during Q4. As long as BTC.D remains below the yellow 50 MA, the trend stays bearish — with a lower low already printed and a lower high likely forming.
Being a strong believer in both Elliott Wave Theory and the cyclical nature of markets, I’ll continue buying dips — since several altcoins are likely to see powerful rebounds from key support zones.
That’s my main strategy for Q4.
👽💙
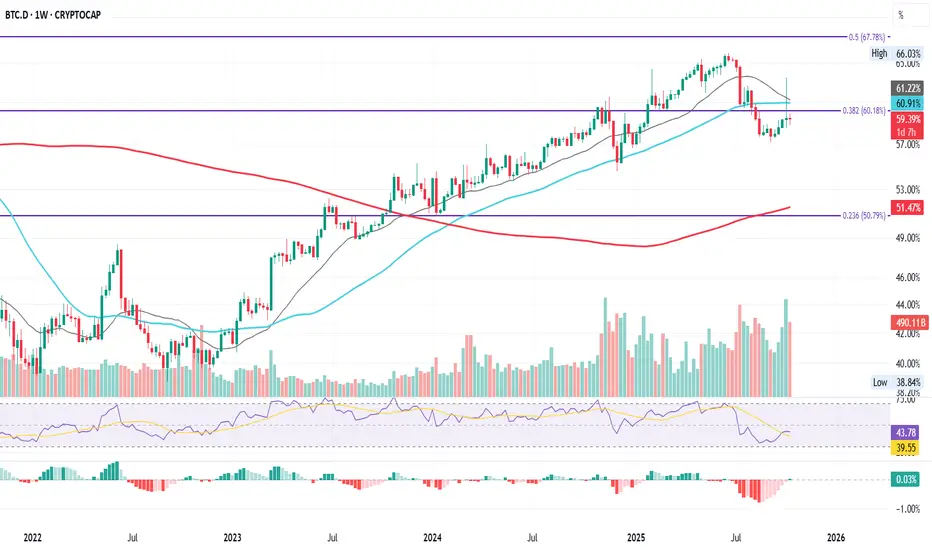
BTC.D Weekly Series – Tracking the 60% level , Week by Week
This is BTC Dominance (BTC.D) on the weekly.
After climbing steadily since January 2023, BTC.D followed both the 21-week (grey) and 50-week (cyan) MAs all the way up, reclaiming key Fibonacci levels at 50% (0.236 Fib) and 60% (0.382 Fib) before finally getting rejected at the 0.5 Fib near 67%.
That rejection in June 2025 marked a structural shift: BTC.D dropped below the 21W and 50W MAs, and back under the 0.382 Fib (60%).
Last week’s flash recovery briefly spiked above these levels, but failed to hold, closing back under.
This week’s candle is confirming that weakness again.
Until the 0.382 Fib turns into solid support, dominance remains technically in a downtrend: meaning capital might be slowly rotating away from BTC toward ETH and large-cap alts.
For traders, this level defines the next phase:
Hold above 60% → BTC continues to dominate.
Break lower → rotation and volatility spread wider across the market.
Either way, BTC.D is the map, and this chart is worth watching closely in the coming weeks.
Bias: Bearish-to-neutral short term, trend losing momentum while capital flow diversifies.
Always take profits and manage risk.
Interaction is welcome.
Alt Coin SeasonAlt season has not started yet. Probably it is about to start.
The red lines mark important 2021 support levels for BTC dominance (Blue line).
Purple line is the alt coin dominance.
Black line is the BTC price in USD.
It would be easy to jump to the conclusion that ALT coin season is starting, upon this chart, because the critical support level on BTC Dominance, from 2021, has been broken. Nevertheless a warning:
Warning: Alt coin season truly depends on BTC price going up. If BTC price drops marking the end of the cycle, so it is for Alt coins too. It would be over. Therefore, one must keep a careful eye on BTC/USD price action, to ensure not to fall into a bull trap!
FED cut rates impact: I expect Sept. 17th, to be bearish on the FED cutting rates, for a short time. This would be a "Buy the rumors, sell the news" type of event. I think, but I may be wrong of course.
However, in the middle term (Oct-December) it wold mark the last bull run of this cycle, for everyone, alts and BTC, hopefully.
Disclaimer: this is not a financial advice. Do your own research. I own several cryptocurrencies and this idea and plot represents only my mere opinion. I hold no responsibilities for misinterpretations from this material.

It will be shortsIt seems that btc.d is in its final stages and we should be prepared for a small Alt Season.
Trade according to your strategy

20day mmaThis battle line has been standing the test of end of 24 and all of 25
Once we get a good break below and continue downwards you know what time it is Until then relax and accumulate your fav alts.

History Repeats? BTC Dominance Rejected at the Same Zone AgainBTC Dominance is currently facing rejection from the key resistance zone after multiple failed attempts to break above it.
If it continues to struggle here and fails to reclaim the upper zone, a potential drop could follow — which might give altcoins some room to breathe and rally.
Keep an eye on how dominance reacts here; this zone has historically triggered major trend shifts across the market.
DYOR, NFA
Thanks for reading! Appreciate your support and engagement 🙏

The Calm Before the Altcoin Storm #BTC DominanceSomething big is brewing in the charts... 💣
BTC Dominance looks tired — the structure is breaking down, momentum fading, and it’s screaming “altseason loading…”
We’ve seen this setup before: dominance starts to roll over, and suddenly the market goes wild — altcoins explode one after another.
If this breakdown confirms, we’re not just looking at a small shift…
We’re talking about a massive ALT PARTY, where the real profits start flying.
The smart money is already rotating — don’t be the last one at the dance floor.
Altcoin season is closer than you think.
Keep an eye... and just see.
If you feel the same vibes — share it and let’s get ready for the storm together.
#BTC.D #BTC #BTCDominance #Altseason #Altcoins #Crypto #MarketShift #Bullish #AltParty

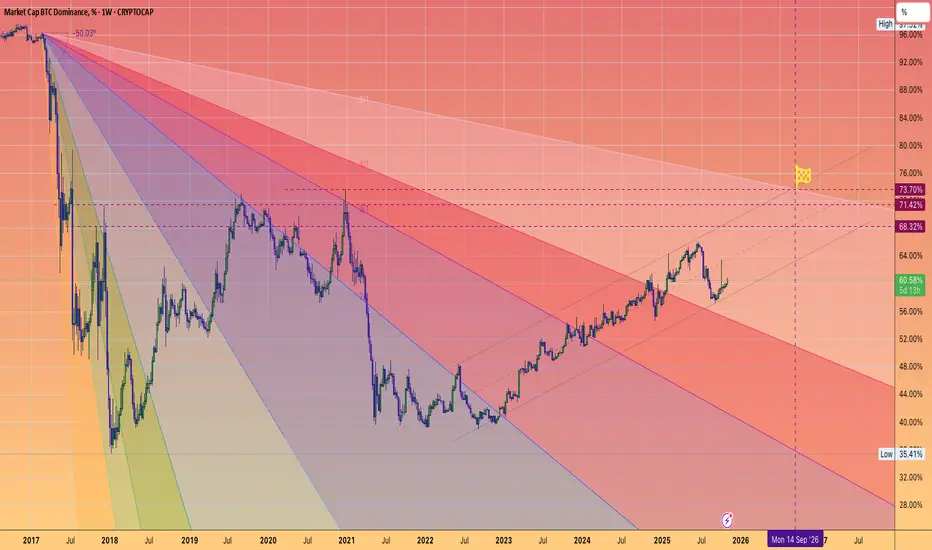
Bitcoin Dominance Signals Major Alt Season AheadAfter months of Bitcoin's relentless dominance over the cryptocurrency market, I'm seeing clear technical signals that suggest we're on the brink of a massive shift. As someone who has been tracking Bitcoin dominance patterns from Dubai's bustling financial district, I can tell you that what's happening right now looks eerily similar to the setups we saw before the explosive altcoin rallies of 2017 and 2021.
Let me break down what I'm seeing in the charts that has me convinced we're headed for what I call "Alt Season 2025."
For the past several cycles, I've tracked a predictable rhythm in Bitcoin's market share. We get these extended "BTC Seasons" where Bitcoin soaks up most of the incoming crypto capital, followed by dramatic reversals where money floods into alternative cryptocurrencies. The numbers don't lie—and they're telling a compelling story right now.
My Historical Analysis Reveals Diminishing Returns
Here's what caught my attention: In 2017, when the first major alt season hit, Bitcoin dominance crashed by a staggering 42.93%. Fast forward to 2021, and we saw another dramatic rotation, but this time the drop was smaller at 32.29%.
Now, based on the technical setup I'm seeing, I'm projecting the next alt season will deliver a 22.35% decline in Bitcoin dominance. The pattern is clear—each cycle sees diminishing magnitude, the same theory I've explained in detail here
but the rotations are still significant enough to create life-changing opportunities in the altcoin space.
What I find most intriguing about the current market structure is what I've dubbed the "Bear Trap Zone"—a critical resistance level that Bitcoin dominance keeps testing but can't seem to break through convincingly.
I call it a bear trap because it lures traders into thinking altcoins are finished, that Bitcoin will continue its dominance indefinitely or the bull run is finished. But history shows us that when dominance reaches this zone, it's actually setting up for a major reversal. We're testing that zone right now.
Technical Indicators Are Flashing Warning Signs.
The momentum indicators I rely on are painting a clear picture. The RSI is showing what we call bearish divergence—while Bitcoin dominance has been grinding higher, the underlying momentum has been weakening. This is textbook behavior before major trend reversals.
The MACD, another key indicator I watch, is consolidating near zero with declining volume. To me, this screams "calm before the storm." The market is coiling up for something big.
My Structural Analysis Points to Imminent Breakout
From a structural perspective, I've identified a long-term ascending wedge pattern that's been containing Bitcoin dominance since 2018. While this has provided support during bear markets, these wedge patterns typically resolve with sharp breakouts—and based on the momentum divergence I'm seeing, I expect this breakout to be to the downside.
The beauty of this setup is that even as we expect dominance to fall, the overall trend shows each cycle's low is higher than the last. This tells me the crypto market is maturing, but the rotation opportunities remain substantial.
What This Means for Investors
If my analysis proves correct, we're potentially weeks or months away from one of those rare periods where altcoins dramatically outperform Bitcoin. These don't happen often—maybe once every 3-4 years—but when they do, the moves can be spectacular.
I'm not saying Bitcoin is going to crash. What I'm suggesting is that money is likely to rotate from Bitcoin into Ethereum and then into top few big and then into alternative cryptocurrencies, creating opportunities for those positioned correctly.
The Dubai Perspective on Global Crypto Markets
From my vantage point in Dubai, where we're seeing unprecedented institutional interest and regulatory clarity, the infrastructure is in place for a major capital rotation. The Middle East has become a crypto hub, and the smart money here is already positioning for this potential shift.
My Bottom Line Prediction
Based on everything I'm seeing—the technical patterns, the momentum divergence, and the historical precedent—I believe we're in the final stages of this Bitcoin dominance cycle. My projection shows Bitcoin dominance dropping from current levels to test long-term support, potentially creating the conditions for "Alt Season 2025."
The question isn't whether this rotation will happen—based on the patterns I track, it's inevitable. The question is timing, and right now, all my indicators are suggesting that timing could be sooner than most expect.
SAM.
Support my work! 👋 If you're finding these technical analyses helpful and interesting, please:
✅ Follow my account for regular market insights
❤️ Like this post
💬 Share your thoughts in the comments
Every follow, like, and comment motivates me to dig deeper into the charts and deliver even more valuable analysis to our growing community. Let's grow together! 🚀

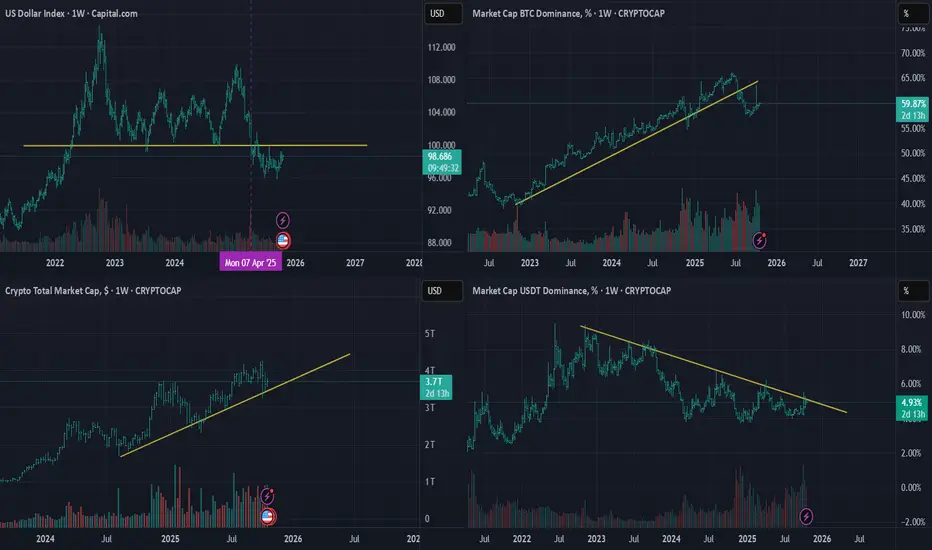
USD Index, BTC Domination, Crypto Total Market USDT Domination Hi everyone,
I just noticed a rare and exciting opportunity — the global market indexes are currently in sync in favor of altcoins.
All the charts are lining up perfectly, and to me, this looks like one of the best times to enter the market or add to your existing positions.
Wishing you all the best! :)
BTC.DBTC Dominance – Update & Outlook
Summary:
After the channel breakdown, BTC.D dropped to the 57% area. Price action now appears to be carving a smaller parallel structure within the prior trend and is shaping into a bearish flag.
Key Zones (red boxes on chart):
These are overhead supply/resistance. A rejection from these zones would keep the bearish-flag thesis intact.
Scenario:
If rejection confirms, BTC dominance could follow the white path toward the green trendline, targeting the 49–50% area. This is a medium-to-long term view and needs time and patience.
Notes:
This is my personal market analysis, not financial advice. Always DYOR and manage risk.

$BTC.D down $BTC up : ALTS run.CRYPTOCAP:BTC.D down CRYPTOCAP:BTC up : ALTS run.
Bitcoin dominance has broken down from its major uptrend and is currently in a retest.
It's important to remember that dominance alone isn't an altseason indicator; the key is for dominance to decline alongside Bitcoin's rise.
When this scenario plays out, a healthy altcoin season, as seen in the past, will resume.
So why did Altseason start in 2017 when BTC was falling?
1. Capital Rotation from Bitcoin to Altcoins
When Bitcoin approached $20,000 at the end of 2017, investors fell into the mindset that "BTC has risen too much, altcoins are cheaper."
Those who realized their profits sold Bitcoin and moved to altcoins.
So money didn't leave the market — it just changed direction within it.
That's why altcoins soared even as BTC fell.
2. New investor influx and FOMO
New investors entering crypto at that time turned to coins like Ethereum, Ripple, IOTA, ADA, and NEO, saying "Bitcoin is expensive."
New money flowed directly into altcoins.
So even as Bitcoin fell, the total market value continued to grow.
3. The historic collapse of dominance
BTC dominance fell from 65% in December 2017 to 35% in January 2018.
This was the sharpest "altcoin rotation" in history.
In short, everyone was "dumping their BTC profits into altcoins."
4. The ICO boom
Thousands of new projects were issuing ERC-20 tokens.
Demand for Ethereum skyrocketed because everyone was participating in ICOs with ETH.
This accelerated the shift from BTC to ETH and ignited the altcoin bull run.
5. Liquidity staying in the market
The stablecoin ecosystem was not yet developed (USDT was limited).
So when investors wanted to take profits, they were fleeing to altcoins instead of cashing out to fiat.
This caused altcoins to shine.
BTC.Dwho's ready to see alts die even more! As a trader you knew this weekly candle would fill - right?
of course it closed bullish not bearish.
it needs to fill and grab more liquidity - scare retail to sell sell sell!
well this play is happening again and I figured the rejection from that mid zone around 57% was going to happen....
Now the biggest thing here is volume stops around 66% and that's where i see this reversing to the downside.
But the sad part is i don't see it happening 2025. So 2026 early should be it if everything works out to plan! if not then just wait cause there is not cycle without rotation - euphoria or retail liquidity.

Rising Broadening Wedge BreakdownBTC.D broke down from a two and a half year long rising broadening wedge pattern on high volume. The re-test flushed out leverage traders and low caps (including equities) are now ready to perform better than high caps, at least as long as BTC.D keeps falling. Let's use the fear and make good gains in the coming weeks/months. Just give it a little bit time. Timing + Patience = Key!
