BTC Dominance — The Midrange Barrier Before the Next Altseason## 🧭 Structural Analysis of Bitcoin Dominance (BTC.D)
Based on Bitcoin’s historical price behavior, the current market structure shows a strong resemblance between the **2017–2021** cycle and the ongoing **2024–2026** cycle.
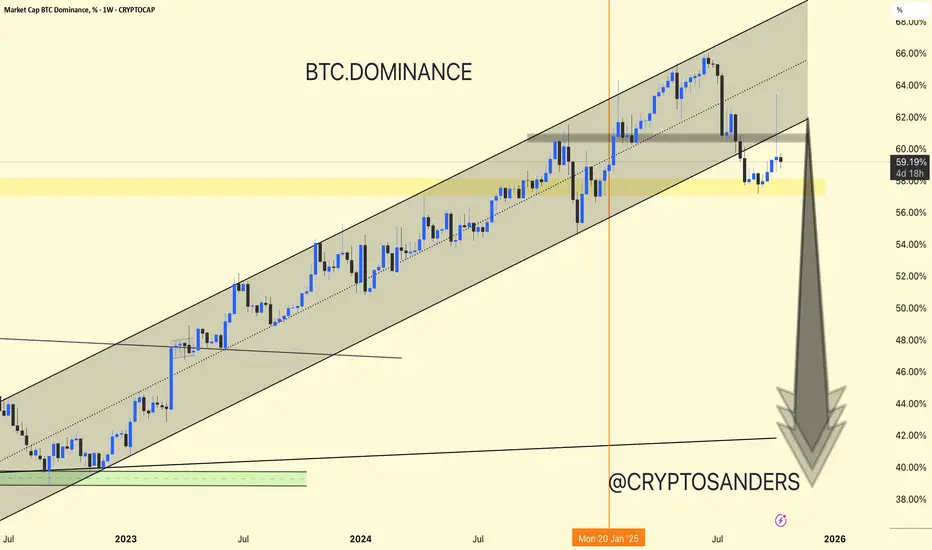
The main reason why BTC Dominance has been unable to break below the **57.35%** level over the past month (September and October) is because this zone represents the **mid-range pivot line** within the broader historical range:
> 🔹 **Range High:** 79.29%
> 🔹 **Range Low:** 35.41%
This midpoint acts as a *structural pivot* for BTC Dominance — a zone that consistently triggers reactions:
* When dominance moves **from below to above**, it tends to **reject downward**.
* When it moves **from above to below**, it often **bounces upward**.
Therefore, breaking or reclaiming this line is never simple.
It usually requires:
* A **sideways accumulation phase above it** before a confirmed breakdown, or
* A **sideways distribution phase below it** before a confirmed breakout.
This exact structural behavior is what we’re currently observing on the chart.
---
## 🕰️ Historical and Temporal Context
After reviewing BTC Dominance from **2017 through 2021**, we can clearly see that the current cycle is replicating the same behavioral rhythm.
Hence, it’s very likely that BTC Dominance will **continue consolidating sideways** between **57.5% and 66.5%** until around **April 2026**, which historically aligns with the **breakdown phase** that preceded the major *Altseason* in the previous cycle.
---
## 🎯 Potential Targets After Breakdown
If BTC Dominance repeats its historical behavior and eventually breaks below the pivot zone, the next logical support targets would be:
> 🥇 **Target 1:** 50.60%
> 🥈 **Target 2:** 45.60–45.70%
Once these levels are reached, we could see a strong capital rotation into altcoins, potentially driving
the **Total 3 Market Cap** (all altcoins excluding the top 10) toward **$1.5T – $2T**.
---
## 💬 Conclusion
BTC Dominance is currently sitting on a **critical historical pivot**, mirroring the 2020 structure right before the Altseason rally.
The most probable scenario is continued sideways consolidation until **April 2026**, followed by a potential breakdown and a shift of liquidity into the broader altcoin market.
---
### ⚠️ **Disclaimer**
This analysis is for **educational and informational purposes only**.
It does **not constitute financial advice, investment recommendation, or trading signal**.
All opinions expressed here reflect my **personal market perspective** and may be subject to change without notice.
Trading and investing in financial markets involve **significant risk**, and you should **conduct your own research** or consult a licensed financial advisor before making any investment decisions.
I also used **ChatGPT** only to help organize and refine the text for clarity — all analysis and conclusions are my own.
Trade ideas

$BTC.D Death Cross Has Occurred! The Signal on ₿itcoin Dominance We've Been Waiting All Cycle For 🔥
20 / 50 WMA Death Cross has officially occurred on CRYPTOCAP:BTC.D
So close to Alt Season I can taste it 😋

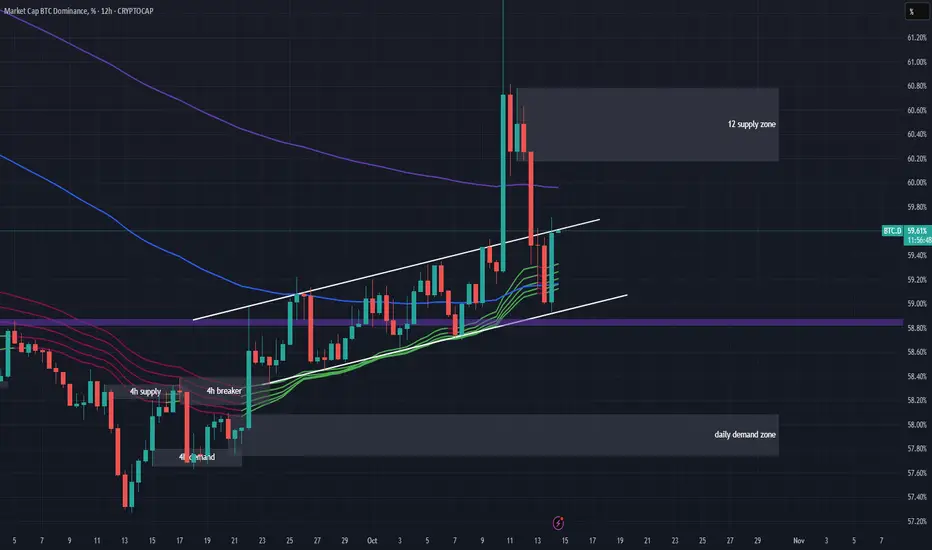
#BTC.D 4H ChartBitcoin dominance is still ranging in a rising channel and currently retesting the resistance line. It needs to break through it in order to expect further bullish movements towards the 12h supply at 60.2%.

Rabbit Season...Duck Season...Rabbit Season...ALT SeasonCRYPTOCAP:OTHERS - It has been a slippery slope throughout the crypto market and players continue to get bled out, and for good reason. But is there hope for an alt season?
I've decided take a deeper dive into more technical charts to try and find more clues that could suggest when and if that time will come. So, I've found that the BTC.D/TOTAL ratio chart is quite handy, and is one of my favorite charts in determining alt coin strength. Similar to USDT.D, it moves in inverse correlation to the market but with less noise. It also has a unique ability to distinguish between market distribution and accumulation, being that when significant market accumulation starts, there are drops to the down side in the BTC.D/TOTAL chart. The chart also seems to mimic a Wyckoff Accumaltion schematic during market accumulation events, but only to eventually print to the down side when significant support is broke, instead of a traditional rally up after accumulation.
In the published chart, you can see where our last significant support structure was broke, only to be regained by the recent shenanigans. According to previous cycles, it is inside this area where alts start to dominate more of the market. I have OTHERS layered with the maroon line graph.
A snap shot of accumulation before the 2018 Bull Market top: As the major support structure is broken, it gets exciting for alts as OTHERS creates a new high. 👇👇👇
Taking a look at accumulation before the 2021 Bull Market top: The support structures show their significance as OTHERS prints rally's to the upside. 👇👇👇
So, now we have been bumping into that same area of support (Selling Climax Support) this cycle since August and printing a descending wedge, which is generally considered a cause building event for a bullish move.It's possible that a retest of the upper supply line is in the MM playbook. It's also possible that there could be resistance up higher or further down. On a smaller time frame, there is a potential bullish pennant printing, we wouldn't know until or if a higher low is printed.
With this analysis in mind, we are close to a critical moment in crypto where the bulls have historically showed strength and reclaimed dominance in the market. It could be weeks or months, but this TA suggests that the moment is soon to come.
Good Luck Traders!
-Not Financial Advice-

BTC.D MThis is my opinion on Bitcoin dominance. It could go a little higher with the new Bitcoin ceiling, but I don't think it has the potential to go much higher. First 50% and then 44% are my targets on the monthly time frame. What do you think?

Bitcoin dominance showing a VERY different market cycle BULLSIH
As ever.yjr chart says it all but why am I posting this on a Saturday night in Europe ?
Because something is going to change soon.......and I have no idea in which direction BUT.............
As you can easily see, in the previous 2 cycles on this chart, were we had a tangible Bitcoin dominance over other crypto assets, that dominance fell dramatically as we approached Bitcoin All time highs after Bitcoin Halvings.
As we see, for the 2017 BTC ATH, we had a 61% drop in BTC.D and then a recovery to the next halving.
From that Halving to the next ATH in 2021, we had a near 37% Drop in BTC.D
Many people, including me, have been saying how different things are this cycle and this is shown very clearly with the BTC.D this cycle.
Just see the difference on the chart. Since 2023, a slow, steady, near unstoppable climb
And IF the current ATH in BTC is the Cycle High, then we need to see that BTC.D is NOT in a negative number but is in fact OVER +5% higher than when the halving took place.
YES, we have had a drop from a higher % to this current level but it is NOTHING as much as previous cycle.
SO, the question is now, Is this the Cycle TOP ?
We will not know until the moment has passed. but even to see a -30% would see Bitcoin entering a price range that is HIGHLY unlikely now.
It is the Failure of the ALTS to take peoples money that has led to this and the reason for this is simply that BITCOIN is now regarded as a Real, proper asset class.
It has Matured.
It is utter DOMINANCE over its Rivals.
So, what now ?
We wait and see if we are entering a BEAR Market, in which case, the ALTS have had their day and sadly, will dwindle away and some will remain, fighting each other for a small part in the Market. Some WILL Dominate others and I think we all know which they are.
Maybe things will move and money will flow out of BTC into ALTS...but we have already past the time period where this has happened after a halving.....
When BTC enters a Bear, so do the ALTS>.
Maybe we will not see a BEAR this Time.
Things ARE different on so many fronts......
But ask yourself......Can you see the corporations selling 100's of Bitcoin now or after we see antoehr ATH ?
That would maybe reduce BTC dominance over other assets in Crypto...but -30% ?
NO WAY


Update on BTC.DBTC.D is looking good for capital to rotate into alts. We tried to retest the 0.702 and failed.

BTC.D we have to notice.We need to retest on lower level of channel and then touch 54% to see alts rally and if we saw a fake out like recent its good for market and alts gives you gains after that …

$BTC.dlet see if this is an accumalation for a leg up or we distribute and start our santa rally and sell before chinese new years
hahaha lost a fair bit on that dip last week but still know that alt season is coming so laddering in lower in case we reach 60% above
emotions check ??? excited but cautious dip can keep dipping shall increase leverage on confirmation of close below blue line .. cheers!

BTC.D wick recovery time?Expecting this to play out, at the same time S&P looks ready for a correction from the 6700 zone, this will make sense S&P drop will take crypto down with it. Seeing a red vector candle left to recover at 64% makes me think a probable scenario will be for btc.d to go a little beyond the wick and recover the vetor. This zone will give the best Risk to Reward over all.

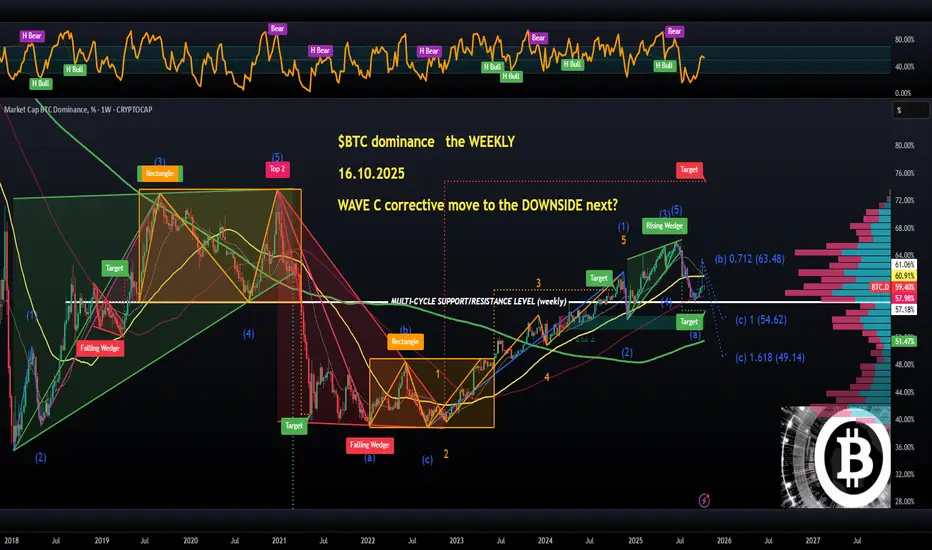
$BTC.D (weeklY(: WAVE C to the downside next (49%)?CRYPTOCAP:BTC dominance, the WEEKLY chart for a better idea as fas as where we are with this crypto game after recent developments with the trade war in mind.
So the weekly chart is actually looking amazing for altcoins, we are most likely heading for a much deeper correction purely based on the technicals here, not speculation.
The most important level to watch is 57.2% as a multi-cycle SUPPORT/RESISTANCE level. Back in 2021, when that exact level broke down (orange RECTANCLE on the left side), it ended up crashing all the way down to 39%. That was a full-blown #Altseason which lasted for a few weeks.
Seasonality-wise, Q4 should be the best for crypto, so we would have a brilliant correlation if 57.2% becomes resistance again, so far, there was a bounce off it at the beginning of September, which triggered nothing but bleeding ever since.
So, this is a long-term view, if correct, then we should get a WAVE C correction to 54.6% or more optimistically, 49% or even below. I would bet on 49% personally, if I had to make a based guess.
👽💙
Could BTC Dominate ~80% This Cycle?CRYPTOCAP:BTC.D Since December 2017 BTC.D has printed higher highs each cycle. You can notice how the Jan '21 top is slightly higher than the Dec '17 top. So, BTC continues to dominate more and more of the market.
The major top wicks of high volatility seem to be orchestrated to mimic wave tops that we see commonly in other assets, only to be engulfed at a later time.
BTC.D is currently below a 1.618 Golden Window and was previously stuffed by the ratio. This could be set to break through that resistance and continue on up to form a higher high in this cycle. And it's very likely that we will eventually see a higher high than that of January 2021 (the kick-off for last cycles alt season).
So, this serves as another clue that deeper selling climaxes, Secondary Tests, and Springs are in the works for the crypto market.
The upper 2.272 ratio may very well be the bell dinging for major pumps in alts once again.
-Not Financial Advice-

btc.d chart reviwThe move is unfolding exactly as projected — 60 to 57, then to point 61 in my channel , and now on track for 55–54. Stay tuned for the target hit.
In my next post I will also analyze $usdt.d.

BTC.D
Weekly analysis
Bitcoin dominance:
Bitcoin dominance first rises with Bitcoin ATH and then makes a major decline leading to Alt Season

Golden Opportunity Ahead for Altcoins | BTC.D Update 🚨 Alt Market Update 🚨
BTC.D broke its 2-year-old trendline last month and is now heading back for a major resistance retest (could take about a week). Until then, expect some altcoin bleed.
👉 For Traders: This zone can become a golden opportunity to hunt big trades — stay sharp and focused.
👉 For Investors: Best time to hold & accumulate large-cap alts, as they carry the highest probability of leading the next strong leg up.
Stay patient, stay focused, and ride the wave with TRUE TIDE 🌊

BTC.D next short term move
Hi everyone
BTC.D has already been on a correction from 57 to 60 meanwhile could also make wicks above 62. There it faced with a rapid push back below 60 and now playing hard with old trendline.
In summary dominance is looking at 57 for next leg down!

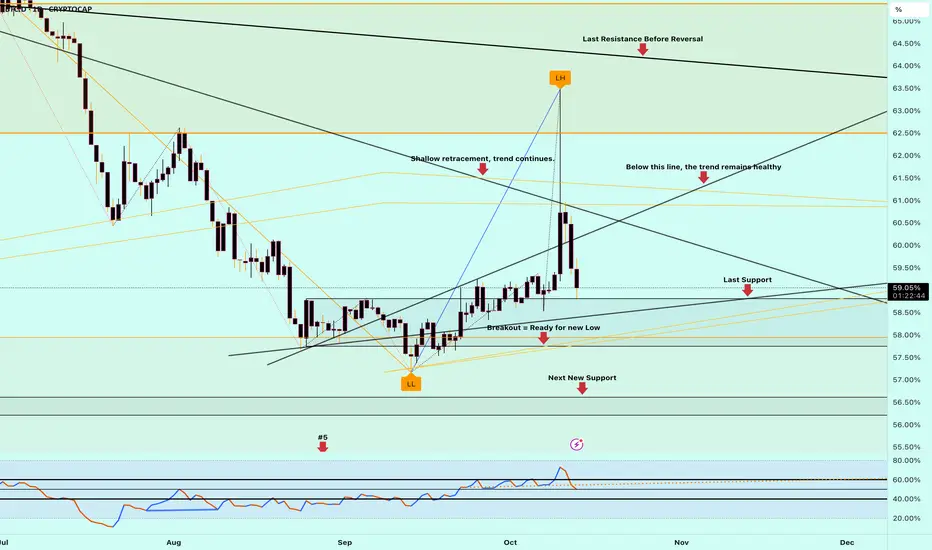
Chart Overview (BTC.D – Weekly Timeframe). Chart Overview (BTC.D – Weekly Timeframe)
Current Level: ~59.24%
Trend: BTC dominance is still moving within a long-term ascending channel, but recently retested the lower boundary after encountering resistance around 64-65%.
Retest of Rising Channel Support:
BTC dominance touched the lower trendline of the ascending channel and found short-term support near the 58% area (marked in yellow).
Resistance Area (60-62%)
The chart shows a gray resistance area where dominance was previously rejected. This area is crucial for confirmation.
If BTC.D does not close above this, we could see further downside movement.
Potential Downside Ahead:
The large downward arrow indicates a potential correction phase, targeting the 50-45% dominance levels – a scenario that typically benefits altcoins (altseason signal).
Support Zone: 56-58%
Resistance Zone: 60-62%
Potential Downside Target: Around 45%
Trend Structure: Still bullish in the long term, but bearish momentum is possible in the short term.
If BTC dominance decreases, it means altcoins could strengthen.
If BTC dominance increases again, Bitcoin will continue to outperform altcoins.
BTC dominance is strengthening after a long bullish run.
If it fails to reach 60-62%, a trend toward altcoins is expected in the coming weeks.
DYOR | NFA
#BTC.D 12H ChartBitcoin dominance bounced again after retesting the support line. It is currently retesting the resistance line which, if broken, we would expect further bullish movements towards the 200MA.
BTC Dominance Technical & Fundamental OverviewDescription:
Bitcoin Dominance (BTC.D) represents the market share of Bitcoin relative to the total cryptocurrency market. Tracking BTC.D can help identify trends in altcoin cycles and overall market sentiment. This analysis combines technical patterns, support/resistance levels, and relevant market fundamentals to provide an informed perspective.
Disclaimer:
This content is for educational purposes only and does not constitute financial advice. Trading cryptocurrencies involves significant risk. Always perform your own research before making any trading decisions.
Hashtags / Keywords:
#BitcoinDominance #BTC #CryptoMarket #TechnicalAnalysis #CryptoTrading #AltcoinSeason #MarketTrends #BTCAnalysis #CryptoEducation #TradingView
Altseason on the Horizon?Technically, BTC Dominance has retested the breakdown of the rising channel, confirming a clean rejection from the retest area.
If price manages to break below the current support zone, we could see a strong shift toward altcoins as capital starts rotating out of BTC.
This recent move also flushed out over-leveraged traders, resetting market positioning, a healthy sign before the next major leg.
Stay patient and always analyze your risk before entering any position. The next few weeks could be decisive for the altcoin market.
DYOR, NFA
Stay tuned for more update
THANKS FOR THE READING
#PEACE

Btcd This is the first test on the 200 ma
Keep a eye on it
I know last Friday seem tragic
But stay locked in

#BTC.D 12H ChartBitcoin dominance did a sweep to the upside and left a 12h supply zone at around 60.3%. It is currently back inside its previous range where it is bouncing off the 100MA. If it breaks above the resistance line again, we shall see some short-term bullish movements towards the 200MA.
