BTCUSD 1H BULLS HAVE UNFINISHED BUSINESS :)Very strong area of SUPPORT/RESISTANCE @ around 115-116K. Bulls STRONG refuse to let this area go
With market now start to CREATE HIGHER LOWS (small time frame) give me good case for buying this dip
Hopefully we hit our target
BTCETH.P trade ideas

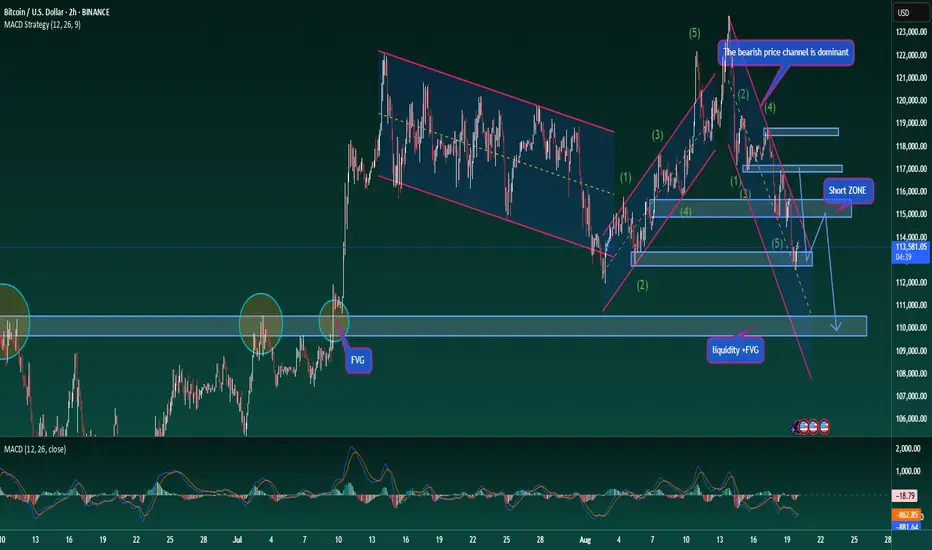
Bitcoin's decline will continueBitcoin's recent trend is quite clear, clearly within a weak, narrow range. Ethereum, however, exhibits relatively greater volatility, offering greater room for maneuver.
Currently, Bitcoin is expected to maintain this range until at least the end of this month. Regarding Ethereum, the overall trend hasn't reversed. While there have been rebounds, the strength of these rebounds has been noticeably weak. Both Bitcoin and Ethereum prices remain within a downward trend. For short-term trading, we prioritize short positions on rebounds.
Short positions can be established around 113,500 for Bitcoin, with a target of 112,600.
Short positions can be established above 4250 for Ethereum, with a target of 4120.
Interesting Fib retrace info could help understand the next bear
Nessy chart initily but I have broken it down here and it will be easy to understand
Also, to make it ckearer to see, I have used a line for the PA..the retracements and % pull backs are accurately placed using the candles....
So, an interesting thing appeared when I was laying with Fib Replacements.
Simply put,
From 2013 ATH to the next Low was a -78.27 % pull back to the 0.236 Fib retracement
From 2013 ATH to the next Low was a -82.20 % pull back to the 0.382 Fib retracement
From 2013 ATH to the next Low was a -76.40 % pull back to the 0,5 Fib retracement
So, after each ATH, PA pulled back to the next step down from previous fib retracement, while pulling back approx the same %
Shuold Bitcoin do the same again, whichh would Scare a Lot of people, we could expect to see a pull back to the 0.768 Fib retracement...and using a near -80 % pull back, we would end up around 24K Low in Nov 2026
Will this happen ?
Who know and I doubt it but until things and patterns change in the way Bitcoin runs its 4 year cycles, then it is a possibility.
But I found it fasinating how yet anoterh sequence occured in the last 3 cycles that Bitcoin has performed.
Nothing else has ever done this.....
So, Lets see if it repeats

BTC RANGINGFirst, yesterday was one of the statistically rare times that bullish divergence fails on the Bitcoin chart, but it obviously happens. There was only a small bounce and both price and RSI made lower lows on the 4-hour chart.
Bitcoin has pulled back sharply from its recent local high at $123,231, where sellers stepped in aggressively and rejected price with a long wick to the upside and bearish divergence. That rejection has now pushed BTC below the 50-day moving average, flipping it into resistance for the first time since June.
The immediate battle is at $112,000 – a key level that served as resistance during the July breakout and is now being tested as support. If this level holds, bulls can regroup and make another push toward the highs. If it fails, the next major demand zone doesn’t come in until around $100,700, a level that absolutely must hold to preserve the broader bullish structure.
The good news – this still looks like a healthy correction within an uptrend. The market had run hot after July’s breakout, and profit-taking at resistance was inevitable. For now, the bull market structure remains intact as long as Bitcoin stays above six figures.
In short – the trend is still your friend, but the $112K line is the battleground. Lose it, and we’re likely staring at a deeper correction. Hold it, and $123K comes back into play quickly. We are ranging between those two levels.

BTCUSD Pressure Continues to the downsideMore bearish continuation patterns and an extension of the resistance trendline as price continues to fall. Keeping it simple with just basic price action confluence.

Keep Buying Bitcoin till BTC Reaches 1 Million USDNot a investment advice
As of August 20, 2025, Bitcoin (BTC) is trading around $113,800 with recent price drops of about 4-5% over the past week. Market sentiment appears cautious as long-term holders have started taking profits, which often happens when the price hits resistance levels. On-chain data shows significant movement from large holders and increased selling volumes in futures contracts, signaling some bearish pressure in the short term.
Expert analysis suggests that August might be a challenging month for Bitcoin, with sideways trading expected before momentum resumes. Some analysts project a mild price rebound going into late August and beyond, but overall the market is showing mixed signals with some uncertainty. The outlook suggests caution and waiting for a clearer trend before heavy buying.
"Buy the dip" strategies could benefit those with a high risk tolerance and a long-term outlook, but it carries risks given the current volatility and uncertain momentum. As always, investors should carefully consider their risk appetite and time horizon, given these mixed signals in the Bitcoin market currently

BTC/USD) Technical analysis Read The captionSMC Trading point update
Technical analysis of BTC/USD daily chart analysis you shared:
---
Analysis Idea – Bitcoin (BTC/USD)
1. Key Resistance Zone (Yellow Box):
BTC faced multiple rejections from the highlighted resistance area (shown by red arrows), indicating strong selling pressure.
2. Trendline Break:
A clear break below the ascending trendline confirms weakness in bullish momentum and suggests a shift toward bearish structure.
3. EMA 200 (Blue Line):
The 200-day EMA at 103,179 acts as a dynamic support. If price continues downward, it will likely test this area.
4. Target Zone:
Bearish continuation points toward the 100,720 – 100,419 support zone, marked as the target point on the chart.
5. RSI (42.74):
RSI is trending lower, supporting bearish momentum but not yet oversold — indicating more room for downside before a potential bounce.
Mr SMC Trading point
---
Idea Summary:
Bitcoin is showing signs of a bearish reversal after repeated resistance rejections and a trendline break. Price is likely to head lower toward the 100,700 region, with the 200 EMA providing possible short-term support.
Please support boost 🚀 this analysis)

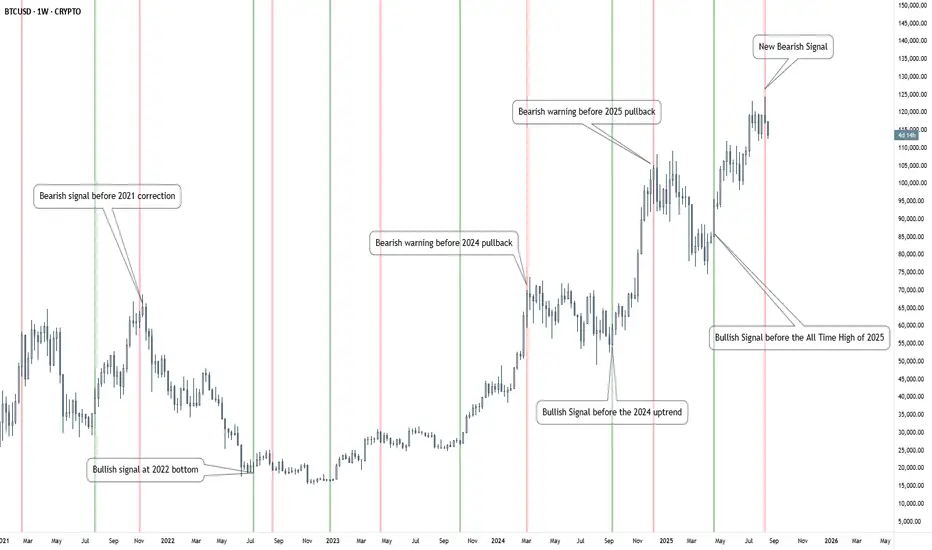
Bitcoin | Following the Smart Money Trend🔴 Smart Money positioning just triggered a new Bearish signal on Bitcoin.
This chart highlights how trend shifts in Bitcoin can be tracked by following changes in market positioning from major players – often referred to as Smart Money.
🟢 Bullish phases appear when institutional positioning suggests growing confidence.
🔴 Bearish phases emerge when Smart Money flows signal risk-off sentiment.
📊 The Custom Indicator Histogram visualizes the momentum behind these moves.
Historically, these signals have aligned with key turning points in Bitcoin’s long-term cycle.
👉 A new Bearish signal has just been triggered, suggesting caution for the weeks ahead.
⚠️ This analysis is for educational purposes only and should not be taken as financial advice.
BITCOIN 2020 fractal gives huge buy signal now.Bitcoin (BTCUSD) broke below its 1D MA50 (blue trend-line) emphatically for the first time in 2 months, sounding short-term fear alarms ahead of the key macroeconomic news of this week. The 1D RSI hit 40.00 however, which has been an automatic buy on both major recent lows (August 01 and June 21).
Short-term aside, it is a fractal from BTC's last Cycle in 2020 (chart on the right) that perhaps offers the most comprehensive long-term outlook, which is what has always helped us maintain an objective, stress-free perspective.
As you can see, both today and 2020 fractals display not only similar price actions but also RSI sequences. Even though naturally the 2020 rebound on the Pivot trend-line has been way more aggressive as the market was still recovering and adjusting the price from the COVID crash, today's price action display's similar phases but in a more sustainable rise.
Based on the RSI fractals, we could be in similar phase as early December 2020. This suggests that there is still upside potential that may extend to as high as 150 - 170k before this Cycle is over.
Do you think that this is a solid Profit Zone for the Cycle? Feel free to let us know in the comments section below!
-------------------------------------------------------------------------------
** Please LIKE 👍, FOLLOW ✅, SHARE 🙌 and COMMENT ✍ if you enjoy this idea! Also share your ideas and charts in the comments section below! This is best way to keep it relevant, support us, keep the content here free and allow the idea to reach as many people as possible. **
-------------------------------------------------------------------------------
💸💸💸💸💸💸
👇 👇 👇 👇 👇 👇

#BTCA break of 112k might give us a short term sells back to 100k, aside that ,Bitcoins remains bullish and could continue its rally from and ultimate
support 112k

Bitcoin possible correction?📈 Hey Traders!
Here’s a fresh outlook from my trading desk. If you’ve been following me for a while, you already know my approach:
🧩 I trade Supply & Demand zones using Heikin Ashi chart on the 4H timeframe.
🧠 I keep it mechanical and clean — no messy charts, no guessing games.
❌ No trendlines, no fixed sessions, no patterns, no indicator overload.
❌ No overanalyzing market structure or imbalances.
❌ No scalping, and no need to be glued to the screen.
✅ I trade exclusively with limit orders, so it’s more of a set-and-forget style.
✅ This means more freedom, less screen time, and a focus on quality setups.
✅ Just a simplified, structured plan and a calm mindset.
💬 Let’s Talk:
💡Do you trade supply & demand too ?
💡What’s your go-to timeframe ?
💡Ever tried Heikin Ashi ?
📩 Got questions about my strategy or setup? Drop them below — ask me anything, I’m here to share.
Let’s grow together and keep it simple. 👊
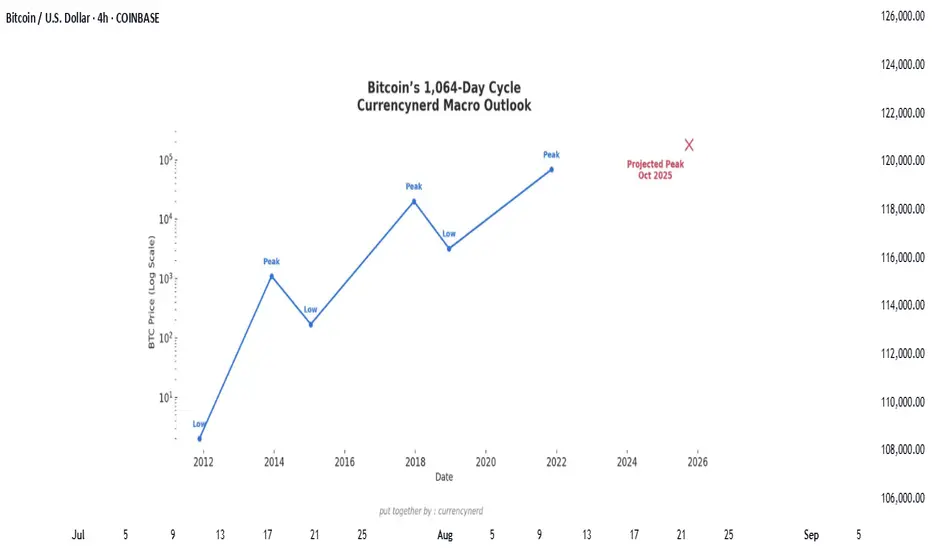
1,064-Day Crypto Cycle coming.. Oct 06 2025Are We Nearing a Macro Turning Point?
Markets may look chaotic on the surface, but zoom out far enough and a rhythm begins to emerge. For Bitcoin and the broader crypto market, one of the most compelling patterns traders track is the 1,064-day cycle, a rough cadence of boom and bust that has repeated across multiple market eras.
With October 2025 approaching, many analysts are asking: Is another turning point on the horizon?
Why 1,064 Days?
The number isn’t arbitrary. Crypto markets, especially Bitcoin, have displayed a recurring rhythm tied loosely to halvings, liquidity cycles, and investor psychology. Roughly every 1,064 days (about 2.9 years), Bitcoin seems to align with a macro peak or trough.
Cycle 1 (2011–2014): BTC surged from a few dollars to over $1,000 before collapsing in late 2013.
Cycle 2 (2014–2017): The next expansion drove prices to $20,000 by December 2017 — almost exactly 1,064 days later.
Cycle 3 (2018–2021): From the 2018 bear bottom, Bitcoin reached $69,000 in November 2021 — again within the 1,064-day window.
The cycle doesn’t work like clockwork, but the cadence is eerily consistent, suggesting that investor flows, halvings, and liquidity injections may move in long, repeating arcs.
Mapping Today’s Position
If we anchor the most recent cycle to the November 2021 peak, the 1,064-day marker points us toward October 2025.
This timeline aligns uncomfortably well with two forces:
Halving Lag Effect – Historically, the real bull accelerations occur 12–18 months after a halving event (the next one being April 2024). That would put late 2025 squarely in the “froth” zone.
Liquidity Rotation – Global central banks are currently balancing inflation with growth concerns. By late 2025, markets may expect easing, a perfect storm for risk-on assets like crypto.
What the Charts Suggest?
Looking at long-term Bitcoin charts, cycle expansions follow a similar arc:
A steep bull phase fueled by retail and institutional adoption.
A distribution top marked by extreme leverage, retail euphoria, and inflows into speculative altcoins.
A macro correction that wipes out 70–85% of value before a new base forms.
If history rhymes, the 2025 cycle top could be the most significant yet, not just in terms of price, but in market maturity. Institutional ETFs, regulatory frameworks, and global adoption add layers of credibility that were absent in past cycles.
Why Traders Should Care
Cycle mapping is not about prediction with surgical precision, it’s about framing risk and opportunity.
For long-term investors: Understanding that late 2025 could coincide with a major top helps avoid FOMO and plan exits with discipline.
For swing traders: These cycles offer context for positioning. Bull legs tend to accelerate in the 6–12 months before the cycle peak.
For macro thinkers: If crypto follows this cycle, it could front-run global liquidity shifts, making it a leading indicator for risk appetite.
nerdy thoughts : The Clock Is Ticking
The 1,064-day cycle isn’t prophecy. But its consistency across three full eras of crypto history makes it hard to dismiss. As October 2025 approaches, traders would do well to watch for echoes of past patterns: accelerating inflows, leverage buildup, and sentiment peaking.
Because in crypto, time doesn’t just pass, it compounds into cycles. And those cycles often whisper what comes next.
put together by: @currencynerd
courtesy of : @TradingView
Bitcoin Reward – Bullish Thieves or Bearish Bandits?🚨💰 BTC/USD "Bitcoin vs U.S. Dollar" Crypto Market Grand Heist Plan 🎭🚨
🕵️♂️ Dear Thief OG’s, Money Makers & Market Bandits 💎💰
It’s time to lock & load the Bitcoin Heist Plan with both sides of the robbery open (Bullish & Bearish)! ⚡
🔑 Entry Zones (Where the Robbery Begins)
📉 Bearish Bandits: Any price level! Rob the upside liquidity & run it down!
📈 Bullish Thieves: Pullback entry 108,000.0 and above – sneak in with style & power.
🛑 Stop Loss (Escape Route)
🔒 For Bullish: Thief SL @ 105,000.0 🚨
⚠️ Reminder, OG’s: Adjust your SL with your own strategy & risk plan. Don’t get caught by the market police 👮♂️💥.
🎯 Target (The Loot Bag)
🏆 Bullish Robbery Target: 124,000.0 💸
🏴☠️ Bearish Robbery Targets:
1️⃣ 110,000.0
2️⃣ 104,000.0
📜 Thief’s Market Note
This isn’t just a trade, it’s a crypto robbery blueprint – choose your side, Bullish or Bearish, and execute like a true Thief Trader. Always plan your entries in layers, stack the loot, and manage your risk like a pro bandit. ⚡💼
🔥💥 If you love the heist style, Boost this idea 💥🔥
Every boost adds fuel to the Thief Trading Crew 🚀💎.
Stay alert, stay sharp, and remember… the market is the biggest bank, and we are here to rob it! 🤑🎭💰

BTCUSD – 1H FVG + Fibonacci ConfluenceWill we see bearish continuation this soon? The highlighted zone shows a 1-hour Fair Value Gap aligned with the 61–78% Fibonacci retracement. Price may be setting up for the next leg down.
With Jerome Powell speaking today at Jackson Hole, will the market react sharply or stay calm before the storm?
Let’s watch closely…

ShortThis is not a top and it's likely to go down to 100k many people will sell then whales will buy more and it will go up to break previous high of 124k.

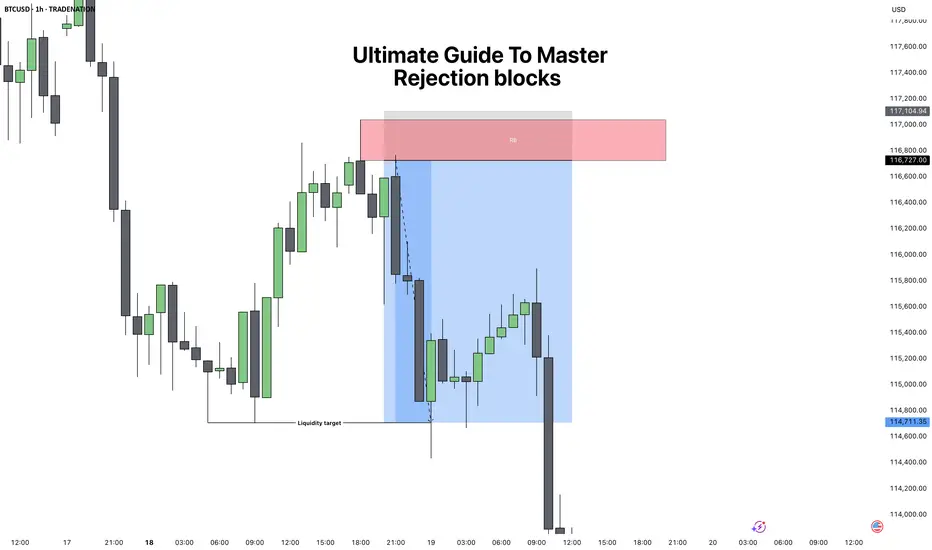
Ultimate Guide to Master: Rejection BlocksRejection Blocks (ICT Concept) – Complete Guide
1. What is a Rejection Block?
A rejection block is a special type of price level that forms when the market attempts to push through but gets denied and reverses. Unlike a traditional order block, which represents accumulation or distribution by institutions, a rejection block shows a failed attempt to continue in one direction. It is a footprint of rejection and often becomes a strong reaction zone in the future.
There are two types:
Bullish Rejection Block:
Forms from a bearish candle whose low is taken out, but price fails to continue lower and closes back above. The low of that candle becomes the key level.
Bearish Rejection Block:
Forms from a bullish candle whose high is breached, but price fails to continue higher and closes back inside. The high of that candle becomes the key level.
These levels can act as hidden support or resistance and often serve as high-probability entry points when combined with market structure.
2. How to Spot a Valid Rejection Block
To correctly identify rejection blocks, you need to look for:
1. Clear Attempt Beyond a Candle
Price must trade beyond the high or low of a prior candle, suggesting continuation.
2. Failure and Return
After breaching the level, price fails and closes back inside the candle’s body.
3. Liquidity Context
A rejection block is more powerful if the wick that caused it swept liquidity (equal highs/lows or a previous key level).
4. Higher Timeframe Confluence
The best rejection blocks line up with higher timeframe bias (for example, spotting a bearish rejection block inside a 4H premium zone during a downtrend).
3. How to Trade Rejection Blocks
Trading them involves waiting for price to come back to the rejection block level and using it as an entry or reaction zone.
Bullish Setup:
When price trades below a bearish candle, fails, and closes higher, mark the low of that candle. On a retracement, price often retests that level as support.
Bearish Setup:
When price trades above a bullish candle, fails, and closes lower, mark the high of that candle. On a retracement, price often retests that level as resistance.
Entry Technique:
You can enter "blindly" when you're understanding the confluences. But to begin with do this Instead, when price returns to the rejection block, drop to a lower timeframe and look for confirmation such as:
* Fair Value Gap (FVG) entries.
* Market Structure Shift (MSS).
* Liquidity sweeps into the level.
Stop Loss Placement:
Always place stops beyond the rejection candle itself (above the high for bearish RB, below the low for bullish RB).
4. Practical Examples and Market Context
Rejection blocks work best when they appear in the following situations:
Liquidity Sweeps:
After equal highs or equal lows are taken out, a rejection block often marks the failure point.
Inside Premium/Discount Zones:
In a bearish bias, look for bearish RBs in premium pricing. In a bullish bias, look for bullish RBs in discount pricing.
During Consolidation Breakouts:
If the market fakes a breakout and closes back inside, the rejection block often becomes the level to fade the fake move.
For example, if BTC takes out a prior daily high, prints a rejection block, and then closes back inside, the odds of reversal are high, especially if price was already in premium territory.
5. Combining Rejection Blocks with ICT Concepts
To increase accuracy, always combine RBs with ICT’s other tools:
Fair Value Gaps:
If a rejection block aligns with an FVG, it adds strength to the level.
Market Structure Shifts:
A rejection block is more powerful if followed by displacement and an MSS.
CISD Pattern:
A rejection block often forms right after the “Stop Hunt” part of the CISD sequence, serving as a clean entry.
Liquidity Pools:
Look for RBs near equal highs/lows, old highs/lows, or session liquidity (London/New York).
Conclusion
Rejection blocks are subtle but highly effective levels that show where the market tried to extend but failed, leaving behind a hidden form of support or resistance. By themselves they are useful, but when combined with ICT concepts like liquidity sweeps, MSS, and FVGs, they become powerful entry tools. The key is to always wait for price to return and confirm the level before entering, and to only trade them in alignment with higher timeframe bias.
Disclosure: I am part of Trade Nation's Influencer program and receive a monthly fee for using their TradingView charts in my analysis.
___________________________________
Thanks for your support!
If you found this idea helpful or learned something new, drop a like 👍 and leave a comment, I’d love to hear your thoughts! 🚀
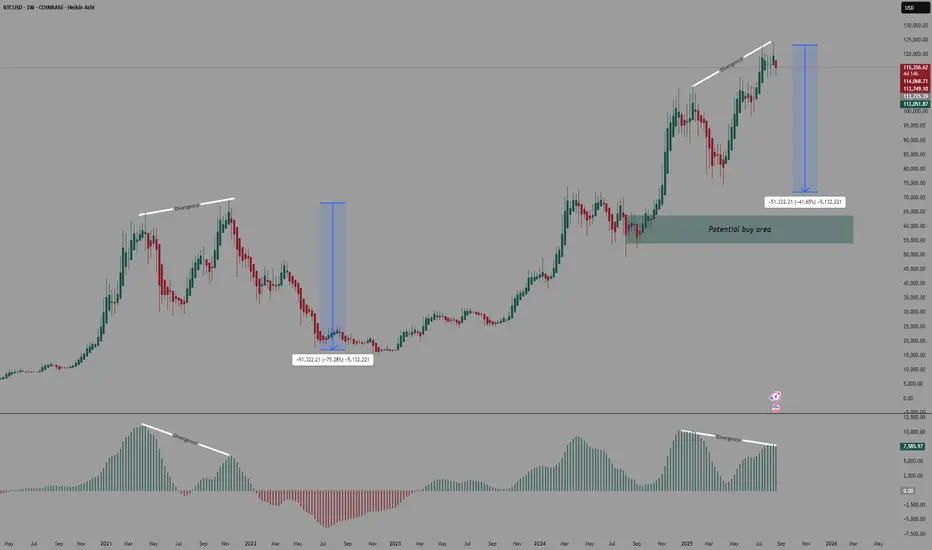
BITCOIN AND BITCOIN DOMINANCE REVERSAL SIGNALS In this week's video, I breakdown the likely scenario for Bitcoin to pullback to about $112k after a few days of sideways consolidation with a resistance target of $119,282. I also demonstrate the support level of $120,660 being broken on the weekly chart along with the indicator divergences and shooting star reversal candle on the weekly timeframe.
Bitcoin dominance is still trending down and has not found a confirmed reversal yet. There is some divergence on the daily and 4 hours timeframe but it's not confirmed until a we get a strong reversal candle that closes above the 4 hours consolidation zone.
Thank you for your time visiting my analysis publication and I wish you the best of trades this week. Cheers!!


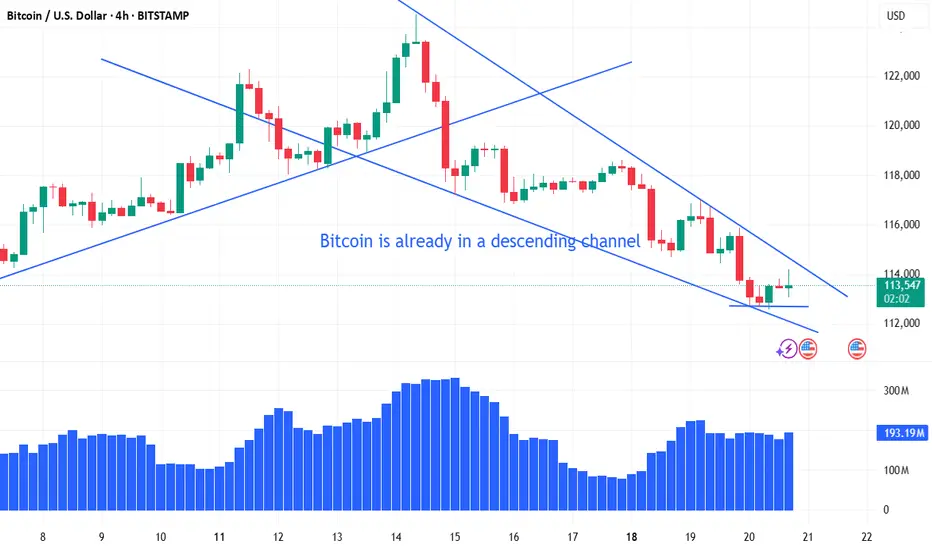
Bitcoin Update – Price Action Still on TrackBitcoin Update – Price Action Still on Track
Yesterday’s scenario has continued to play out with precision. BTC remains guided by the descending channel, each time touching the upper trendline it quickly rejects and moves lower. At present, price is reacting around the midline of the channel, near 113,000 – exactly the level highlighted earlier as an area to watch.
With this corrective move, there is scope for BTC to retest the 115,000 region before resuming its broader downtrend. The next downside target sits near 110,000, as larger timeframe structures usually require a corrective pullback before continuing with the main trend – something that aligns closely with Dow Theory principles.
Today’s focus is also on interest rate discussions, which could bring higher volatility across global financial markets as investors remain cautious. However, FOMC outcomes tend to have limited impact on Bitcoin given its nature as a relatively independent asset, unlike gold or forex markets that are more sensitive to macroeconomic drivers.
For short-term trading, traders may consider long positions near 113,000 with a tight stop just below the newly formed support, aiming for a move towards 115,000 before reassessing the broader trend.
Patience and discipline remain key. Sticking to a well-defined plan rather than reacting emotionally to intraday swings will often lead to stronger trading outcomes.
What’s your view on Bitcoin’s next move? Share your thoughts in the comments.
#BTCUSD #Bitcoin #CryptoAnalysis #TechnicalAnalysis #PriceAction #Trendline #DowTheory #CryptoTrading #SwingTrading #UKTrading
Bitcoin: $120K Breakthrough – Getting Ready for $130K–$134K!Bitcoin: $120K Breakthrough – Getting Ready for $130K–$134K!
🚀 Bitcoin (BTC/USD) – Technical Review, August 2025
• Support: $110K–112K holds — above it, bulls retain initiative.
• Momentum resumes: BTC broke through $120K, thanks to $260 million inflow into Bitcoin via ETFs and potential Bullish IPO. Drive is maintained. Possible target is $130K–$134K.
• Technical outlook: Recovery above $115K after record highs in July. Breakout — will give way to $128K. Hidden risks — fall below $110K.
• Long-term targets: Technical measurement points to potential up to $146,400 if above $112K holds and top is broken. RSI remains favorable, volumes on exchanges are declining — signal of institutional outflow.
Bottom line: Bitcoin is confidently holding above the key $110-120K zone. A breakout of $120K is a starting point for a move to $130-$134K, and then to $146K. Watch for consolidation or pullback near current levels.
Tactics:
- Buy on dip: around $112-115K with targets of $130-134K.
- Breakout buy: if it consolidates above $120K, target $130-$134K, then $146K.
- Stop loss: under $110K.
Still not ready for the crashThis channel is not providing individualized trading or investment advice, nor is it a banking service, brokerage service, trading service, investment service or money management service

Bitcoin, Ethereum Breakout: 401(k) funds & the next "Altseason"Bitcoin is up 10% in August, driven by strong ETF inflows and a game-changing executive order allowing 401(k) retirement funds to invest in cryptocurrencies, potentially bringing trillions of dollars into the sector.
Technically, Bitcoin and Ethereum are breaking out toward multi-year highs, with BTC leading and ETH close behind—setting the stage for a possible "altseason" if these levels hold and capital rotates into altcoins.
This content is not directed to residents of the EU or UK. Any opinions, news, research, analyses, prices or other information contained on this website is provided as general market commentary and does not constitute investment advice. ThinkMarkets will not accept liability for any loss or damage including, without limitation, to any loss of profit which may arise directly or indirectly from use of or reliance on such information.

