Short term higher, then lowerIt looks like a possible short term move back up, then selling continues.
Trade ideas

Bitcoin – Technical + Fundamental Analysis
📊 Technical Situation
BTC remains inside its bullish ascending channel, with lower boundary still holding well.
Yesterday, price failed to break above the channel’s mid-line / resistance, suggesting consolidation is needed.
A drop toward the lower boundary of the channel could provide good liquidity and a support zone for a bounce.
If that support holds, price could attempt a new upward swing targeting ~94,000 USD, assuming resistance is overcome.
🌐 Fundamental Context
Risk sentiment remains shaky: as traditional markets show volatility, crypto tends to follow — higher Treasury yields and macro pressure have weighed on Bitcoin recently.
On the other hand, medium-term tailwinds remain: growing concerns over global money supply and potential monetary easing support Bitcoin as a hedge against inflation and currency debasement.
Institutional flows remain a mixed factor: while some investors are reducing exposure, others view dips as opportunities — this could generate volatility, but also strong rebounds if sentiment flips.
🎯 What I Expect
Ideally, BTC corrects toward the channel floor before resuming upward — this sets up a buy-the-dip opportunity.
If macro conditions worsen (rising yields, global risk-off), expect pressure toward lower channel support or even deeper.
If support holds and yields/market sentiment improve, Bitcoin could push toward 94,000 USD or higher.

BTC-USDT
The 2-hour chart has reached its short-term support at 92,800 📌
If this level is broken,
it's likely that the correction could continue down to the psychological support at 90,000 dollars, which is natural after the good growth it had 📉💸
The next upward move will happen when the red resistance is broken, in that case, it could go up to 95,900 🔼✔️

BTCUSD: Onchain data: Good Buy?A. Onchain current landscape:
- MVRV Ratio: Dropped from 1.83 to 1.64
- Well below the 2.0 "heated market" threshold
- Far from the 3.5 "overheated" danger zone
Interpretation: Market is NOT overextended; substantial upside room remains
- Net Unrealized Profit/Loss (NUPL): Declined from 0.45 to 0.39
Entered "Anxiety" zone, trending toward "Fear". Historically, NUPL below 0.40 marks excellent accumulation zones
Signal: Weak hands being shaken out, strong hands accumulating
B. Exchange Flow Dynamics: Smart Money is Accumulating
Critical Pattern Observed:
- Nov 11: -2,579 BTC (outflow - accumulation)
- Nov 12: -659 BTC (outflow - accumulation)
- Nov 13-14: +777 BTC, +5992 BTC (large inflows during panic selling)
- Nov 15-16: Mixed flows, continued selling pressure
- Nov 17: -4,036 BTC massive outflow
Analysis: The -4,036 BTC outflow on Nov 17, as price stabilized around $92k, is the first reversal signal. Smart money accumulated aggressively at depressed prices while retail capitulated.
C. SOPR Analysis: Capitulation in Progress
Spent Output Profit Ratio (SOPR) Timeline:
- Nov 11-12: Above 1.0 (healthy profit-taking)
- Nov 13-17: Below 1.0 (0.989-0.994)
Critical Insight: When SOPR falls below 1.0, it means investors are selling at a loss, a classic capitulation signal. This typically marks local bottoms and excellent entry points for patient buyers.
It means, we need to be patient and accumulate on key supporting levels.
D. Supply Dynamics: Weak Hands Exiting
Supply in Profit: Dropped from 73.6% to 64.5%
35.5% of BTC supply is now underwater (up from 26.4%)
This reset creates a stronger foundation for the next leg up
Investors who bought near the top are capitulating, clearing sell pressure
Whale Accumulation: Follow the Smart Money
BTC whales added ~30,000 BTC during the dip
Value: ~$3 bln in fresh whale accumulation
E. Technical levels:
- Strong supporting zone: 85000-88000.
- Confluence with descending channel's lower bound.
F. The Edge:
While headlines scream "crypto winter" and retail capitulates in fear, seasoned investors recognize this as a gift, a chance to accumulate a scarce, institutional-grade asset at a 26-30% discount from all-time highs, with clear onchain evidence of smart money accumulation.
Analysis by: Dat Tong, Senior Financial Markets Strategist at Exness

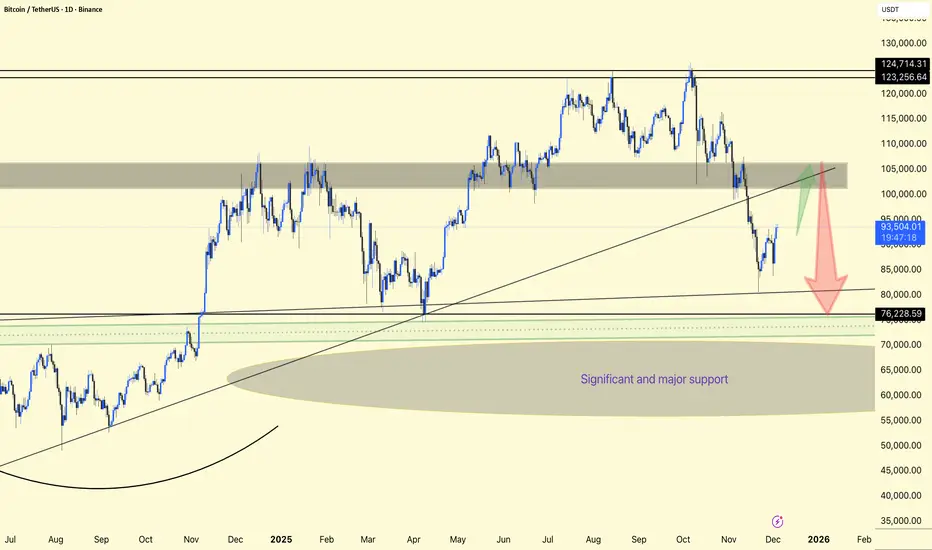
BTC/USDT 1DAY CHART ANALYSIS. Bitcoin (BTCUSDT) is in a corrective phase within a larger bullish structure, currently bouncing off support and heading back towards a large supply zone around 102,000–106,000 USDT.
The price was previously rejected from the top resistance band of 123,000–125,000 and sold off sharply, breaking mid-range support and retesting the long-term rising trendline and horizontal support around 80,000–82,000 as a key demand area.
The chart highlights a large “critical and key support” zone from around the mid-60,000s to the low-80,000s, where multiple higher-timeframe supports and rounded bases converge, making this a key zone.
After marking support, BTC has begun a relief rally towards the broken trendline and gray resistance band near 100,000–105,000; this area could serve as a decision point where either a downward continuation or a resumption of the trend is likely.
Bull Case: A strong daily close above the gray zone and reclaimed trendline would signal continuation towards 115,000 and potentially a retest of the 123,000–125,000 highs.
Bear Case: A break below 90,000 following rejection from this resistance will likely trigger another leg down towards 80,000–82,000 and, if that fails, another deep sweep into the “Significant and Major Support” region around 60,000 before a larger accumulation base can form.
DYOR | NFA
Bitcoin predictionmy thoughts on Bitcoin, im on the fence about where price is heading to but I wouldnt be surprised if its heads lower.

BTCUSDT.P - December 3, 2025Bitcoin is attempting to reverse from a prior downtrend, trading above a short-term rising trendline and pushing into a key resistance band around 93,000–94,300. The chart highlights a bullish scenario targeting the 112,000 area if price can clear this resistance and hold above the stop zone near 97,800. A failure to break and sustain above resistance, coupled with a break below the trendline, would favor a corrective move back toward the 87,300 profit level marked on the chart. Momentum is improving but remains vulnerable around resistance, making this a pivotal area for trend confirmation.

BTC Adam & Eve PatternLooks like on the 12 hour BTC has an Adam & Eve pattern. The height of the arch is the potential downside. So if it plays out, it looks like 74k is possible.

TradeCityPro | Bitcoin Daily Analysis #239👋 Welcome to TradeCity Pro!
Let’s move on to today’s Bitcoin analysis. The market has started a new bullish move, which seems to be the beginning of a sharp upward move.
⏳ 1-Hour Timeframe
Yesterday, after the previous drop, Bitcoin created a range structure, and the bullish move began with the break of the 87,088 resistance.
🔔 This move was very sharp, and the price continued its way up to 93,609, a level that is very important for Bitcoin’s future trend.
⚡️ Currently, after reaching 93,609, the price has entered a range and correction phase, with a pullback to the 91,974 level, preparing for the next upward move.
📊 If volume starts to increase, we can open a long position after the 93,609 level is broken.
🧩 Breaking this level has been a long-awaited trigger for a long position.
💥 The RSI oscillator, after entering the overbought zone, has now reset. If the price starts moving upwards again, and RSI enters the overbought zone once more, we can get momentum confirmation for the next leg up.
❌ Disclaimer ❌
Trading futures is highly risky and dangerous. If you're not an expert, these triggers may not be suitable for you. You should first learn risk and capital management. You can also use the educational content from this channel.
Finally, these triggers reflect my personal opinions on price action, and the market may move completely against this analysis. So, do your own research before opening any position.

Bitcoin Overall: Likely in Bear MarketI've had a blue parabola on my BTC charts--turns out if I switch the chart to log it becomes a line. In any case, we have a seemingly valid Elliott Wave top--ending diagonal wave 5--and now we seem to be on wave 4 of a 5-wave move down.
An alternative scenario is there's still upside, and this is currently a very severe expanded flat--but that is unlikely and would require fairly strong momentum from these levels.
If one still holds BTC I'd recommend a sell in the 94-100K range and buy back lower in 9 months or whatever.
Will do a little analysis to see if there's any probability of an alt season next.

Uptrend confirmed It's best to operate from confirmations, even when you know you're right
I have all the confirmations I need to confirm the we are in an uptrend on Bitcoin

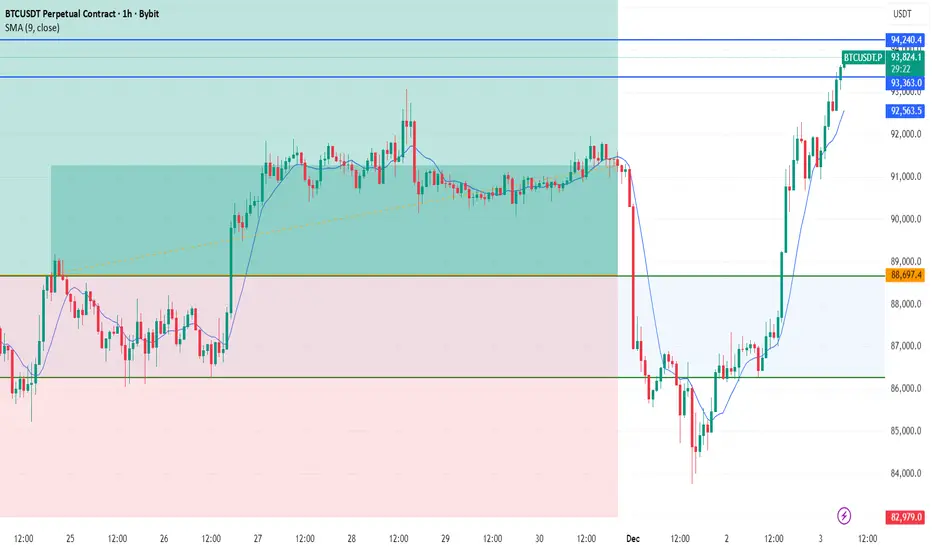
#BTC Retests Resistance Zone📊#BTC Retests Resistance Zone⚠️
🧠As expected, the market found support near the short-term support level of 85358 and rebounded well. Currently, the price has retested the blue resistance zone. We should be wary of a potential pullback, so chasing the price higher here is not recommended. Instead, look for opportunities to short.
⚠️Note that if we successfully break through the blue resistance zone, we need to be cautious of a further surge.
🤜If you like my analysis, please like 💖 and share 💬
BITGET:BTCUSDT.P


The $91k Liquidity Re-Fueling Scenario Before $95kKey Level: $90,000 - $91,000
Significance: This area acts as a major psychological and structural wall. We anticipate significant selling pressure and liquidity pools here (Supply Zone).
The Bullish Requirement: For the move to $95k, the price must reach this area and then Consolidate (settle). A successful Flip to Support is confirmed by closing candles decisively above $91,000. This 're-fueling' provides the necessary market energy.
2. The Next Milestone
Ultimate Target: $95,000
Execution Condition: If the $91,000 level is successfully flipped and held as support with conviction and volume, the next major technical and psychological target for this short-term run is $95,000.

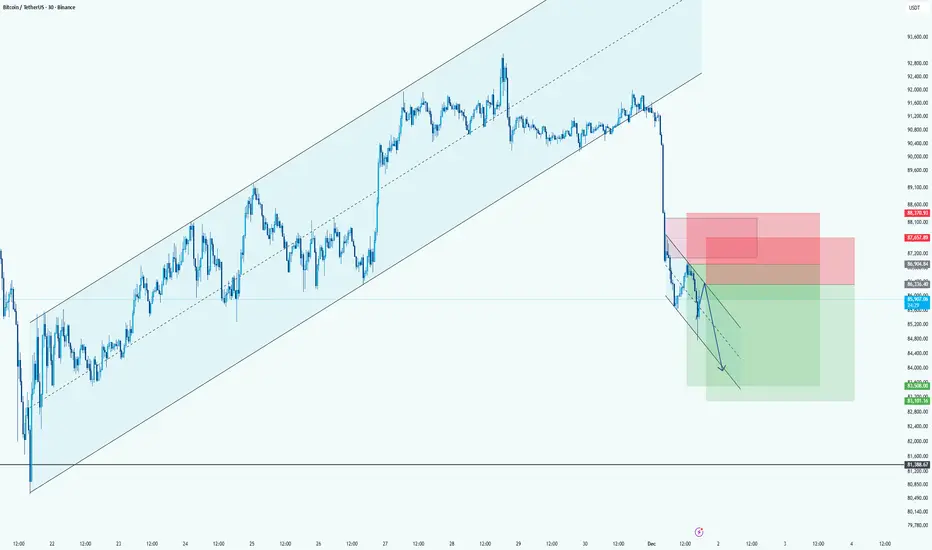
BTC: Bearish Continuation Setup After Major Channel BreakdownHi!
Price broke hard below the long-term ascending channel, confirming a clear shift from bullish to bearish momentum.
After the breakdown, BTC is moving in a small descending correction channel, creating a classic lower-high retracement toward supply.
Direction: Short
Entry Area: 87,200 – 88,300 (two stacked red zones)
Stop-Loss: Above 88,700–89,000 (top of supply)
Target: 83,000 – 84,800 (large green demand area)
BTCUSDTWe have a big downtrend.
By breakout from support and resistance we will have continued trend to next target.
Breakout 82k ready to 70k.
Breakout 93k ready to 100k and 115k.
CRYPTOCAP:BTC BITSTAMP:BTCUSD BINANCE:BTCUSDT

#BTC/USDT is currently strongly bullish#BTC
The price is moving in a descending channel on the 1-hour timeframe. It has reached the lower boundary and is heading towards breaking above it, with a retest of the upper boundary expected.
We have a downtrend on the RSI indicator, which has reached near the lower boundary, and an upward rebound is expected.
There is a key support zone in green at 85249. The price has bounced from this zone multiple times and is expected to bounce again.
We have a trend towards stability above the 100-period moving average, as we are moving close to it, which supports the upward movement.
Entry price: 86624
First target: 87386
Second target: 88635
Third target: 90106
Don't forget a simple principle: money management.
Place your stop-loss below the support zone in green.
For any questions, please leave a comment.
Thank you.

BitcoinBitcoin has surpassed the $87,500 mark and has also broken through the key level of $90,000. As noted, the Inverse Head and Shoulders (IH&S) pattern has acted as a reversal signal. The market currently appears strong, as the price increase is supported by healthy trading volume. The next significant resistance level to watch for is $95,000, and it will be interesting to see how the price behaves at that point.
BTCUSD TO 100K!!!!!!BTCUSD made a breakouts off my internal structure highs yesterday without any valid pull back to the breaker block after my inducement am taking a long buy entry at 92k holding till price sweep liquidity at 100k which will be my next sell zone order

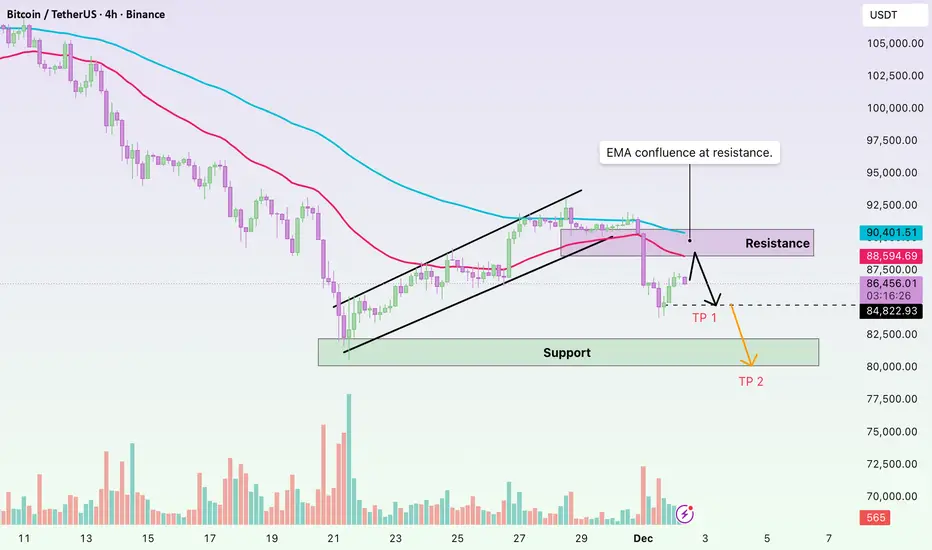
A Pullback Cannot Hide a Weakening TrendHello everyone, it’s Domic here ✌️
Looking at Bitcoin’s recent price action, you can probably feel that the latest drop wasn’t a random fall. The market completely broke through a multi-day equilibrium zone, and the moment BTC was repeatedly rejected at the EMA 89 and then lost the EMA 34, the balance of power shifted clearly toward the sellers.
Interestingly, right after that sharp breakdown, BTC bounced into a short-term pullback. This doesn’t signal a trend reversal; it’s simply the market’s natural reaction after falling too quickly: profit-taking from sellers, short-covering, and weak dip-buying flows creating a technical rebound — enough to rebalance the market, but not enough to change direction.
From a macro perspective, the signals are fairly aligned: US bond yields have risen again, the DXY has bounced from the 99 area, ETF inflows have weakened, and defensive sentiment ahead of upcoming US labour data has caused demand to dry up almost entirely. Crypto is simply being dragged along with the broader risk-off environment.
From a technical angle, BTC is trading below both the EMA 34 and EMA 89 — two downward-sloping moving averages indicating the trend remains bearish. The 4H breakdown accompanied by strong volume shows this is a real sell-off. BTC is currently pulling back to retest the resistance levels: 88,700–89,000 at the EMA 34 and 90,400–90,600 at the EMA 89. These zones will reveal whether selling pressure still dominates.
If sellers return aggressively, BTC may continue heading toward lower support regions: 85,500–86,000 is the first key area, followed by 83,000–84,000 — a demand zone that previously generated a strong bullish reaction. With the current momentum, the scenario where BTC at least touches the 85,500–86,000 support is becoming increasingly likely.
Which direction do you think the market is leaning toward? Feel free to share your perspective — and wishing everyone successful trading!
Times are changing.Monthly change of color with well below zero selling volume. Haven't seen this in a while.

Bitcoin Bitcoin highlighting recent price movement, supply–demand zones, trend structure, and potential trade planning.
Recently, Bitcoin experienced a sharp drop from the upper zone near 90K, breaking below the rising trendline and entering a corrective phase. After this strong bearish candle, price fell into a lower demand zone, where buyers stepped in again. This created a temporary support area around 84K – 82K
Resistance Zone: Around 90K – 92K shown in the red area. This is the region where sellers previously dominated and pushed the price down Bitcoin is now trading around $87,300–$88,000, where price is retesting a previous breakdown area. This zone acts as both resistance and a decision point.
If You find it helpful please like and comments for this post and share thanks.

Bitcoin (BTC) Update, is price at resistance ?Bitcoin reversed sharply into the point of control and is now consolidating under the channel-high resistance that has held for several days. This suggests buyers are losing momentum.
As long as BTC stays below this resistance, the market remains vulnerable to filling the lower inefficiency and rotating back toward the 78,000 support.
Key Points:
- Consolidation under channel-high resistance
- Short-squeeze rise filled lower inefficiencies
- Single-print region below remains vulnerable
What to Expect:
A clean reclaim of resistance is needed for upside. Failure opens the door to deeper corrective moves toward 78,000.
