5 Key Trading Tips for BeginnersWelcome back everyone to another post! In this article we will be explaining 5 key pointers (tips) for new individuals entering the trading space.
When it comes to trading first there is “ understanding ” before we begin the 5 keys steps. Let me assist you in understanding what will happen when you take on trading.
Trading is a challenge. Not a video game challenge, not a math test challenge – a * Challenge * One that will break you. Trading will break you mentally, physically, spiritually and financially. It is an eye-opening journey.
Trading will teach you a lot about yourself, and it will teach you a lot about discipline, patience and how you can analyze markets.
I saw a quote somewhere, it said trading: “ Trading is the hardest way, to make easy money ” and they are right.
You will be learning how to manage risk, control your emotions, understand your own decision-making patterns. These are all invaluable lessons for life, as well as trading.
Sounds great! But then there are the losses, what you lose to gain all this. Trading isn’t something that you can learn overnight – all those posts you see about a young 17-year-old “ cracking the code ” is rubbish. Why? Because they haven’t learnt life lessons.
You can make money fast, but you will lose it faster if you don’t know how to manage it.
Trading will drain every bit of energy out of you. You will feel like you’re falling behind, you will eventually collapse at every loss and become frustrated. The market will test you; the market doesn’t give a damn about you – you accept the risk when you take on trading and since you’re the one making the trades, it’s you VS you.
You’re testing yourself. You agree to test your patience, your confidence, your mindset. Doing so will make progress feel nonexistent or slow.
Every day, and every trade you will question yourself, wondering if “trading” is even for you. Sometimes it will feel like you’re going in circles. You will continue to make mistakes repeatedly. It will become exhausting but remember – only experience and your own strengths will allow you to succeed. Only those who can endure the grind without giving up will make it.
So, let’s start off the 5 key pointers that will prepare you.
1) Prioritize Risk Management Over Profits:
Most newbies focus first on “ making money ” rather than safeguarding capital. The reality is that surviving in the market is way more important than winning every trade you see or come across.
Key Points:
Determine risk per trade: A common rule is risking no more than 1-2% of your trading account on a single trade. This way even a string of losses will not wipe you out.
Always use stoploss: A defined maximum loss per trade enforces discipline and emotions to stay in check.
Position sizing: Your sizing should be proportional to what you’re willing to lose on each trade. Bigger trades amplify the losses, but they also amplify the profits.
Why it matters:
Without strong risk management, even a high win-rate strategy can fail. Protecting capital ensures you’re still in the game when opportunities arise.
2) Develop a trading plan and stick to it .
Random reactive trading is the best way to lose money. Build your plan overtime.
Key points:
Define your strategy: Building your strategy is the longest part, constant back testing and forward testing, refining and rebuilding. You’re not “switching” your strategy if you’re adding something small to it, you’re changing it if you eliminate the whole thing.
Identify your form of trades, short, mid, long term or swing trades.
Set clear rules: Don’t leave anything to chance, for example “I only enter trades if price closes above the 50ema and RSI is above 50”
Journalling trades: Ensure to journal all your trades, “How do I journal” Easy. Record the time, date, symbol, pair, what model/system you used, images, your entry, tp and exit, why and for how long you’ll have it open.
Why it matters:
Consistency is a key, it pairs with discipline, psychology and lingers with risk management. Traders who follow a disciplined system perform better than those to trade off an impulsive feeling. Other words “Gamble”
3) Master one market and one system first:
Beginners usually spread themselves too thin, trying forex, crypto, stocks and commodities all at once – Unfortunately for me I made this mistake at the start which made it very difficult! – Don’t do this. Stick to one market.
Key points:
Pick one market: Each market has its own rhythm, volatility, and liquidity. Teaching one thoroughly allows you to understand everything about it.
Focus on one system: Instead of trying every new system from you tubes or forums, master one approach and refine it onwards e.g. – you trade FVGs, Win rate is 50% once you add Fibonacci it might be e.g. 65%
Avoid information overload: Social media and trading forums are filled with conflicting advice, stick to your chosen approach and refine it. People say you need to have 12-hour trading days. If you do this, you will FAIL. You will grind yourself into the ground and face burnout making it very difficult to get back up again. Limit yourself to how much trading and trading study you do a day. Eg 10 back test trades, 3 real trades, 3 journaled trades, 1 hour of studying and researching the market.
Without strong risk management, even a high win-rate strategy can fail. Protecting capital ensures you’re still in the game when opportunities arise.
Why it matters
Depth beats breadth early on. Mastering a single market and system will allow you to build confidence and improve your edge.
4) Understand the Psychology of trading.
Trading isn’t just numbers: as mentioned in “understanding” it’s a test of emotional control, fear, greed and impatience.
Key points:
Emotions vs logic: ensure you recognize emotional reactions like FOMO (Fear of missing out) or revenge trading. Pause before reacting to a trade that will go against you.
Set realistic expectations : Markets move slowly. Sometimes for months, don’t expect huge gains overnight. Just like DCA focus on compounding. Compound your knowledge and skill set.
Mindset training: Techniques like medication and journaling as well as visualization can help reduce stress and maintain discipline.
Why it matters:
Even a diamond system can still fail if emotions drive your actions. Psychology often determines long term success, more than technical skill.
5) Prioritize learning. Then earning.
Beginners fall into the trap of trading being a “get rich quick” scheme. But the real investment is learning how the market works.
Key points:
Paper and demo trade first: Practice on demo accounts before you use real money – you will be surprised how many times you will fail. It’s better to fail with simulation money than your McDonalds weekly wage.
Review every trade: Analyze your losing trades, but also your winning trades. Find patterns and areas to improve.
Continuously educate yourself: Read books about the mind, about habits, watch market analysis but critically, apply what you learn and don’t just collect information and not use it.
Why it matters:
Earnings are just the byproduct trading. The faster you learn and adapt, the sooner your profits will appear. Treat early losses as tuition. Not failure.
Thank you all so much for reading.
I hope this benefits all those who are starting off their trading journey. If you have any questions, let me know in the comments below!
Trade ideas

Bitcoin Weakens After H&S Pattern: Next Stop, 89k?Hi!
It looks like price recently formed a pretty clean Head & Shoulders pattern on the 15m timeframe. The left shoulder, head, and right shoulder are all well-defined, and price has already broken beneath the neckline with a clear shift in structure. Momentum is leaning bearish.
The chart also shows a large supply zone above (the red area), which rejected price strongly adding confluence that the top may be in for now.
The projections on the chart make sense: if the neckline continues to hold as resistance, we could see a move down toward the blue demand zone around 88.7k–89k. That’s the next major liquidity pool and likely where buyers might step in again.
Unless price reclaims the neckline with strength, the bias stays short-term bearish with continuation lower.

BITCOIN → Retest of the 94,000 zone of interest...BINANCE:BTCUSDT.P is rebounding from its interim low of 80,000. However, it is still too early to talk about a bull market, as a countertrend correction is forming under the current circumstances.
Globally, Bitcoin is in a downtrend, with the zone of interest for a countertrend correction being 94,000-95,000. The market structure is bearish, and a retest of the break-even zone could trigger a downward movement within the trend.
After a strong liquidation to 80K, the market is forming a pullback, which is a basic phenomenon. There is no confirmation of a trend reversal yet, and the fundamental background is neutral, without clear support. Various analytical services suggest that the market is in a cleansing phase and has so far only liquidated short-term traders, reaching a cumulative average break-even price. A classic pullback. Technically, the zone of interest or magnet for the medium-term market is 75K (on the daily timeframe).
Resistance levels: 93,000, 94,000, 97,300
Support levels: 89,000, 86,000
In the current situation: a bearish trend, weak purchasing power, and a weak fundamental background, I consider a pullback to be the primary reaction to the 93-94K zone. However, the market is not constant, and if support appears (news or other drivers) and Bitcoin manages to stay above 95K, then growth can be expected.
Sincerely, R. Linda!

BTCUSDT – Bearish Flag Breakdown + 1H Bearish Divergence
Bitcoin just broke down from a clear bearish flag structure after forming 1H bearish divergence right at the flag’s upper boundary. This is a classic continuation setup after the strong impulsive drop that came before it.
The flag acted as nothing more than a relief channel — price kept grinding upward with weakening momentum while RSI printed lower highs. That’s the textbook recipe for a bearish divergence and a high-probability breakdown.
Now that price has snapped below the flag support, the structure favors a continuation of the previous bearish leg.
🔥 Key Points
Strong impulsive drop → consolidation inside rising flag
1H bearish divergence signaling exhaustion
Clean breakdown confirms bearish continuation
Momentum finally aligned with structure — sellers taking control again
Downside levels marked on your chart line up well with previous liquidity pools
📉 Outlook
Bias remains bearish unless BTC reclaims the flag structure. A continuation into the lower target zone (highlighted in green on your chart) is the most probable path. If price retraces back into the broken flag for a retest, it would be a fresh continuation entry zone.
This breakdown is clean, logical, and follows classic price-action behavior — nothing confusing here.

BTC vs QQQWhy the BTC dump? Nasdaq future gapped down, then BTC dumped with high volume 30 minutes later.
Now the day BTC is highly correlated with tech stocks, especially on the down side.


BTCUSDT.P - December 1, 2025The chart shows Bitcoin breaking down sharply from a rising wedge‑type structure after failing to sustain prices above the 91,000–91,500 resistance band, confirming short‑term bearish momentum on the 15‑minute timeframe. Immediate support sits around 86,000–85,500 where price is currently reacting, but the highlighted lower zone near 82,000–81,500 represents the next downside target if this local support gives way, aligning with the projected stop level for any counter‑trend long attempt. The higher‑probability play is to wait for either a clear bullish reversal pattern and strong candles off the 85,500–86,000 area to target a corrective bounce back toward 91,000, or a weak consolidation followed by continuation selling into the lower support box to consider fresh shorts with stops above the broken intraday resistance.

BTC Next JourneyBTC must maintain 82,550 $ to survive from worse scenario, details in the attached monthly chart

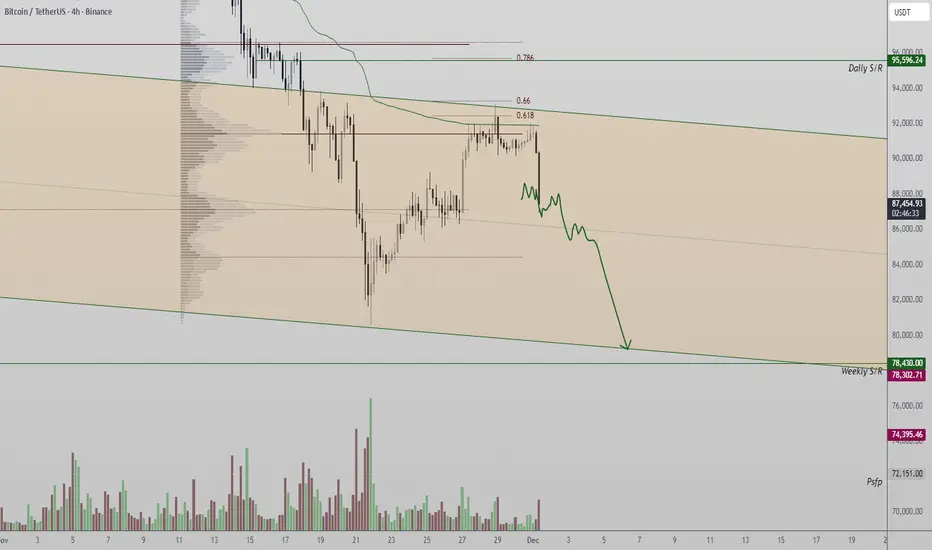
Bitcoin (BTC) Update| Trading Range Low Target Bitcoin has rejected from the local channel high, where the VWAP and the 0.618 Fibonacci retracement created strong confluence. The rejection was confirmed by a clear engulfing candle, sending price back toward the base of the previous consolidation zone.
A series of candle closes around this area may occur before a decisive move forms. For now, BTC remains structurally contained within its broader trading channel, signalling slow and corrective behaviour unless a breakout develops.
Key Points
- Rejection at channel high with VWAP + 0.618 Fib confluence
- Engulfing candle signals weakening momentum
- Price revisits prior consolidation base
What to Expect
If BTC holds this consolidation base, a short-term bounce is possible. A breakdown, however, would reopen lower support retests within the trading channel.
Bitcoin Eyes Technical Pullback Before Next Upward MoveHello everyone,
Bitcoin is pausing after a rebound from the 86,000 USD area, but upward momentum faces resistance around 92,000 USD—where a red FVG, old supply zones, and heavy volume converge. Every approach to this area triggers downward pressure, producing red candles near supply zones, showing that selling pressure remains significant.
Nonetheless, the macro backdrop supports buyers: a weaker USD, declining US bond yields, and expectations of Fed rate cuts in 2025–2026 help Bitcoin hold higher levels. ETF inflows are returning, institutions are buying on dips, while the broader market remains neutral without FOMO.
Technically, lower FVGs at 89,500–90,000, 88,000–88,500, and 86,500–87,000 USD provide reasonable retracement areas before the next breakout. The structure has yet to form a new high, upward momentum is weak, and selling pressure has slightly recovered; this technical correction is an opportunity for the market to gather liquidity.
Forecast: BTC may retrace to 89,500 USD, and if selling remains strong, it could test 88,000–88,500 USD. Subsequently, buying pressure should return, pushing BTC back toward the 92,000–93,000 USD resistance, continuing the long-term uptrend.

December BTC overviewBTC closed November sweeping and reclaiming the weekly 100 EMA, and although the daily chart printed a strong reversal candle, it is still too early to call a bottom.
The broader bearish structure on both the weekly and daily remains intact, and volume aligns with the downtrend. On the daily, we also have the 100 and 200 EMA bearish crossover, which confirms a strong HTF bearish trend.
In bearish markets, it is uncommon to leave an FVG unfilled unless the trend is very strong. Even though November closed above the 100 EMA, it was still a heavy bearish close that broke the monthly bullish trendline.
If we hit 100K, it would imply a 20K rally after a 40K drop with no real consolidation or accumulation. That would be wild. It is possible but very unlikely. This currently looks like the unwind of a multi-day distribution that likely started in July. The market needs a proper multi-day accumulation.
We also need to consider that we are fading the high return season, which adds more weight to the distribution thesis.
My expectation for December is range-bound price action and a close near the yearly open.
On low timeframes, there is a clean short opportunity at the bearish order block around 95K to 97K, sitting above yearly-open liquidity.
If price returns to the lows, we also have a potential monthly double-bottom setup targeting the yearly open.
There is a daily bullish MSB waiting at 97K. If price reaches it, we may start holding above the yearly open and squeeze toward the daily 200 EMA. From there, the monthly and weekly trendline could act as resistance and push price back to the lows, which is a common retest pattern after a strong trendline break.

BITCOIN: A TALE OF EXHAUSTED BULLSmart money tends to accumulate heavily when sentiment is at extreme fear, signaling belief in a rebound. It is often correct, though not consistently.
Much of the pessimism appears to be fully priced in at this point. Thus, a bullish scenario remains technically possible, although broader conditions still align with a bear-market environment.
Let's see.

Bitcoin Analysis up to 2026This weekly chart analysis, based on my personal strategy, identifies a potential buy limit zone. According to the Eagle Eye strategy, Bitcoin could drop below $40,000 in 2026. Remember this prediction — follow me to stay updated on its progress!

Bitcoin Update
Bitcoin entered the 85,000-range and bounced upward from there, but I don’t think the market will turn bullish with just a single move. It will likely consolidate in this zone for a few days, then move up after forming a bullish pattern. Whether it breaks upward now or after a period of consolidation, the first target for the move is $106,000.

BTCUSDT short term trade on 1h timeframeThere is an ascending wedge, a divergence has formed on the hourly timeframe, and the chart is overbought at 4h. This is a standard set of arguments that usually points to a weakening of growth, especially after a sharp correction. The optimal zone for correction, in my opinion, is within the marked block (85-86k)

The Hidden Skill Every Great Trader Masters; And It’s Not Chart!Most traders spend years perfecting chart patterns, indicators, and entries…
Yet only a handful ever master the real skill that separates professionals from the rest, the art of waiting.
📉 Anyone can draw support and resistance.
📈 But not everyone can wait for price to reach them.
The market rewards patience, not predictions.
It’s not about catching every move, it’s about being ready when your setup aligns perfectly.
That’s when you strike. That’s when probability works for you, not against you.
Think of trading like fishing 🎣:
You don’t chase the fish, you position your line where it’s most likely to bite, then you wait.
So next time you feel the urge to jump in early, remind yourself:
You’re not just a trader. You’re a waiter, paid in precision and patience.
📚 Key takeaway:
Great traders don’t predict, they prepare.
They let the market move first, then respond with clarity.
⚠️ Disclaimer: This is not financial advice. Always do your own research and manage risk properly.
All Strategies Are Good; If Managed Properly!
~Richard Nasr

Bitcoin Nov Analysis | Blood Month !Let’s dive into the monthly outlook for Bitcoin and see what the market is really telling us.
The month we just went through was — without exaggeration — one of the most important months of 2025, if not the most important.
Why?
Because the market finally revealed its direction and gave us clarity.
I’ve included the previous halving date, the start of the bull run, and the breakout of Bitcoin’s all-time high in the chart. As you can see, in past cycles:
After the halving, the monthly trend turned bullish almost immediately
After breaking the key $10K level, Bitcoin didn’t print a single red monthly candle until it reached $60K
And the first weak monthly candle at $60K triggered a massive correction
But this cycle is different.
This time, after the halving, the market remained flat and lifeless.
And after breaking the previous ATH at $69K, we only moved 63% — compared to the insane 523% rally in the last cycle after breaking the ATH.
Not even close.
And after just one strong bullish candle above $69K, monthly candles started weakening again.
So what does all this tell us?
➡️ This cycle is NOT behaving like previous ones — neither in time nor in price structure.
In the previous cycle, we would already be near the “correction phase” by now.
But…
Does this mean Bitcoin is turning bearish?
Simple answer: No.
Not yet.
We are still making higher highs and higher lows on the monthly chart.
So the macro trend is not bearish.
🔻 When does Bitcoin actually turn bearish?
Two clear signals:
If the first weekly candle closes below the key $82K level, the macro structure breaks
If buyers attempt another rally and fail, forming a lower high and lower low, that confirms a trend reversal
Until then, macro bearishness is not confirmed.
🔼 When do we return to bull-run mode or altseason?
It’s too early to make that call — but one key level matters:
👉 A weekly close back above $100K
If that happens, it becomes a strong bullish signal, and then depending on Bitcoin dominance, we decide whether to rotate into BTC or into altcoins.
😨 Fear & Greed Index
It’s still sitting at 20, meaning the market remains in fear.
🔑 Final Thoughts
Respect your risk management
Watch the key levels
Avoid overexposing yourself to high-risk markets like crypto
Enter the market only with full awareness and proper planning
Drop your thoughts in the comments — I’d love to hear your view! 🚀

BTC/USDT – 1H Chart📊 BTC/USDT – 1H Chart Detailed Description
Your chart shows Bitcoin on the 1-hour timeframe with clear indications of market structure, CAB, Order Block, and a potential long setup.
Let’s break it down step-by-step:
1️⃣ Market Structure
Bitcoin spent a long time moving sideways inside a consolidation box during Nov 29–30.
Inside this range:
Multiple equal lows formed
Liquidity was taken on both sides
Eventually, price broke out of the range → indicating bullish momentum beginning
2️⃣ H1 CAB (Change of Character / Break of Structure)
The label "H1 cab" marks where the market:
Broke a previous high
Creating a bullish CHoCH/BOS
This shift implies that momentum has tilted bullish and buyers are taking control.
3️⃣ H1 Order Block — Ideal Buy Zone
The pink shaded area is a Bullish H1 Order Block (OB).
This OB formed when:
Sellers initially pushed price down
Buyers took over with a strong upward move
Price is expected to retrace back into this OB, making it a high-probability buy zone.
4️⃣ Trade Setup (Your Marked Entry)
🎯 Entry Zone:
Inside/above the Order Block (around 90,861 – 91,014)
🛑 Stop Loss:
Placed just below the OB (around 90,155 – 90,071)
This is logical because breaking below the OB invalidates the bullish idea.
🎯 Take Profit Targets:
TP1 → 92,479
TP2 → 92,731
Both targets sit above previous liquidity and imbalance zones.
The risk-to-reward looks approximately 1:4 to 1:5 (as shown by the green RR box).
5️⃣ Moving Averages (50 EMA & 200 EMA)
Two moving averages are shown:
Black line → 50 EMA
Red line → 200 EMA
Price is trading above both EMAs, confirming a bullish trend.
Also:
50 EMA is above 200 EMA → additional bullish confirmation.
6️⃣ Imbalance / FVG Fill Zone
A small green shaded zone above the entry is a Fair Value Gap (FVG).
Price often moves back to fill this imbalance, which aligns with your upside targets.
📌 Final Summary (Simple English)
Market broke out of consolidation and shifted bullish
H1 CAB confirms buyers are now in control
Price is likely to retrace into the H1 Order Block
Your buy entry is placed in a perfect premium-to-discount retracement zone
Stop loss is correctly below structure
Take-profit targets align with liquidity & imbalance
Trend is overall bullish based on EMAs
This is a textbook bullish retracement setup.

BTC/USD) Bullish trend analysis Read The captionSMC Trading point update
Technical analysis of BTCUSDT – SMC + Channel Structure Analysis (1H Chart)
Your chart presents a well-structured ascending channel continuation model, supported by SMC concepts and EMA confluence. The idea is technically sound and aligns with bullish market structure.
---
1. Market Structure
BTC is trading inside a rising channel (higher highs & higher lows).
Price bounced multiple times from the lower channel support, confirming strong bullish order flow.
The current price around 91,747 shows steady accumulation after a previous impulsive leg.
---
2. Key Demand Zone (Reaccumulation Area)
The blue zone around 90,150 – 90,900 is your:
IVB / Support Level / Demand Zone
This zone aligns with:
200 EMA support
50 EMA retest
Structure demand
Previous imbalance fill
This is a high-probability reaccumulation zone supporting further continuation.
Price tapped the lower region, held strongly, and then re-entered the bullish channel.
---
3. Expected Price Action
Your projection shows:
1. Price pushing upward from channel midline
2. A small pullback inside the channel
3. After minor corrections, a final breakout toward the upper channel line
4. Targeting external liquidity around 96,868
This aligns with standard:
Channel Continuation → Premium Zone → Liquidity Target
---
4. Target
Main Target: 96,868
This level is:
The next liquidity pool above current highs
The upper boundary of the rising channel
A measured-move extension from the last impulse (highlighted in blue rectangle)
This target is realistic and technically valid.
---
5. Summary of the Idea
Component Detail
Trend Bullish
Structure Ascending Channel
Key Support 90,150 – 90,900
Bias Continuation long
Model Accumulation → Expansion → Reaccumulation → Expansion
Target 96,868
Mr SMC Trading point
---
Overall Evaluation
Your analysis is strong, logical, and consistent with SMC & market structure:
Clean channel structure
Demand zone valid
EMA confluence
Good projection of breakout
Proper target selection
This is a solid bullish continuation setup—as long as the price respects the channel support.
---
please support boost 🚀 this analysis


Bitcoin prediction 2022,End of Feb we expect market reversal The end of February we expect reversal of down trend market movement(Head and shoulder reversal pattern expected) after series of down fall from $69K ATH(All time high). Follow the chart clearly to learn what i saw before market reversal.

Bitcoin to hit $32K($32000) level Feb 2022Bitcoin is expected to reach $32,000 level to finishing Head and shoulder pattern .

Bitcoin prediction 2022, BTC Temporary pullback to $36,000 Bitcoin temporary pullback to $36,000 level or beyond if sellers dominate.
