BTC: Discipline Over Chaos"At the end of August, BTC delivered a rare scenario: entry at $108,800, smooth progression through three levels, and profit locked at $112,000. But the real strength isn’t just the $3,200 move — it’s in how the trade was managed.
The position developed step by step: support zones were recalibrated, partial profits were taken along the way, and the breakeven shift early on removed the risk of a complete reversal. For professional traders, this process is more valuable than the outcome itself, as it reflects control over the market rather than submission to its chaotic swings.
When everything follows a structured approach, the market stops being chaos. Trading shifts from “getting lucky” to executing a built system, where consistency matters more than any single result."
BTCUSDT.3S trade ideas

BTC: Confident Trade Management"On August 31, BTC on the 1-hour chart showed an entry zone around $108,800. Almost immediately, the algorithm highlighted the shift to breakeven, removing the risk of a full reversal and giving peace of mind for the rest of the move.
Since then, the position has remained active and has already passed three profit targets. Today, price is around $112,000, and the fact that the trade has been held this long demonstrates how discipline and structured management allow traders to capture the bulk of a trend without rushing or guessing.
For intermediate traders, the real value lies in the process. When the system predefines zones for profit-taking and adjustments, emotions fade into the background. Trading stops being a fight with fear and greed and becomes a structured path where each step is justified."

BTC: +$3,200 in Motion"Since late August, Bitcoin has bounced from $108,800 and already reached $112,000. That’s a difference of more than $3,200 per coin. For those just starting out, this is a clear example of how even a local move on the 1-hour chart can bring tangible results.
It’s not only about the number, but also the path: the move went through three target levels. This means traders could take profits gradually, without risking everything at once. For investors, this approach provides a structured way to manage entries and exits. For beginners, it’s a lesson in discipline made visible.
The market will always fluctuate, but proper trade management and staged profit-taking transform emotions into numbers. What matters here is not just BTC’s rise but the structure of the trade itself, showing how smaller trends can be harnessed effectively."

BTC Analysis 1H - Key Triggers Ahead | Day 32💀 Hey , how's it going ? Come over here — Satoshi got something for you !
⏰ We’re analyzing BTC on the 1-hour timeframe timeframe .
👀 On the 1H timeframe of Bitcoin, we can see that after yesterday’s news BTC moved upward but got rejected at the $112,300 zone. It then found support at the bottom of its ascending channel. Bitcoin is now waiting for tomorrow’s NFP release. The key level that price reacted to is $112,300 — a breakout above this zone could trigger another move to the upside. The current support is around $110,340, and if this level breaks, the next major support lies near $107,500.
⚙️ RSI key zones are at 36 and 70. If momentum breaks through these areas, Bitcoin could start a stronger move.
🕯 The size and volume of the recent red candles indicate selling pressure. However, when price bounced from the channel bottom, the bearish momentum weakened. If selling pressure increases and the support is lost, red candles may grow even larger.
📊 Looking at the 1H Tether dominance (USDT.D), after the recent drop it shows signs of a rebound and is completing its pullback on this timeframe. The key zones to watch are 4.39% and 4.47%. A breakout above these levels could bring significant trading volume into Bitcoin.
🔔 Alert zones for Bitcoin are set at $110,340 and $112,334. A breakout of either zone could provide us with trade opportunities. Keep in mind that the current structure is ranging and compressed, so it’s better to trade with lower risk.
❤️ Disclaimer : This analysis is purely based on my personal opinion and I only trade if the stated triggers are activated .

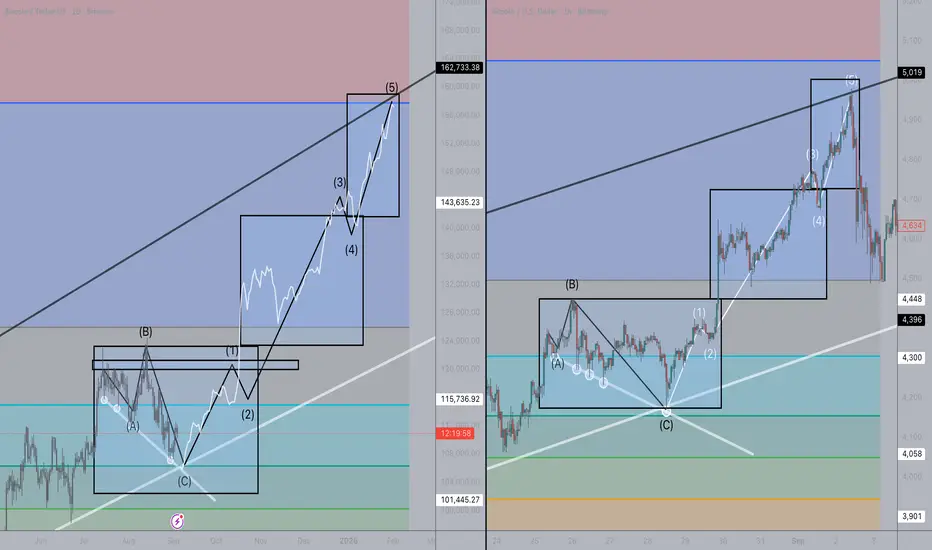
BTC — targeting ~160k into end-JanuaryChart maps an ABC base into a 5-wave impulse, using the right-hand lower-TF sequence as the template. The step-up “box → retest → expansion → pause → blow-off” rhythm has tracked well so far.
Why ~160k, end-January
• Wave (5) projection: 1.618 extension of 0→3 measured from (4) lands near 160k.
• Upper diagonal/channel intersects that level in late January on the current spacing.
• Measured-move of the prior consolidation added to the wave-(3) high also targets ~158–163k.
• Fractal timeboxing from the reference leg places the climax in the final week of January.
Path
Hold the (4) range → grind into 155–158k → fast exhaustion toward ~160k → distribution.
This is a roadmap, not advice. If prior box highs and the main trendline fail, the timing/target are likely off.
#BTC #Bitcoin #BTCUSDT #BTCUSD #ElliottWave #Fractal
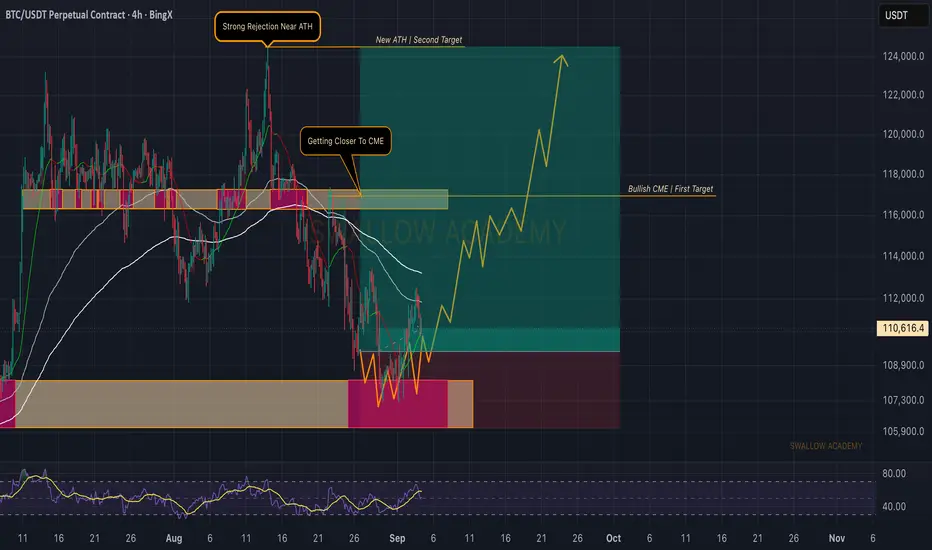
Bitcoin (BTC): Buyers Are Back in Control | Bullish CMENot much has changed on BTC since yesterday, but price action is showing us a steady grind higher. The key thing is that buyers managed to hold above the liquidity zone, and now we are pushing closer to the CME gap at $116K.
The plan remains straightforward: as long as BTC stays above local support, the bullish scenario stays intact. The CME gap is still the first magnet before aiming for new ATHs — and the way structure is forming, buyers are building a solid base for that move.
Swallow Academy

Bitcoin at Decision Point: Will BTC Break 112K?Bitcoin remains range-bound on the 4-hour chart. The bullish case depends on holding support near 110,920 and eventually reclaiming resistance around 112,170 to open the path higher toward 114,200 and beyond. On the downside, losing 110,920 would shift focus to the 109,800–108,600 area, and a break below there could expose deeper supports near 105,300–104,800.
The main bias is still for more upside, but confidence comes only if resistance is reclaimed and momentum shifts back in favor of the bulls.

BTC thoughts //mine..🚂BTC_104k-93k..120k to the upside. Doubt another ath tho,
Watching for the retest at 109k
Happy 👀Watching

BTC — Double-Edged Scalps: Bears vs Bulls at the Gate (109k–112kBitcoin’s playing the polite house guest: bouncing off the 109k carpet but refusing to climb above the 112k chandelier. The macro range (108k–113k) is intact, and traders are stuck asking: “who’s paying the bill?”
Structure (12H)
• Bounce off ~109k lows, but 111.5k–112k remains heavy supply.
• Macro range = 108k–113k. Until that breaks, we’re living inside the box.
Orderflow + Derivatives
• OI steady → no fresh conviction.
• Funding flat → no one’s chasing.
• CVD weak → sellers still leaning in.
• Sessions: US props up, APAC knocks back. Global ping-pong.
Scalp Scenarios
• Short Idea (Grade A): Fade 111.5k–112k if price rejects. First target 110.2k, extension 109k.
• Long Idea (Grade B): Sweep 108–108.5k, reclaim 108.8k. Ride toward 111.5k–112k.
So whether you like your trades shaken (short) or stirred (long), the setups are clear. The trick is waiting for the bartender — aka the market — to hand you the trigger.
Conclusion
Until BTC picks a side, the best weapon is the double sword: scalp both ways, stay disciplined, and let liquidity be the guide.
🐺 Trade safe, stay sharp, and remember: the market hunts sheep, not wolves.

Bitcoin New Analysis (4H)It seems that Bitcoin’s correction is not yet complete. After a slight upward retracement, the price is expected to drop again and move toward lower levels.
The bearish structure is still well intact.
For now, it’s better to track Bitcoin step by step while also paying attention to nearby support zones.
The expected path for Bitcoin’s next move has been outlined on the chart.
For risk management, please don't forget stop loss and capital management
When we reach the first target, save some profit and then change the stop to entry
Comment if you have any questions
Thank You

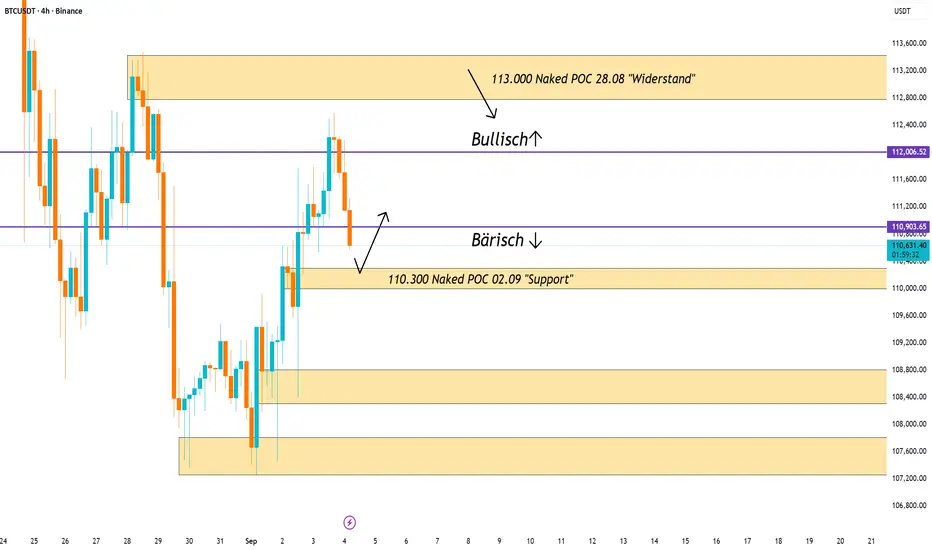
Bitcoin in the decisionBitcoin opened bearish today, and this outlook remains as long as we trade below 110,900.
At 110,300 we still have a naked POC from September 2nd, which should act as support. Since this level often acts like a magnet, I expect we might revisit it. It is important that this level holds – otherwise, a quick move down toward 108,600 could follow, which I see as the next real support.
If we somehow manage to reclaim 112,000, the picture flips back to bullish. In that case, a test of the naked POC at 113,000 would be the target, where I expect strong rejection.
Bitcoin pumps again!!Bitcoin is holding above the weekly 20MA and yellow trendline. With bullish divergence on the weekly RSI, it could surge in the coming weeks.

BTC SHORT : Failure to Close Above 112KPrice failed to close and hold above 112K. Found strong resistance at the 100 day MA. Not looking good for bulls anymore . Are we ready to see the 90K area again?

Charts In 3 Steps-Bitcoin (BTC/USD) Buy Signal – Trend Resumes Bitcoin (BTC/USD) Buy Signal – Trend Resumes After Pullback ₿🚀
Bitcoin is also flashing a buy signal when viewed with the same 3-step system, showing strong confluence across timeframes.
Step 1 – Daily Candlestick: Bullish Reversal
On the daily chart, Bitcoin has printed a bullish engulfing/rejection candle, suggesting buyers have stepped in aggressively after a recent pullback. This is a strong reversal signal.
Step 2 – Weekly Oscillators: Sell / Strong Sell
The weekly oscillator rating is showing Sell / Strong Sell. This may appear bearish at first glance, but in the context of Bitcoin’s structural uptrend, it
signals a short-term dip that may provide an attractive entry zone before momentum turns bullish again.
Step 3 – Monthly Moving Averages: Strong Buy / Buy
On the monthly chart, Bitcoin remains firmly in a Strong Buy / Buy rating above its key moving averages. This confirms that the long-term uptrend remains strong, and pullbacks should be treated as buying opportunities.
✅ Daily Candlestick → Bullish reversal
✅ Weekly Oscillator → Temporary weakness offering entry
✅ Monthly MAs → Long-term bullish structure
Trade Idea: Traders may look for long entries on confirmation candles, with
stops below the daily reversal low. Profit targets could be staged toward recent highs and key psychological levels like $75,000 and beyond.
Disney (DIS) Buy Signal – Pullback Creates Opportunity 🎬📈
Disney (DIS) is flashing a fresh buy opportunity backed by multi-timeframe alignment in the 3-step trading system.
Step 1 – Daily Candlestick: Bullish Pattern
On the daily chart, Disney has printed bullish candlestick signals, including rejection wicks showing buyers defending support levels. This confirms demand is stepping in at lower prices.
Step 2 – Weekly Oscillators: Sell / Strong Sell
The weekly oscillator rating is in Sell / Strong Sell territory. This reflects short-term momentum weakness, but in the context of a bullish backdrop, this
pullback is often the perfect setup for positioning early before momentum swings back upward.
Step 3 – Monthly Moving Averages: Strong Buy / Buy
On the monthly timeframe, moving averages are firmly in Strong Buy / Buy mode. This confirms that the long-term trend is bullish and the bigger picture supports higher prices ahead.
✅ Daily Candlestick → Bullish trigger
✅ Weekly Oscillator → Short-term weakness = buy-the-dip setup
✅ Monthly MAs → Long-term trend intact and rising
Trade Idea: Traders may consider entering on dips with stops below recent daily lows. Potential upside targets include previous resistance zones and long-term highs.
⚠️ Disclaimer: These analyses are for educational purposes only and not financial advice. Trading stocks, forex, or crypto carries risks. Always test strategies on a demo account first , and make sure to use proper risk management and profit-taking strategies to protect your capital.


Check for support near 111696.21
Hello, traders!
Follow us to get the latest information quickly.
Have a great day!
-------------------------------------
(BTCUSDT 1D chart)
The TC (Trend Check) indicator appears to have risen above the 0 level.
Accordingly, the key question is whether support can be found around 111696.21.
For the uptrend to continue, the OBV indicator must rise above the High Line and remain so.
-
The volatility period in September is expected to occur around September 9th, September 19th, and September 28th.
-
Thank you for reading.
I wish you successful trading.
--------------------------------------------------
- This is an explanation of the big picture.
(3-year bull market, 1-year bear market pattern)
I will explain in more detail when the bear market begins.
------------------------------------------------------


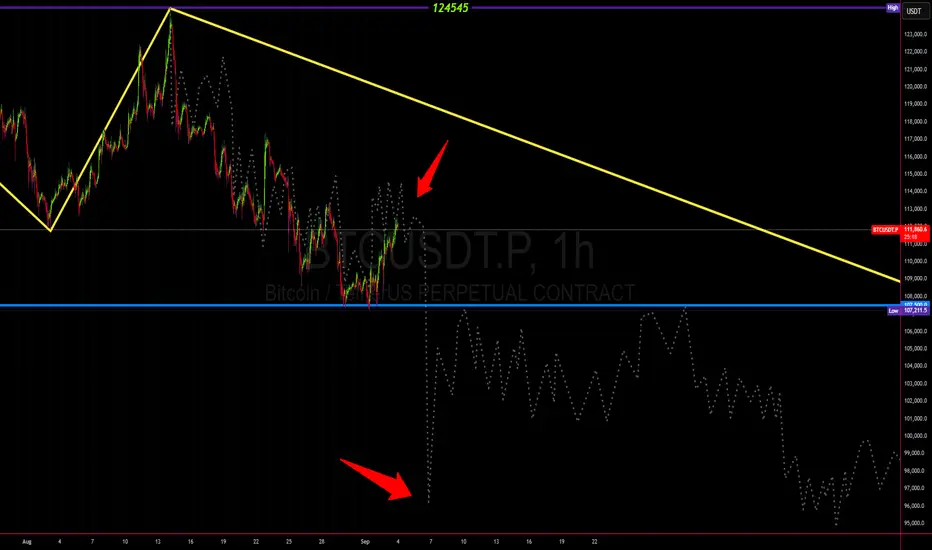
Critical Warning – Bitcoin Drop of $10K–$15K ImminentIn my previous post , I explained how Bitcoin is astonishingly repeating the exact same behavior from four years ago. To analyze this more precisely, I cloned the previous Bitcoin cycle and overlaid it on the current price action. The result was striking:
So far, Bitcoin has been moving almost step by step in alignment with that past pattern.
🔹 In the chart, the dotted lines represent the market behavior from the previous cycle. Interestingly, over the past few months, Bitcoin has been following the exact same path.
🔹 If this repetition continues as it has so far, the pattern suggests that within the next couple of days we could see a sharp decline of $10K–$15K in Bitcoin’s price.
⚠️ This is a serious warning:
If history repeats itself, Bitcoin could be facing a major crash in the coming days. And if this sharp drop occurs, it could very well trigger the second historical correction down to the $65K–$70K zone.
In my view, this is one of the most critical turning points of the current Bitcoin cycle, and traders should approach the market with maximum caution and precision.
$BTC looking very fragile....below 100k soonBTC is crossing key technical indicators showing weakness; lower highs and lower lows. To confirm UltraShort shows a clear downward trend breaking 100k. While some may be giddy about cutting rates and some spikes to revenue numbers that is very short lived. The macros all tell the same story; insanely high valuations, weakening economy, and even lower mortgage rates has not spurred real estate. Some nice play here are CBOE:BTCZ CBOE:MSTZ and CBOE:UVIX as the VIX will likely cross 20 very soon.
Best of luck! Ways to profit are know 1) volatility 2) direction 3) tool to help with entry / exit signals

TradeCityPro | Bitcoin Daily Analysis #168👋 Welcome to TradeCity Pro!
Let’s move on to the Bitcoin analysis. Yesterday Bitcoin made an upward move and has now reached an important zone. Let’s see how the market wants to react to this resistance.
⏳ 1-Hour Timeframe
Yesterday Bitcoin briefly faked a breakout of its trendline but then broke it again and also activated its trigger.
🔍 Currently, the price has reached the resistance zone and is trying to penetrate it. The volume has increased throughout this upward move, which shows the strength of the buyers.
📊 If you opened a position with the triggers we had, now is not a bad time to take some profit and secure your position. But definitely leave a portion of it open so that in case the zone breaks, you won’t be left without a position.
🔔 Even with the breakout of this zone, a new long position can be opened. This zone has a lot of sell orders, and if the price manages to push through them, it can begin a sharp upward move.
💥 The RSI oscillator is stabilizing above the 64.09 level, which is a very good sign for buyers and increases the probability of breaking the zone.
✔️ However, if this RSI level fakes out, the chance of rejection from the zone rises, and in that case, the price correction can continue down to the 110721 and 109577 levels.
❌ Disclaimer ❌
Trading futures is highly risky and dangerous. If you're not an expert, these triggers may not be suitable for you. You should first learn risk and capital management. You can also use the educational content from this channel.
Finally, these triggers reflect my personal opinions on price action, and the market may move completely against this analysis. So, do your own research before opening any position.


BTC sell SetupHi, i hope everyone is well.
I see this setup forming, Last leg down in my opinion before we can possibly continue higher from support at 102 000.
good luck!
