Bullish Deep Crab + Double Bottom at PCZPattern Identified: Bullish Deep Crab (0.886B/1.618XA with 2.0 BC Projection Confluence) with strong confluence at Potential Reversal Zone (PRZ).
Key Confluence:
Retracement Profile: Dual 0.886 retracements at B and C indicate powerful but potentially exhausted counter-trend momentum
Perfect Crab R
Key facts today
Next report date
—
Report period
—
EPS estimate
—
Revenue estimate
—
7,840 COP
13.41 T COP
193.34 T COP
1.17 B
About Nike, Inc.
Sector
Industry
CEO
Elliott J. Hill
Website
Headquarters
Beaverton
Founded
1964
ISIN
US6541061031
FIGI
BBG01PP4SRW2
NIKE, Inc engages in the design, development, marketing, and sale of athletic footwear, apparel, accessories, equipment, and services. It operates through the following segments: North America; Europe, Middle East & Africa; Greater China; Asia Pacific & Latin America; Global Brand Divisions; Converse; and Corporate. The North America; Europe, Middle East & Africa; Greater China; and Asia Pacific & Latin America segments refers to the design, development, marketing, and selling of athletic footwear, apparel, and equipment. The Global Brand Divisions represents NIKE Brand licensing businesses. The Converse segment designs, markets, licenses, and sells casual sneakers, apparel, and accessories. The Corporate segment consists of unallocated general and administrative expenses. The company was founded by William Jay Bowerman and Philip H. Knight on January 25, 1964 and is headquartered in Beaverton, OR.
Related stocks

Nike poised for 2026 reboundWe keep coming back to the line attributed to Nike's CEO Phil Knight, “The cowards never started and the weak died along the way. That leaves us.”
Nike shares have slumped over the past 12 months, down roughly 17 to 18 percent. The weakness reflects a tough consumer stretch and pressure across g

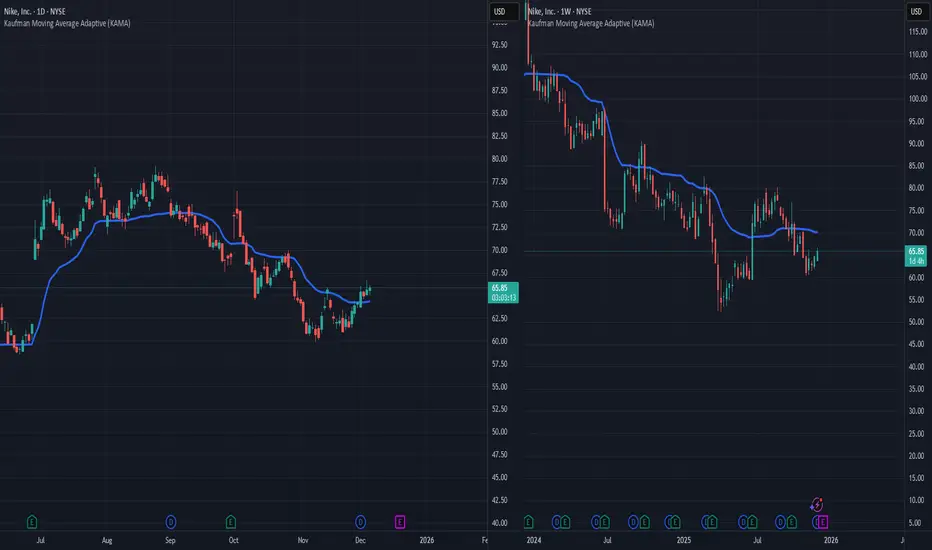
NKE // As long as we are above the Kaufman support on the daily time frame, the direction is up. Our first resistance point is the Kaufman indicator on the weekly time frame.
Just Bounce ItNike is currently testing the middle of a key weekly gap around the $70 level, a zone that has historically acted as a springboard for bullish momentum. A breakout above $70.75 would confirm renewed strength and open the path toward the $82.25 resistance.
NKE is also coming off oversold levels, sig

NKE Longdemand Zone
Long entry 61.5
Stop 58,
Target 70, 80
Risk management is much more important than a good entry point.
I am not a PRO trader.
In my trading plan, the Max Risk of each short term trade should be less than 1% of an account.

NKE long idea Long CALLS NKE at 68. 6 weeks expire. SMT in the lows with SP500, this pattern indicates strong demand on NKE.

NKE Weekly Swing Insight – Bearish Bias Despite Bullish Market"QuantSignals V3 – Katy AI
Analysis Type: Swing (17-day horizon)
Current Price: $62.50
Trade Direction: BUY PUTS
Strike Price: $62.50 PUT
Entry Range: $1.85 – $2.15
Target 1: $3.50 (+67%)
Target 2: $4.80 (+123%)
Stop Loss: $1.10 (≈40% loss)
Expiry: 2025-12-12
Position Size: 3% of portfolio
Confidenc

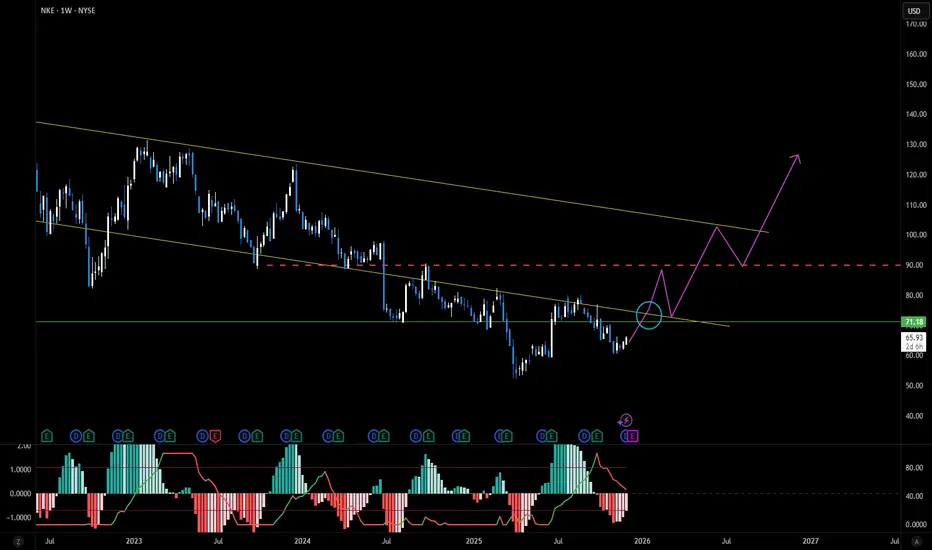
Simultaneously support and trend breakout expectationExpecting support and trend breakout at the same time, then reaching 90 for resistance
and retest and target 100 for the trend line. ** Not for trading advice
NKE 1HR Trend Zones
This analysis is shared strictly for educational purposes and is not financial advice. It is intended to illustrate chart-reading techniques, structure mapping, and scenario planning.
UP TREND (marked in yellow/orange)
A horizontal dotted line above the central region highlights where

NKE – Swing/PositionNike is a globally recognised brand with strong distribution, and at current price levels (~$62.50) it offers a potential low-risk entry into a long-term leader in footwear/apparel. The staggered entry zones allow you to build a position as price consolidates or corrects. Pull-backs to $58 or $53 of

See all ideas
Summarizing what the indicators are suggesting.
Neutral
SellBuy
Strong sellStrong buy
Strong sellSellNeutralBuyStrong buy
Neutral
SellBuy
Strong sellStrong buy
Strong sellSellNeutralBuyStrong buy
Neutral
SellBuy
Strong sellStrong buy
Strong sellSellNeutralBuyStrong buy
An aggregate view of professional's ratings.
Neutral
SellBuy
Strong sellStrong buy
Strong sellSellNeutralBuyStrong buy
Neutral
SellBuy
Strong sellStrong buy
Strong sellSellNeutralBuyStrong buy
Neutral
SellBuy
Strong sellStrong buy
Strong sellSellNeutralBuyStrong buy
Displays a symbol's price movements over previous years to identify recurring trends.
US654106AG8
NIKE, Inc. 3.375% 01-NOV-2046Yield to maturity
5.53%
Maturity date
Nov 1, 2046
NKEB
NIKE, Inc. 3.875% 01-NOV-2045Yield to maturity
5.52%
Maturity date
Nov 1, 2045
NKE4971170
NIKE, Inc. 3.375% 27-MAR-2050Yield to maturity
5.49%
Maturity date
Mar 27, 2050
NKEA
NIKE, Inc. 3.625% 01-MAY-2043Yield to maturity
5.46%
Maturity date
May 1, 2043
NKE4971169
NIKE, Inc. 3.25% 27-MAR-2040Yield to maturity
5.10%
Maturity date
Mar 27, 2040
NKE4971168
NIKE, Inc. 2.85% 27-MAR-2030Yield to maturity
4.09%
Maturity date
Mar 27, 2030
US654106AF0
NIKE, Inc. 2.375% 01-NOV-2026Yield to maturity
4.03%
Maturity date
Nov 1, 2026
NKE4971167
NIKE, Inc. 2.75% 27-MAR-2027Yield to maturity
2.33%
Maturity date
Mar 27, 2027
See all NKE bonds
Curated watchlists where NKE is featured.


Frequently Asked Questions
The current price of NKE is 253,680 COP — it has increased by 1.41% in the past 24 hours. Watch NIKE, Inc. Class B stock price performance more closely on the chart.
Depending on the exchange, the stock ticker may vary. For instance, on BVC exchange NIKE, Inc. Class B stocks are traded under the ticker NKE.
NKE stock has risen by 5.48% compared to the previous week, the month change is a 7.45% rise, over the last year NIKE, Inc. Class B has showed a −26.91% decrease.
We've gathered analysts' opinions on NIKE, Inc. Class B future price: according to them, NKE price has a max estimate of 461,538.46 COP and a min estimate of 146,153.85 COP. Watch NKE chart and read a more detailed NIKE, Inc. Class B stock forecast: see what analysts think of NIKE, Inc. Class B and suggest that you do with its stocks.
NKE stock is 1.45% volatile and has beta coefficient of 1.12. Track NIKE, Inc. Class B stock price on the chart and check out the list of the most volatile stocks — is NIKE, Inc. Class B there?
Today NIKE, Inc. Class B has the market capitalization of 374.44 T, it has increased by 3.18% over the last week.
Yes, you can track NIKE, Inc. Class B financials in yearly and quarterly reports right on TradingView.
NIKE, Inc. Class B is going to release the next earnings report on Dec 18, 2025. Keep track of upcoming events with our Earnings Calendar.
NKE earnings for the last quarter are 1.97 K COP per share, whereas the estimation was 1.09 K COP resulting in a 80.12% surprise. The estimated earnings for the next quarter are 1.37 K COP per share. See more details about NIKE, Inc. Class B earnings.
NIKE, Inc. Class B revenue for the last quarter amounts to 47.07 T COP, despite the estimated figure of 44.14 T COP. In the next quarter, revenue is expected to reach 45.87 T COP.
NKE net income for the last quarter is 2.92 T COP, while the quarter before that showed 879.17 B COP of net income which accounts for 232.10% change. Track more NIKE, Inc. Class B financial stats to get the full picture.
Yes, NKE dividends are paid quarterly. The last dividend per share was 1.56 K COP. As of today, Dividend Yield (TTM)% is 2.43%. Tracking NIKE, Inc. Class B dividends might help you take more informed decisions.
NIKE, Inc. Class B dividend yield was 2.59% in 2024, and payout ratio reached 72.55%. The year before the numbers were 1.53% and 38.91% correspondingly. See high-dividend stocks and find more opportunities for your portfolio.
As of Dec 9, 2025, the company has 77.8 K employees. See our rating of the largest employees — is NIKE, Inc. Class B on this list?
EBITDA measures a company's operating performance, its growth signifies an improvement in the efficiency of a company. NIKE, Inc. Class B EBITDA is 16.06 T COP, and current EBITDA margin is 9.21%. See more stats in NIKE, Inc. Class B financial statements.
Like other stocks, NKE shares are traded on stock exchanges, e.g. Nasdaq, Nyse, Euronext, and the easiest way to buy them is through an online stock broker. To do this, you need to open an account and follow a broker's procedures, then start trading. You can trade NIKE, Inc. Class B stock right from TradingView charts — choose your broker and connect to your account.
Investing in stocks requires a comprehensive research: you should carefully study all the available data, e.g. company's financials, related news, and its technical analysis. So NIKE, Inc. Class B technincal analysis shows the buy rating today, and its 1 week rating is sell. Since market conditions are prone to changes, it's worth looking a bit further into the future — according to the 1 month rating NIKE, Inc. Class B stock shows the neutral signal. See more of NIKE, Inc. Class B technicals for a more comprehensive analysis.
If you're still not sure, try looking for inspiration in our curated watchlists.
If you're still not sure, try looking for inspiration in our curated watchlists.