Tesla, Inc.
No trades
Next report date
—
Report period
—
EPS estimate
—
Revenue estimate
—
4,440 COP
14.32 T COP
357.84 T COP
2.39 B
About Tesla, Inc.
Sector
Industry
CEO
Elon Reeve Musk
Website
Headquarters
Austin
Founded
2003
IPO date
Mar 6, 2013
Identifiers
3
ISIN US88160R1014
Tesla, Inc. engages in the design, development, manufacture, and sale of electric vehicles and energy generation and storage systems. It operates through the Automotive and Energy Generation and Storage segments. The Automotive segment includes the design, development, manufacture, sale, and lease of electric vehicles as well as sales of automotive regulatory credits. The Energy Generation and Storage segment is involved in the design, manufacture, installation, sale, and lease of solar energy generation, energy storage products, and related services and sales of solar energy systems incentives. The company was founded by Jeffrey B. Straubel, Elon Reeve Musk, Martin Eberhard, and Marc Tarpenning on July 1, 2003 and is headquartered in Austin, TX.
Related stocks
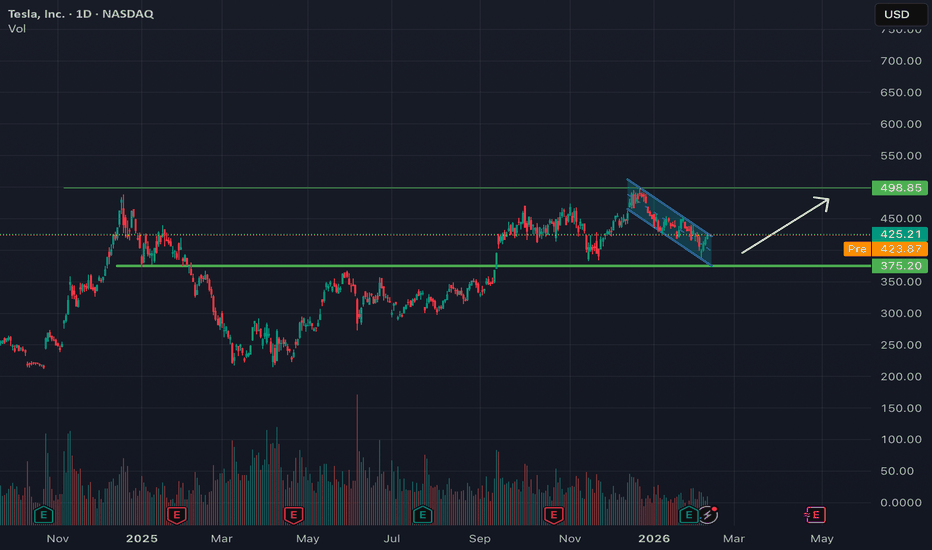
Tesla to potentially retest $500, needs Nasdaq strengthDaily chart showing NASDAQ:TSLA sitting at support inside a downtrend channel, sort of resembling a flag pattern. There is potential that Tesla may bounce off the support, and find its way to breakout of the downtrend channel in a bullish move towards $500.
This is of course is completely depende
TSLA - Not looking greatTSLA idea: trend break + bear flag under MAs (sell-the-rip until proven otherwise)
Tesla lost the major uptrend line and keeps getting rejected under the moving averages — that’s not “dip buy” behavior, that’s overhead supply.
Key map
Pivot / chop shelf: ~420
Line in the sand: 410.9 (LOD)
Downs
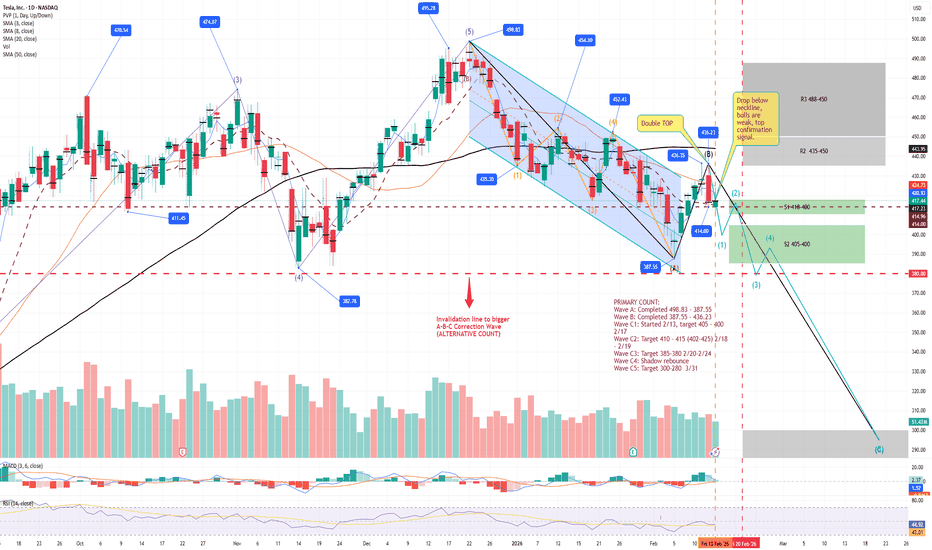
TSLA: DoubleTop Confirmed–BWave Ends 436, CWave target 395-380TSLA from 498 high unfolded a major A-B-C correction.
Primary Count:
- Wave A completed at 387.55. Wave B rallied to 436.35 forming a double top (Feb 11-12).
- Feb 13 CPI day closed with a spinning top, confirming B wave end.
- C wave started from 436, Wave C1 underway.
-- Short-term Wave C1
Tesla: Corrective Dip Before The Next Bullish Leg?Tesla staged an impressive recovery from its April 2025 lows, extending the rally to fresh highs near the 500 level. However, the beginning of 2026 has introduced a notable retracement, raising questions about whether this marks a larger reversal or simply a pause within a broader uptrend.
From an
TSLA Compression Near 410–420: Breakout orBreakdown? Feb 16–20TSLA is heading into this week trading inside a tightening range on the 1H timeframe, following a broader pullback from the 440s. Structure is no longer impulsively bullish, but it has not fully transitioned into a clean bearish trend either. Price is compressing between 410 support and the 420–424
Tesla: Electrifying the Future – Why TSLA Could Shock the MarketTesla: Electrifying the Future – Why TSLA Could Shock the Market in 2026 ⚡🚀
Section 1: Executive Summary
Tesla stands at a pivotal inflection point in 2026, with its pivot toward AI-driven autonomy and robotics poised to transform the company from an EV manufacturer into a broader technology pla
See all ideas
Summarizing what the indicators are suggesting.
Neutral
SellBuy
Strong sellStrong buy
Strong sellSellNeutralBuyStrong buy
Neutral
SellBuy
Strong sellStrong buy
Strong sellSellNeutralBuyStrong buy
Neutral
SellBuy
Strong sellStrong buy
Strong sellSellNeutralBuyStrong buy
An aggregate view of professional's ratings.
Neutral
SellBuy
Strong sellStrong buy
Strong sellSellNeutralBuyStrong buy
Neutral
SellBuy
Strong sellStrong buy
Strong sellSellNeutralBuyStrong buy
Neutral
SellBuy
Strong sellStrong buy
Strong sellSellNeutralBuyStrong buy
Displays a symbol's price movements over previous years to identify recurring trends.
TSLA4317805
Tesla Energy Operations, Inc. 5.45% 17-DEC-2030Yield to maturity
10.02%
Maturity date
Dec 17, 2030
TSLA4296328
Tesla Energy Operations, Inc. 5.45% 16-OCT-2030Yield to maturity
9.28%
Maturity date
Oct 16, 2030
TSLA4290558
Tesla Energy Operations, Inc. 5.45% 01-OCT-2030Yield to maturity
8.99%
Maturity date
Oct 1, 2030
TSLA4286421
Tesla Energy Operations, Inc. 5.45% 17-SEP-2030Yield to maturity
7.89%
Maturity date
Sep 17, 2030
TSLA4231716
Tesla Energy Operations, Inc. 5.45% 23-APR-2030Yield to maturity
7.60%
Maturity date
Apr 23, 2030
TSLA4250220
Tesla Energy Operations, Inc. 5.45% 29-MAY-2030Yield to maturity
7.40%
Maturity date
May 29, 2030
TSLA4313161
Tesla Energy Operations, Inc. 5.45% 03-DEC-2030Yield to maturity
7.15%
Maturity date
Dec 3, 2030
TSLA4260133
Tesla Energy Operations, Inc. 5.45% 25-JUN-2030Yield to maturity
7.02%
Maturity date
Jun 25, 2030
TSLA4247202
Tesla Energy Operations, Inc. 5.45% 21-MAY-2030Yield to maturity
6.97%
Maturity date
May 21, 2030
TSLA4224815
Tesla Energy Operations, Inc. 5.45% 26-MAR-2030Yield to maturity
6.78%
Maturity date
Mar 26, 2030
TSLA4265473
Tesla Energy Operations, Inc. 5.45% 16-JUL-2030Yield to maturity
6.72%
Maturity date
Jul 16, 2030
See all TSLACO bonds
Frequently Asked Questions
The current price of TSLACO is 1,518,000 COP — it hasn't changed in the past 24 hours. Watch Tesla, Inc. stock price performance more closely on the chart.
Depending on the exchange, the stock ticker may vary. For instance, on BVC exchange Tesla, Inc. stocks are traded under the ticker TSLACO.
TSLACO stock has risen by 2.81% compared to the previous week, the month change is a −6.35% fall, over the last year Tesla, Inc. has showed a 15.00% increase.
We've gathered analysts' opinions on Tesla, Inc. future price: according to them, TSLACO price has a max estimate of 2,197,802.20 COP and a min estimate of 157,509.16 COP. Watch TSLACO chart and read a more detailed Tesla, Inc. stock forecast: see what analysts think of Tesla, Inc. and suggest that you do with its stocks.
TSLACO reached its all-time high on Dec 18, 2025 with the price of 1,950,000 COP, and its all-time low was 1,183,000 COP and was reached on Jul 7, 2025. View more price dynamics on TSLACO chart.
See other stocks reaching their highest and lowest prices.
See other stocks reaching their highest and lowest prices.
TSLACO stock is 0.00% volatile and has beta coefficient of 1.14. Track Tesla, Inc. stock price on the chart and check out the list of the most volatile stocks — is Tesla, Inc. there?
Today Tesla, Inc. has the market capitalization of 5,085.46 T, it has decreased by −0.74% over the last week.
Yes, you can track Tesla, Inc. financials in yearly and quarterly reports right on TradingView.
Tesla, Inc. is going to release the next earnings report on Apr 28, 2026. Keep track of upcoming events with our Earnings Calendar.
TSLACO earnings for the last quarter are 1.89 K COP per share, whereas the estimation was 1.70 K COP resulting in a 10.81% surprise. The estimated earnings for the next quarter are 1.53 K COP per share. See more details about Tesla, Inc. earnings.
Tesla, Inc. revenue for the last quarter amounts to 93.97 T COP, despite the estimated figure of 93.36 T COP. In the next quarter, revenue is expected to reach 84.47 T COP.
TSLACO net income for the last quarter is 3.17 T COP, while the quarter before that showed 5.38 T COP of net income which accounts for −41.13% change. Track more Tesla, Inc. financial stats to get the full picture.
No, TSLACO doesn't pay any dividends to its shareholders. But don't worry, we've prepared a list of high-dividend stocks for you.
As of Feb 17, 2026, the company has 134.78 K employees. See our rating of the largest employees — is Tesla, Inc. on this list?
EBITDA measures a company's operating performance, its growth signifies an improvement in the efficiency of a company. Tesla, Inc. EBITDA is 41.50 T COP, and current EBITDA margin is 11.60%. See more stats in Tesla, Inc. financial statements.
Like other stocks, TSLACO shares are traded on stock exchanges, e.g. Nasdaq, Nyse, Euronext, and the easiest way to buy them is through an online stock broker. To do this, you need to open an account and follow a broker's procedures, then start trading. You can trade Tesla, Inc. stock right from TradingView charts — choose your broker and connect to your account.


