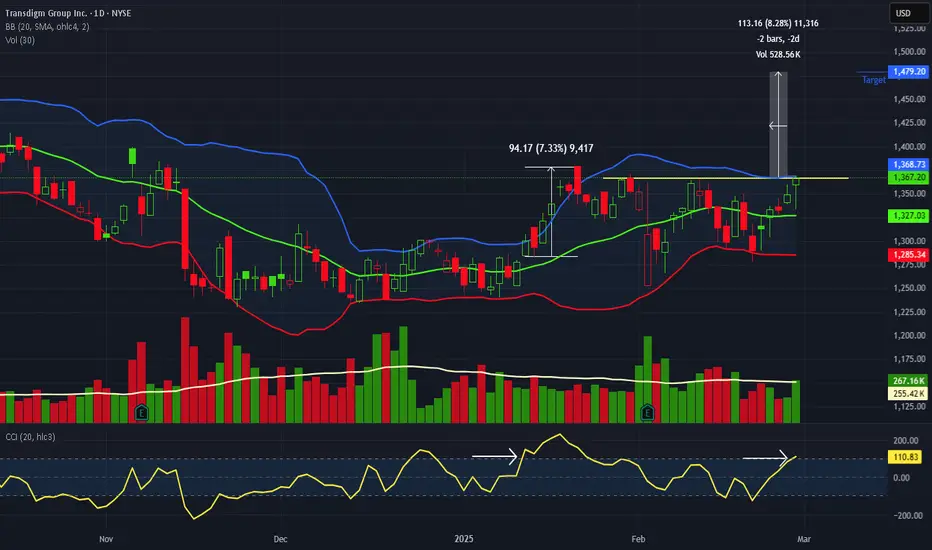
Triple Top Breakout and Analyst UpgradeNo doubt the analyst upgrade and new price target will be the catalyst for the next price move.
I need to see at least a 2h candle close above $1368.75 and would actually prefer a daily candle close. In January 2025 when the CCI indicator line closed above +100 there was a $94 price move up in 7-8 t
Next report date
—
Report period
—
EPS estimate
—
Revenue estimate
—
23.898 CHF
1.26 B CHF
6.73 B CHF
55.48 M
About Transdigm Group Inc.
Sector
Industry
CEO
Michael J. Lisman
Website
Headquarters
Cleveland
Founded
1993
ISIN
US8936411003
FIGI
BBG00C5YWNS7
TransDigm Group, Inc. engages in the design, production, and supply of aircraft components. It operates through the following segments: Power and Control, Airframe, and Non-Aviation. The Power and Control segment includes operations that primarily develop, produce and market systems and components that provide power to or control power of the aircraft utilizing electronic, fluid, power, and mechanical motion control technologies. The Airframe segment covers operations that primarily develop, produce and market systems and components that are used in non-power airframe applications utilizing airframe and cabin structure technologies. The Non-Aviation segment focuses on operations that develop, produce and market products for non-aviation markets. The company was founded by W. Nicholas Howley and Douglas W. Peacock in 1993 and is headquartered in Cleveland, OH.
Related stocks
TRANSDIGM Buy IdeaI buy if trendline is broken and price action looks good.
deep retracement (marked area for looking for buys) or a smaller retracement possible.
have fun!

$TDG with a bullish outlook following its earnings #StocksThe PEAD projected a bullish outlook for $TDG after a positive under reaction following its earnings release placing the stock in drift A with an expected accuracy of 70%.

TDGLooking like a buy... defense companies to increase in value due to global policy increasing military spending!

$TDG with a Bullish outlook following its earnings #Stocks The PEAD projected a Bullish outlook for $TDG after a Positive Under reaction following its earnings release placing the stock in drift A with an expected accuracy of 66.67%.

$TDG with a Bullish outlook following its earnings #Stocks The PEAD projected a Bullish outlook for $TDG after a Positive Under reaction following its earnings release placing the stock in drift A with an expected accuracy of 57.14%.

TDG - Continuation IdeaLRCX on the Monthly chart has shown a prime example of an Ascending Triangle, with bullish results
Chart pattern educational post

Bullish TDG Trade Idea, seasonality TDGNYSE:TDG This trade idea has a 100% win rate over the last 14 years in this market cycle. The open date is Oct 26th and the close date is Nov 8th.
the avg. drawdown is 2% and the avg. profit is 5%


See all ideas
Summarizing what the indicators are suggesting.
Neutral
SellBuy
Strong sellStrong buy
Strong sellSellNeutralBuyStrong buy
Neutral
SellBuy
Strong sellStrong buy
Strong sellSellNeutralBuyStrong buy
Neutral
SellBuy
Strong sellStrong buy
Strong sellSellNeutralBuyStrong buy
An aggregate view of professional's ratings.
Neutral
SellBuy
Strong sellStrong buy
Strong sellSellNeutralBuyStrong buy
Neutral
SellBuy
Strong sellStrong buy
Strong sellSellNeutralBuyStrong buy
Neutral
SellBuy
Strong sellStrong buy
Strong sellSellNeutralBuyStrong buy
Displays a symbol's price movements over previous years to identify recurring trends.
TDG5752997
TransDigm Inc. 6.625% 01-MAR-2032Yield to maturity
6.52%
Maturity date
Mar 1, 2032
TDG5752995
TransDigm Inc. 6.375% 01-MAR-2029Yield to maturity
6.44%
Maturity date
Mar 1, 2029
TDG5704505
TransDigm Inc. 7.125% 01-DEC-2031Yield to maturity
6.24%
Maturity date
Dec 1, 2031
USU8936PBC6
TransDigm Inc. 6.625% 01-MAR-2032Yield to maturity
6.03%
Maturity date
Mar 1, 2032
TDG5632736
TransDigm Inc. 6.875% 15-DEC-2030Yield to maturity
5.95%
Maturity date
Dec 15, 2030
TDG5540535
TransDigm Inc. 6.75% 15-AUG-2028Yield to maturity
5.93%
Maturity date
Aug 15, 2028
TDG6076464
TransDigm Inc. 6.375% 31-MAY-2033Yield to maturity
5.85%
Maturity date
May 31, 2033
TDG5887251
TransDigm Inc. 6.0% 15-JAN-2033Yield to maturity
5.70%
Maturity date
Jan 15, 2033
TDG6150180
TransDigm Inc. 6.25% 31-JAN-2034Yield to maturity
5.69%
Maturity date
Jan 31, 2034
USU8936PBB8
TransDigm Inc. 6.375% 01-MAR-2029Yield to maturity
5.63%
Maturity date
Mar 1, 2029
TDG5263223
TransDigm Inc. 4.875% 01-MAY-2029Yield to maturity
5.10%
Maturity date
May 1, 2029
See all T7D bonds
Curated watchlists where T7D is featured.

Frequently Asked Questions
The current price of T7D is 1,145.800 CHF — it has decreased by −10.70% in the past 24 hours. Watch TransDigm Group Incorporated stock price performance more closely on the chart.
Depending on the exchange, the stock ticker may vary. For instance, on BX exchange TransDigm Group Incorporated stocks are traded under the ticker T7D.
We've gathered analysts' opinions on TransDigm Group Incorporated future price: according to them, T7D price has a max estimate of 1,382.77 CHF and a min estimate of 1,089.98 CHF. Watch T7D chart and read a more detailed TransDigm Group Incorporated stock forecast: see what analysts think of TransDigm Group Incorporated and suggest that you do with its stocks.
T7D stock is 11.98% volatile and has beta coefficient of 0.77. Track TransDigm Group Incorporated stock price on the chart and check out the list of the most volatile stocks — is TransDigm Group Incorporated there?
Today TransDigm Group Incorporated has the market capitalization of 59.45 B, it has increased by 0.89% over the last week.
Yes, you can track TransDigm Group Incorporated financials in yearly and quarterly reports right on TradingView.
TransDigm Group Incorporated is going to release the next earnings report on Nov 6, 2025. Keep track of upcoming events with our Earnings Calendar.
T7D earnings for the last quarter are 7.62 CHF per share, whereas the estimation was 7.85 CHF resulting in a −2.97% surprise. The estimated earnings for the next quarter are 8.00 CHF per share. See more details about TransDigm Group Incorporated earnings.
TransDigm Group Incorporated revenue for the last quarter amounts to 1.77 B CHF, despite the estimated figure of 1.82 B CHF. In the next quarter, revenue is expected to reach 1.91 B CHF.
T7D net income for the last quarter is 390.35 M CHF, while the quarter before that showed 424.03 M CHF of net income which accounts for −7.94% change. Track more TransDigm Group Incorporated financial stats to get the full picture.
TransDigm Group Incorporated dividend yield was 0.00% in 2024, and payout ratio reached 0.00%. The year before the numbers were 0.00% and 0.00% correspondingly. See high-dividend stocks and find more opportunities for your portfolio.
As of Nov 3, 2025, the company has 16.6 K employees. See our rating of the largest employees — is TransDigm Group Incorporated on this list?
EBITDA measures a company's operating performance, its growth signifies an improvement in the efficiency of a company. TransDigm Group Incorporated EBITDA is 3.48 B CHF, and current EBITDA margin is 49.62%. See more stats in TransDigm Group Incorporated financial statements.
Like other stocks, T7D shares are traded on stock exchanges, e.g. Nasdaq, Nyse, Euronext, and the easiest way to buy them is through an online stock broker. To do this, you need to open an account and follow a broker's procedures, then start trading. You can trade TransDigm Group Incorporated stock right from TradingView charts — choose your broker and connect to your account.