AUD/CAD: Bearish Drop to 0.91630?FX:AUDCAD is signaling a bearish move on the 1-hour chart , with an entry zone between 0.92215-0.92280 near a resistance level.
First target at 0.91875 🎯 marks initial support, while the second at 0.91630 🎯 offers a deeper downside play. 📈 Set a stop loss on a daily close above 0.9232 to manage risk effectively. 🌟
A break below 0.92 with strong volume could confirm this drop, driven by CAD strength and AUD weakness. Watch commodity trends! 💡
📝 Trade Plan:
✅ Entry Zone: 0.92215 – 0.92280 (resistance area)
❌ Stop Loss: Daily close above 0.9232 to manage risk
🎯 Target 1: 0.91875 (initial support)
🎯 Target 2: 0.91630 (deeper downside target)
Ready for this move? Drop your take below! 👇
CADAUD trade ideas

AUD/CAD: Rejection from Resistance Signals Bearish CorrectionAUD/CAD has faced a strong rejection near the 0.9218 resistance zone, with price now turning lower after a failed breakout attempt. Although the move was initially supported by the upward trendline, momentum faded near the highs, indicating buyer exhaustion.
If sellers maintain control below 0.9200, the pair is likely to move toward the 0.9160 support level, with further downside potential toward 0.9132. The broader structure points to a corrective phase within the channel, reinforcing a bearish near-term bias.

Lingrid | AUDCAD Resistance Rejection Short OpportunityFX:AUDCAD faced a strong rejection from the resistance area at 0.9218 and is now turning lower. Price action shows that after a breakout run supported by the upward trendline, momentum failed near the highs, signaling exhaustion. If sellers maintain control below 0.9200, the market is likely to test the 0.9160 level, with potential extension toward 0.9132. The broader structure suggests a corrective phase inside the channel, aligning with bearish bias.
⚠️ Risks:
A recovery above 0.9218 could invalidate the bearish outlook.
Strong AUD performance from macro data might lift the pair again.
Global risk-on sentiment could dampen CAD demand and push price back higher.
If this idea resonates with you or you have your own opinion, traders, hit the comments. I’m excited to read your thoughts!

AUD/CAD SELLERS WILL DOMINATE THE MARKET|SHORT
AUD/CAD SIGNAL
Trade Direction: short
Entry Level: 0.913
Target Level: 0.906
Stop Loss: 0.918
RISK PROFILE
Risk level: medium
Suggested risk: 1%
Timeframe: 9h
Disclosure: I am part of Trade Nation's Influencer program and receive a monthly fee for using their TradingView charts in my analysis.
✅LIKE AND COMMENT MY IDEAS✅

AUDCAD Technical & Order Flow AnalysisOur analysis is based on a multi-timeframe top-down approach and fundamental analysis.
Based on our assessment, the price is expected to return to the monthly level.
DISCLAIMER: This analysis may change at any time without notice and is solely intended to assist traders in making independent investment decisions. Please note that this is a prediction, and I have no obligation to act on it, nor should you.
Please support our analysis with a boost or comment!

STEP BY STEP GUIDE ON HOW YOU CAN DO YOUR FORECASTINGForecasting is a crucial skill that helps you make informed decisions based on data analysis and trends. Whether you’re in trading, business, or any field that requires strategic planning, this guide will provide you with a straightforward approach to effective forecasting. Follow these steps to enhance your forecasting abilities.

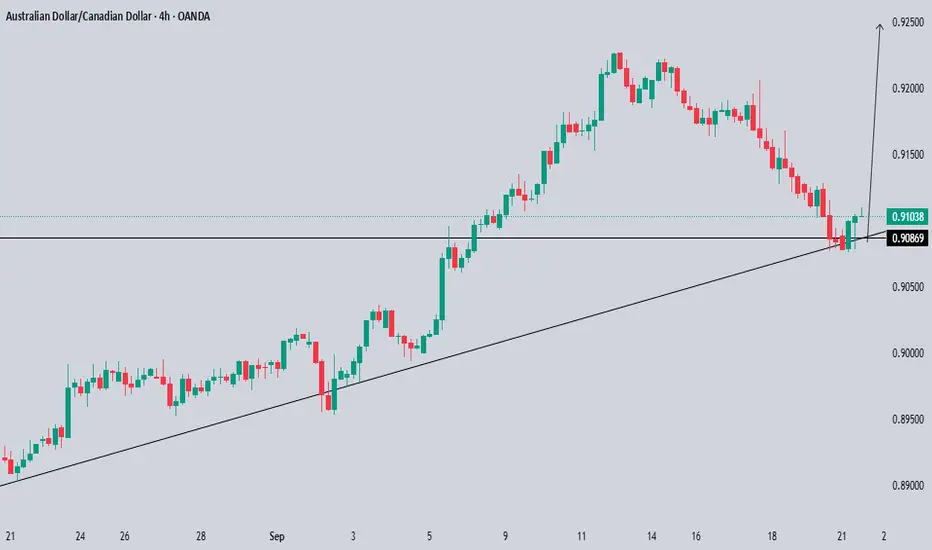
AUDCAD: Important Breakout Confirmed 🇦🇺🇨🇦
AUDCAD completed a correctional movement within a bullish flag pattern.
A confirmed violation of its resistance line with a daily candle close above that
suggests a highly probable bullish continuation.
The next strong resistance is 0.925.
It will be the next goal for the buyers.
❤️Please, support my work with like, thank you!❤️
I am part of Trade Nation's Influencer program and receive a monthly fee for using their TradingView charts in my analysis.


AUDCAD LOCAL CORRECTION|SHORT|
✅AUDCAD price taps into the supply level after an extended rally, hinting at distribution. From an ICT view, this area may trigger a shift in order flow, drawing price toward inefficiency and the marked target zone. Time Frame 4H.
SHORT🔥
✅Like and subscribe to never miss a new idea!✅

AUDCADBullish Trade Idea:
Trade Direction: Long (Buy)
Timeframe: 4H
Market Structure:
Change of Character (ChoCH) confirmed.
Break of Structure (BOS) occurred to the upside, confirming bullish momentum.
Price is breaking above previous high (B).
A potential bullish Gartley or Bat pattern forming (ABC pattern completed, aiming for D completion at higher levels).
Key Bullish Confluences:
ChoCH & BOS:
Structure flipped bullish after BOS to the upside.
Suggests a transition from bearish to bullish.
Bullish Harmonic Pattern:
ABCD pattern is targeting point D (above current price).
Extension to 2.616 Fibonacci level aligns with potential D completion.
Liquidity Above:
Price is targeting the "Weak High" marked just above current levels.
Weak highs often get taken out in bullish moves.
RSI Indicator (bottom of chart):
RSI is rising and moving above 50, indicating building bullish momentum.
No bearish divergence visible at the moment.
PDH (Previous Day High) Cleared:
Break above PDH confirms strength and could lead to expansion toward PMH (Previous Month High).
Entry Idea (Aggressive):
Entry: Current price or after a small pullback into the blue demand zone (OB) just above PDH.
Stop Loss: Below the demand zone (~below PDH).
Target 1: Weak High (~0.92200)
Target 2: Point D (2.616 extension; ~0.92800+)
Target 3 (Optional): Beyond D if continuation setup appears (trail SL)
Entry Idea (Conservative):
Wait for:
A retest of the OB or FVG (Fair Value Gap) below.
Reconfirmation (bullish engulfing or continuation pattern).
Then enter long.
Invalidation:
If price breaks below the PDH zone and closes below it with bearish momentum.
Also, if ChoCH is invalidated and structure shifts back bearish.

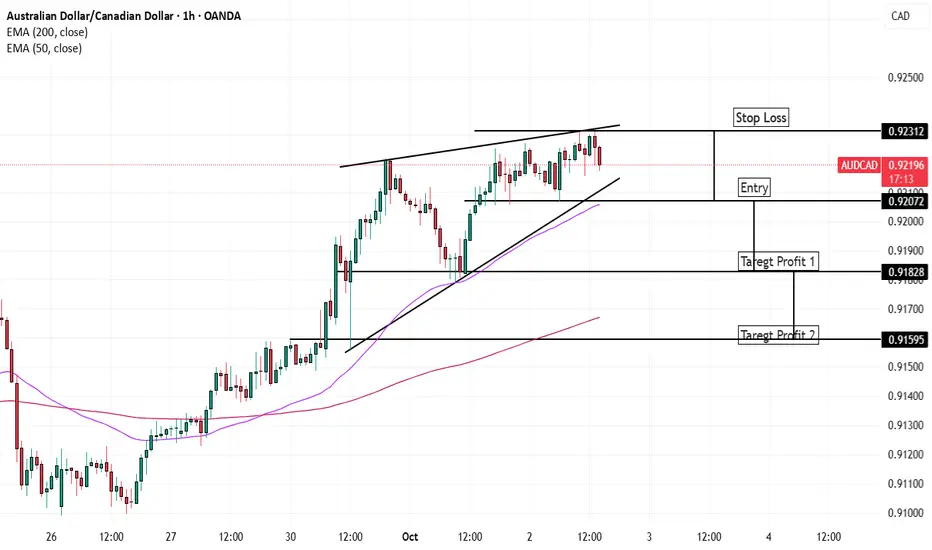
AUDCAD 1HTF Rising Wedge SetupPrice is moving inside a Rising Wedge, typically a bearish reversal signal.
Watching for a break below wedge support to confirm downside.
Potential targets: next support zones as marked on chart.
Invalidation: Break and close above wedge resistance.
#AUDCAD #Forex #ChartPattern #Wedge
AUDCAD: Watching for Pullback .. Here's My Trade Plan📊 AUDCAD has rallied strongly following the release of positive RBA data, giving the Aussie a notable boost 💹.
🔎 On the chart, we can clearly see a phase of bullish expansion 🚀. At this stage, my focus is on waiting for a retracement, allowing price to pull back and then confirm with a bullish break of structure on a lower timeframe for a long entry 🎯.
⚠️ Disclaimer: This analysis is for educational purposes only and not financial advice. Always apply proper risk management.

Bullish bounce?AUD/CAD is falling towards the support level, which is a pullback support that aligns with the 38.2% Fibonacci retracement and could bounce from this level to our take rpofit.
Entry: 0.91661
Why we like it:
There is a pullback support that lines up with the 38.2% Fibonacci retracement.
Stop loss: 0.91036
Why we like it:
There is a pullback support that lines up with the 78.6% Fibonacci retracement.
Take profit: 0.92722
Why we like it:
There is a resistance level which lines up with the 127.2% Fibonacci extension.
Enjoying your TradingView experience? Review us!
Please be advised that the information presented on TradingView is provided to Vantage (‘Vantage Global Limited’, ‘we’) by a third-party provider (‘Everest Fortune Group’). Please be reminded that you are solely responsible for the trading decisions on your account. There is a very high degree of risk involved in trading. Any information and/or content is intended entirely for research, educational and informational purposes only and does not constitute investment or consultation advice or investment strategy. The information is not tailored to the investment needs of any specific person and therefore does not involve a consideration of any of the investment objectives, financial situation or needs of any viewer that may receive it. Kindly also note that past performance is not a reliable indicator of future results. Actual results may differ materially from those anticipated in forward-looking or past performance statements. We assume no liability as to the accuracy or completeness of any of the information and/or content provided herein and the Company cannot be held responsible for any omission, mistake nor for any loss or damage including without limitation to any loss of profit which may arise from reliance on any information supplied by Everest Fortune Group.


AUDCAD - Hedging Short Targeting 0.9257Currently trading a 96k prop account with an open sell trade of 0.5 lots. Price seems to want to rise higher and so I'm not really confident in this short sell position at the present moment. Roughly 30 minutes ago just before creating this analysis I noticed Aussie accelerating and especially with pairs like EURAUD. I decided to hedge it 100% by adding an equal lot on the long size of 0.5.
I believe there is a good chance this pair will rise to my first target as explained in the video which is 0.9257
At this level I plan to lock-in my hedge of 0.5 long lots, book the profit and consider adding an additional sell of 0.5 lots to bring my breakeven level closer.

Bullish set up AUDCADI'm leaning bullish towards this pair. On a technical level we can see an uptrend after an accumulation on the daily TF.
Looking closer on the 1H we can see higher lows and higher highs setting in. Rn price is entering a supply zone and I expect price to react to this or the next one above. I want to see another 1H retracement to 1 of the 2 OB's I marked out in orange.
This is the area I want to be placing a long position in after bullish confirmation on the lower TF.
I expect price to come back at least to the 0,92000 area, but my aim is 0,93500. This is close to the last weekly high.
The only thing that worries me, is that price made a retest after the accumulation, but didn't tap into the demand zone.
According to the fundamentals, we can expect bullishness because Canada has been getting bad economic data regarding GDP and unemployment. House prices are going down, what can lead to a lower demand for this currency.
On the other hand, Australia has a lower unemployment number and the central bank remains more hawkish, aiming on modest growth. Overall they received good economic data.
AUDCAD longAustralian economy is in a better position than the Canadian economy. Nothing seems to be rolling for Canada.
On Monday, the BoC cut rate by 25 bps which was already priced in... no surprise there. We had some pretty dovish comments from Governor Tiff Macklem. He highlighted concerns over the softening labor market and noted that while no forward guidance was offered, the bank would assess risks over a "shorter horizon than usual." Markets left the meeting continuing to price around 20bps of further cuts by year-end.
The August CPI report reinforced the BoC's dovish case. Headline inflation printed slightly below forecast at 1.9% Y/Y (vs. 2.0% exp.)
July Retail Sales data pointed to a weakening consumer. While the headline -0.8% M/M print was in line with expectations, the core ex-autos figure fell by a larger-than-expected 1.2%.
August Housing Starts fell to 245.8k, well below the 277.5k forecast, signaling a slowdown in the housing market and adding to the picture of a cooling economy.
GDP growth surprised to a contraction of -0.1% m/m (forecast +0.1%). It was the third month in a row in contraction.
Canadian employment slumped for a second month in a row with a loss of 65.5K jobs (forecast +4.9K)
Anyways, I could go on and on. As for the Australian economy, it is pretty resilient, but we had a bad job number last week with a surprised loss of 5.4K jobs.
So here what is my thinking, We are getting into a nice pullback zone. Risk was a bit off with the strength of the USD and the US Yields. Friday, CAD was the best performing currency even after some pretty bad retail sale numbers that came out during the session. I can't figure out why the CAD pushed up, but I still have a bearish outlook on the currency.
Technically we are coming back to the top of the 4 months consolidation zone. We will have to keep an eye on market sentiment. If the USd keeps grinding higher on a ''somewhat'' hawkish Fed and some pretty good data release for the US economy, the AUD could keep pushing lower. I still expect a technical bounce from the level.
Good luck and please monitor the market sentiment... this is what will push the pair in the right direction.
Good luck

AUDCAD: Trend ContinuationThere's a trend continuation opportunity present on the AUDCAD pair. Here's my breakdown by timeframe.
Daily Timeframe:
Price pulled back and held supported at EMA20, which isn't a strong indication of support
Strong uptrend is indicated by EMA20 above EMA60
H1 Timeframe:
There's confluence here where Price is exiting the EMA20/60 band
EMA20 also remains above EMA60 for a strong uptrend
Pricing breaking DTL also remains valid as there was upside momentum


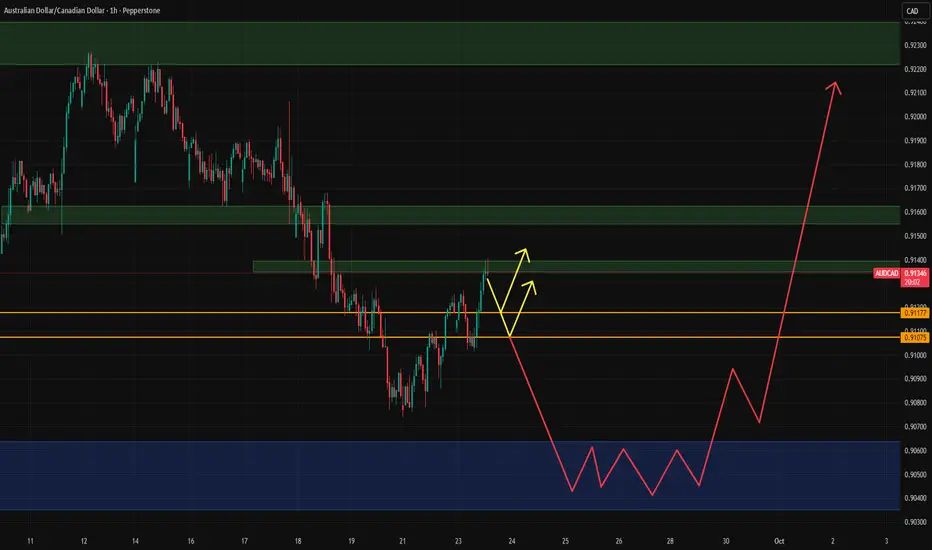
AUD/CAD BULLS ARE GAINING STRENGTH|LONG
Hello, Friends!
AUD/CAD pair is trading in a local uptrend which know by looking at the previous 1W candle which is green. On the 4H timeframe the pair is going down. The pair is oversold because the price is close to the lower band of the BB indicator. So we are looking to buy the pair with the lower BB line acting as support. The next target is 0.914 area.
Disclosure: I am part of Trade Nation's Influencer program and receive a monthly fee for using their TradingView charts in my analysis.
✅LIKE AND COMMENT MY IDEAS✅

AUDCAD-bullish ideaAUDCAD is in bull run as it has broke out from desending channel at retracement of 0.5-0.6.

AUDCADTechnical Analysis
Trend: Market is in a bullish channel. Price is respecting higher highs and higher lows, so structure favors buyers.
Momentum: Current candles show consolidation near the channel top, suggesting a pause rather than a reversal.
RSI: Showing mild bearish divergence → momentum is flattening, which often means price may retest lower channel or support before continuing up.
Multi-Timeframe:
1H → Bullish.
4H → Sideways with bullish tilt.
Daily → Bullish, which supports continuation.
📌 Trade Plan Logic
Bias: Strong bullish (fundamental + technical alignment).
Strategy:
Wait for a dip/pullback inside the bullish channel to join buyers at better pricing.
OR, if price consolidates then breaks higher with momentum, treat it as a continuation entry.
Risk Management:
Place stops below the last swing low / channel floor.
Take partial profits at the next impulse push, let the rest ride.
Invalidation: A clean 1H close below the bullish channel = bullish plan is off the table.au

AUDCAD Technical & Order Flow AnalysisOur analysis is based on a multi-timeframe top-down approach and fundamental analysis.
Based on our assessment, the price is expected to return to the monthly level.
DISCLAIMER: This analysis may change at any time without notice and is solely intended to assist traders in making independent investment decisions. Please note that this is a prediction, and I have no obligation to act on it, nor should you.
Please support our analysis with a boost or comment!