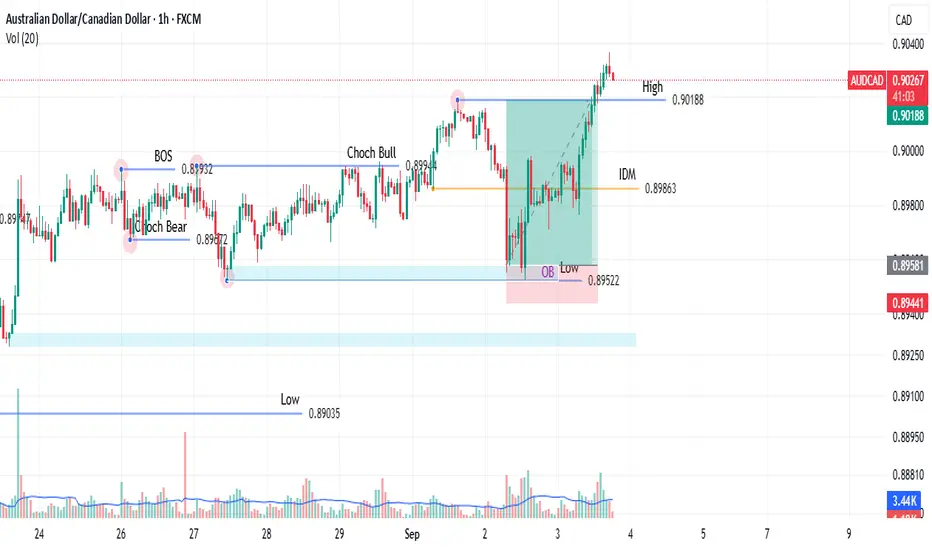
AUDCAD H1AUDCAD has been bullish and been respecting the bullish structure within the ascending channel.
Price is currently pulling back to the 0.5 - 0.618 Fib which is a good buying area.
Confluences:
- Ascending Channel
- Above 50 & 200 EMA
- No Divergence formed according to RSI
- Pullback to 0.5-0.618 Fib
CADAUD trade ideas

EVENING FORECAST LESSONSI have shared my key details in my evening forecast, and the things that I do, please do let me know if that is something that is helpful in the comments section below God bless.

AUDCAD 4H SHORTAUDCAD 4H – Short Setup
Based on Elliott Wave count, the 5th wave has completed on the 4H chart.
A corrective pullback is likely to follow.
Fibonacci levels highlight potential retracement zones.
Short-term bias leans to the downside.

AUDCAD | Bullish Continuation AXY is bullish with HHs and HLs against CXY which is totally inverse trend.AUDCAD chart pattern is also printing HHs and HLs with continuous bullish pattern.

AUDCAD | Tetra-Timeframe Support & Resistance MapThis idea presents a Tetra-Timeframe analysis of AUDCAD, layering major support and resistance zones across the Daily, 4H, 1H, and 15M charts to provide a clear multi-structure perspective.
→ Daily (D):
Key resistance near 0.9400–0.9450, tested during prior cycle highs.
Long-term support around 0.8900–0.8600, marking structural floors.
→ 4-Hour:
Resistance emerging near 0.9180–0.9200, currently under pressure.
Supports identified at 0.9000 and 0.8850, historical demand clusters.
→ 1-Hour:
Intraday resistance near 0.9170–0.9200.
Supports mapped at 0.9100 and 0.9020–0.9050.
→ 15-minute:
Short-term resistance tight around 0.9170.
Fresh supports at 0.9130–0.9140, followed by 0.9100.

Bearish Butterfly on AUD/CAD (4H): Full Trade Plan & AnalysisAUD/CAD 4H — My Bearish Butterfly Breakdown
Quick summary
I found a completed Bearish Butterfly on the AUD/CAD 4‑hour chart at point D. I’m looking to short this with a low‑timeframe entry, strict stop above D, and staged profit targets based on the chart’s fib and support levels.
Why I’m shorting
The pattern geometry (XA → AB → BC → CD) completes as a classic Butterfly with D in a strong resistance/supply area.
D lines up with key Fibonacci extensions and prior structure — multiple signals = higher probability of a reversal.
Price extended into value area after a rally; I expect a corrective pullback from here.
How I’ll enter
Wait for price to reach the D zone (~0.915–0.916).
Drop to 15–60m and take a precise entry on rejection: bearish engulfing, wick rejection, or failed break and close back under D.
Entry: on confirmed low‑TF rejection in the D zone.
Stop and targets (use platform precision)
Stop: above the D / recent high — roughly above 0.9199 (give buffer per your volatility).
TP1: 0.90875 (~60 pips) — take partial profit.
TP2: 0.90450 (~108 pips).
TP3: 0.90105 (~140 pips).
TP4: 0.89760 (~176 pips) — let remaining position run if momentum holds.
Risk & trade management
Size the position so the stop equals my preset % risk.
After TP1, move stop to breakeven + small buffer and scale out at further TPs.
If price closes convincingly above D on 4H, I’ll exit — pattern invalidated.
Final note (what I’d do right now)
Be patient — We don’t chase. We’ll wait for the D completion, confirm on a low timeframe, pull the trigger with a controlled size, lock partial profits early, and let the rest run toward deeper fib support. Check economic events for AUD/CAD before entering

AUDCAD Will Keep Growing!
HI,Traders !
#AUDCAD made a bullish
Breakout of the key horizontal
Level of 0.90286 and the
Breakout is confirmed so
We are bullish biased
And we will be expecting
A further bullish continuation !
Comment and subscribe to help us grow !

AUD/CAD BEARS ARE STRONG HERE|SHORT
Hello, Friends!
AUD/CAD pair is in the uptrend because previous week’s candle is green, while the price is clearly rising on the 6H timeframe. And after the retest of the resistance line above I believe we will see a move down towards the target below at 0.903 because the pair overbought due to its proximity to the upper BB band and a bearish correction is likely.
Disclosure: I am part of Trade Nation's Influencer program and receive a monthly fee for using their TradingView charts in my analysis.
✅LIKE AND COMMENT MY IDEAS✅

AUDCADAUDCAD (8H) — Technical Bias: Bullish continuation (buy-the-dip)
Structure: Clean breakout from the prior range with a strong impulse candle; price left a fair value gap (FVG) / breakout gap above the old resistance. Expect a retest into that FVG then continuation.
Momentum/Flow: Rising volume on the breakout and RSI turning up → supports trend extension rather than immediate reversal.
Liquidity/Supply: First objective is the overhead supply zone you marked; path of least resistance is up unless the breakout fails.
Trading implication (level-free):
Favor pullbacks into the FVG/previous resistance and look for a bullish reaction (HL + strong close) to join the move.
Invalidate/neutralize bias on an 8H close back inside the broken range or a loss of the breakout swing-low (failed breakout/fakeout scenario).
Optional filter: wait for lower TFs (5–15–30m) to realign bullish after the pullback for higher quality entries.

AUDCAD - Expecting Bullish Continuation In The Short TermH1 - Strong bullish momentum.
No opposite signs.
Until the two Fibonacci support zones hold I expect the price to move higher further.
If you enjoy this idea, don’t forget to LIKE 👍, FOLLOW ✅, SHARE 🙌, and COMMENT ✍! Drop your thoughts and charts below to keep the discussion going. Your support helps keep this content free and reach more people! 🚀
--------------------------------------------------------------------------------------------------------------------

AUDCAD - Break of Parabolic Trend Fan LinesPossible exhaustion of a recent bullish runup after breaking previous pivot highs.

AUD_CAD SHORT FROM RESISTANCE|SHORT|
✅AUD_CAD is going up now
But a strong resistance level
Is ahead at 0.9132 thus I am
Expecting a pullback and a move
Down towards the target of 0.9085
SHORT🔥
✅Like and subscribe to never miss a new idea!✅

AUDCAD Bullish Setup: Waiting for the Pullback📈 The AUDCAD is showing strong bullish momentum ✅. I’m watching for a pullback on the 30-minute timeframe ⏰ into equilibrium ⚖️ as a potential buy opportunity 💹. Everything is broken down in the video 🎥 (not financial advice ⚠️).

Sell AUDCADAUDCAD Sell Idea. The long-awaited bearish trend on AUDCAD will commence soon. A bearish flag indicates the first sell entry. We can expect price to decline sharply today.

AUDCAD - Trade Plan After recording this video, I also noticed that RSI and Stochastics on the 4hour are showing topping action, this give me some belief that this pair very well might correct and pullback as expected.
Happy Trading - Trade Safe..

AUD/CAD H4 AnalysisPrice is in an uptrend on this time frame.
After reaching the -61.8% Fibonacci extension level of it's last bullish impulse, we have seen an Evening Star pattern form.
This may be the start of a correction and we could possibly see price back at 0.9036 which was the most recent resistance on the H4 chart.
Is a counter trend move on the cards?

Strong sell audcadBig drop coming in audcad
Market already overbought on weekly chart
Strong selling area Reached

AUDCAD Short OpportunityWe are overbought on several of the oscillators on the 4HR time frame. We will start with simple 50/50 TP and SL in pips.
We are going to monitor every four hours and add positions as needed, I posted a screen shot of previous trades to demonstrate the cost averaging system I typically use. We are going to use the oscillators to determine our exit, I will update as needed.
We will bump our SL as needed if we re enter with more positions, see attached picture.
0.01 lots per thousand of the account.

AUD/CAD: Watching Reaction at Lower Channel TrendlineAUDCAD has been moving inside an ascending channel, respecting both the support and resistance levels. Recently, price tested the upper resistance of the channel around 0.9030 – 0.9040 and got rejected, forming a lower high.
Currently, price is retesting the minor support zone (highlighted in grey). If this zone breaks, I expect price to continue bearish toward the channel support around 0.8970 – 0.8980.
Resistance Zone : 0.9040 – 0.9050 (Upper channel + multiple rejections)
Support Zone : 0.8970 – 0.8980 (Lower channel trendline + horizontal support)
⚠️ A break above 0.9050 would invalidate this bearish setup.
Bias : Short-term Bearish unless price breaks and closes above resistance.

AUDCAD - Bearish break of Parabolic trendlinePossible Short trade opportunities after exhaustion of a parabolic runup prior to release of Australian Balance of Trade news.
The recent bullish move with exhibits positive expectation of Australian news release tomorrow morning. Positive news could cause continuation, negative news could cause a reversal/retracement.
Raise Stop-In levels if price continues north and be prepared to cancel inactive Stop-In short orders if Australian news highly positive.

My Personal Forex Money Management System-The 4 Rules I Live ByLet's talk about something more important than any indicator: money management.
I don't care how good my strategy is; without a solid system to manage risk, I am just gambling. I've been documenting my own trading journey and wanted to share the exact four-pillar framework I use to protect my capital. This isn't theory—it's what I actually follow on every single trade.
The 4 Components of My System:
Risk Per Trade: The fixed % of my account I'm willing to lose on one idea is, for now, between 0.5% and 1%.
Total Open Risk: My cap on total exposure from all running trades, I prefer a max of 3% but giving myself the space to a maximum of 6%.
Risk-to-Reward Ratio: My non-negotiable minimum filter for every setup is the golden 1:2. To tell you the truth, now when I see a trade that forces me to 1:2, I get annoyed. The trading plan that I am working on now gives me greater opportunities. Therefore, 1:2 is really my bare minimum.
Dynamic Position Sizing: How I calculate my lot size based on my stop loss.
My goal is to stay in the game as much as possible and work on the accumulation effect. This system is so simple and practical that it keeps me disciplined and stops me from blowing up an account on one bad trade or a volatile news event.
I'm curious—what's the #1 rule in your money management system? Drop a comment below. Let's learn from each other.
AUDCAD Is Very Bearish! Sell!
Please, check our technical outlook for AUDCAD.
Time Frame: 2h
Current Trend: Bearish
Sentiment: Overbought (based on 7-period RSI)
Forecast: Bearish
The market is approaching a significant resistance area 0.902.
Due to the fact that we see a positive bearish reaction from the underlined area, I strongly believe that sellers will manage to push the price all the way down to 0.899 level.
P.S
Overbought describes a period of time where there has been a significant and consistent upward move in price over a period of time without much pullback.
Disclosure: I am part of Trade Nation's Influencer program and receive a monthly fee for using their TradingView charts in my analysis.
Like and subscribe and comment my ideas if you enjoy them!

AUDCAD: Short Signal with Entry/SL/TP
AUDCAD
- Classic bearish formation
- Our team expects fall
SUGGESTED TRADE:
Swing Trade
Sell AUDCAD
Entry Level - 0.9016
Sl - 0.9025
Tp - 0.8998
Our Risk - 1%
Start protection of your profits from lower levels
Disclosure: I am part of Trade Nation's Influencer program and receive a monthly fee for using their TradingView charts in my analysis.
❤️ Please, support our work with like & comment! ❤️
