CAD/JPY — Key Resistance Rejection: Short Opportunity FormsThe pair recently approached a strong horizontal resistance zone where price previously reversed. Current price action suggests rejection from this level, signaling potential downside pressure.
Bearish candlestick patterns and weakening momentum indicate that sellers may be regaining control, makin
About Canadian Dollar / Japanese Yen
The Canadian Dollar vs. the Japanese Yen. When a trader is unsure about trading the US Dollar, the CADJPY is often determined to be a suitable replacement. However, the historically higher yield of the Canadian dollar in the past has made the CADJPY more sensitive to market wide sentiment changes than the USDJPY. Also, Canada’s large amount of energy exports, most notable oil, causes it to be affected by crude oil prices.
Related currencies

MORNING FORECAST USDCHF, USDCAD & CADJPYThis video gives the insight of what pairs I will be focusing on for today. This is crucial as it set my mind ready to take the opportunities in the market without overthinking.

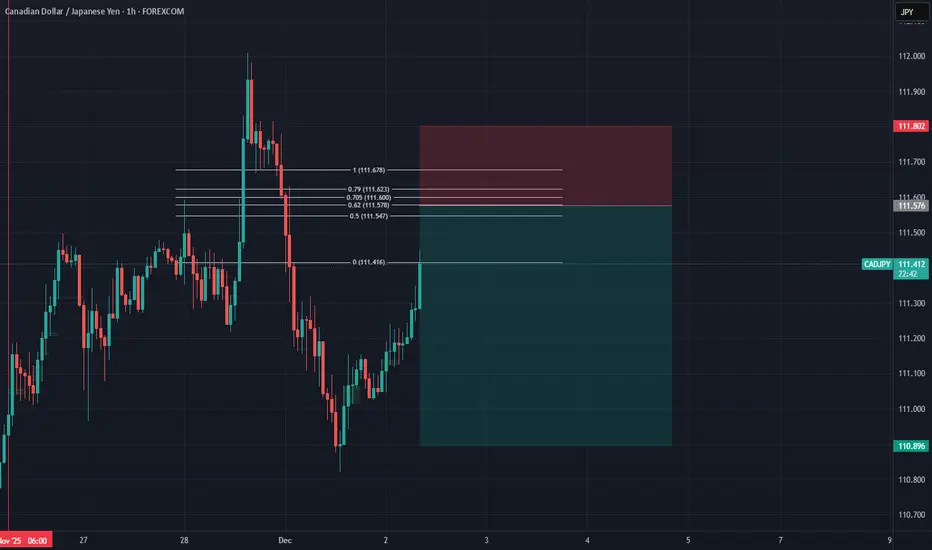
Bearish Plan in Action: CADJPY Sell TriggeredGuys, according to our bearish analysis plan, the CADJPY Sell trade has been activated!
Analysis: The price has moved exactly to the Supply Zone that we marked on the chart and has filled our Sell orders.
Current Status: We expect this resistance zone to be strong, and sellers to take control powe

CADJPY Could continue HigherPrice has been respecting a clean uptrend for a while now, higher highs, higher lows, and a rising trendline guiding the entire move.
After the latest push upward, price pulled back and formed a pretty nice bullish flag.
This is exactly what you want to see inside an established uptrend, a controll

sell cadjpyI was expecting cadjpy to sell on monday or sunday but ONLY when FVG forms - which it did. so as price is going up, my expecting is that the 4hr fvg hold price and push it further down. Risk to reward is 1:3
CADJPY LongWe are in an upward trend. But it went down to gather momentum to buy. We have an order break which has been tested once. When that area fails to break, we shall be having an opportunity to buy

CADJPYYes, It has also been a slow week. Still waiting to get to TP.
Are we getting to TP this coming week.???
Just stay tuned to find out.
DrElder_

CADJPY sellCADJPY has two possible points for a drop… you can refer to the trendline I drew.
Sell: 111.253 or 111.605
Take profit: 110.493
Stop loss: 111.822

Bullish Breakout Still Intact but Showing First Signs of ExhaustCAD/JPY 1H – Bullish Breakout Still Intact but Showing First Signs of Exhaustion at 111.95–112.00 Supply
Quick Professional Update & Current Status
Pair: CAD/JPY
Timeframe: 1-hour
Current Price: ≈111.78–111.83 (pulling back slightly from the 111.95 intraday spike)
What Has Changed in the Last ~13 Mi

CADJPY BUYFull Fresh Analysis (CAD/JPY – 4H)
1️⃣ Current Market Cycle
The chart is showing Late Markup transitioning into Early Distribution, but with bullish continuation potential inside the rising channel.
📌 2️⃣ Step-by-Step Through the Chart (Wyckoff Mapping)
A. April → July
Clear Accumulation Phase ar

See all ideas
Summarizing what the indicators are suggesting.
Oscillators
Neutral
SellBuy
Strong sellStrong buy
Strong sellSellNeutralBuyStrong buy
Oscillators
Neutral
SellBuy
Strong sellStrong buy
Strong sellSellNeutralBuyStrong buy
Summary
Neutral
SellBuy
Strong sellStrong buy
Strong sellSellNeutralBuyStrong buy
Summary
Neutral
SellBuy
Strong sellStrong buy
Strong sellSellNeutralBuyStrong buy
Summary
Neutral
SellBuy
Strong sellStrong buy
Strong sellSellNeutralBuyStrong buy
Moving Averages
Neutral
SellBuy
Strong sellStrong buy
Strong sellSellNeutralBuyStrong buy
Moving Averages
Neutral
SellBuy
Strong sellStrong buy
Strong sellSellNeutralBuyStrong buy
Displays a symbol's price movements over previous years to identify recurring trends.
Frequently Asked Questions
The current rate of CADJPY is 112.442 JPY — it has increased by 1.16% in the past 24 hours. See more of CADJPY rate dynamics on the detailed chart.
The value of the CADJPY pair is quoted as 1 CAD per x JPY. For example, if the pair is trading at 1.50, it means it takes 1.5 JPY to buy 1 CAD.
The term volatility describes the risk related to the changes in an asset's value. CADJPY has the volatility rating of 1.56%. Track all currencies' changes with our live Forex Heatmap and prepare for markets volatility.
The CADJPY showed a 0.93% rise over the past week, the month change is a 2.93% rise, and over the last year it has increased by 5.05%. Track live rate changes on the CADJPY chart.
Learn how you can make money on rate changes in numerous trading ideas created by our community.
Learn how you can make money on rate changes in numerous trading ideas created by our community.
CADJPY is a minor currency pair, i.e. a popular pair that is not associated with USD. Such pairs are also called cross currency pairs.
Currencies are usually traded through forex brokers — choose the one that suits your needs and go ahead. You can trade CADJPY right from TradingView charts — just log in to you broker account. Check out the list of our integrated brokers and find the best one for your needs and strategy.
When deciding to buy or sell currency one should keep in mind many factors including current geopolitical situation, interest rates, and other. But before plunging into a deep research, you can start with CADJPY technical analysis. The technical rating for the pair is buy today, but don't forget that markets can be very unstable, so don't stop here. According to our 1 week rating the CADJPY shows the strong buy signal, and 1 month rating is strong buy. See more of CADJPY technicals for a more comprehensive analysis.