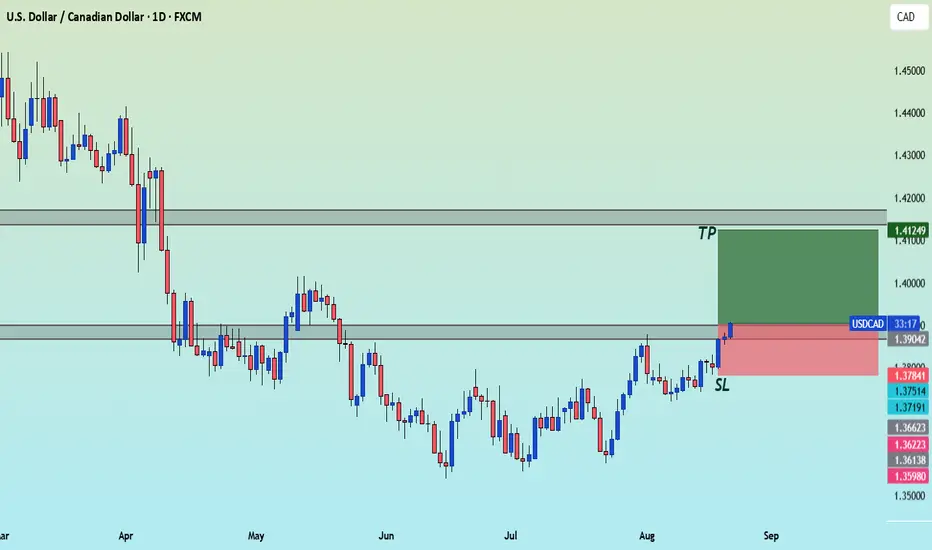
USD/CAD Bulls Eye 200DMA RetestHaving cleared resistance at 1.3900 on Thursday, a bullish setup has presented itself in USD/CAD ahead of Jerome Powell’s speech at Jackson Hole.
Longs could be established above the level with a stop beneath for protection, targeting the 200-day moving average found today at 1.40336. The price has already backtested and bounced off 1.3900 in Asian trade, strengthening the merits of the setup. Momentum signals are firmly positive, with RSI (14) trending higher but not yet overbought, while MACD is also trending higher in positive territory above the signal line.
While market pricing for Fed rate cuts is now less rich than just a few days ago, Powell is unlikely to explicitly back a September rate cut in his speech, especially with the August payrolls report on tap early next month.
If the price were to reverse back beneath 1.3900 and hold there, the bullish bias would be invalidated, opening the door for strategies to trade the range down to support at 1.3800.
Good luck!
DS
CADUSD trade ideas

The indicators suggest a bullish trend.The 200 EMA has held steady for approximately 7 weeks, the MACD signals a possible trend reversal, and the 14-period RSI is bullish, currently above the 50 threshold. The U.S. trade deal with other countries appears promising, potentially boosting market sentiment.


USDCAD OPPORTUNITY VIDEO BREAKDOWN...SIMPLE & STRAIGHTFORWARDHey hey TradingView community! Hope you all are doing amazing! Just wanted to come on and do a video breakdown on the USDCAD currency pair. I wanted to make a video so I could explain a few things I see for it in more depth but also keeping it simple for ya guys!
So hope you guys enjoy the breakdown & mindset of the setup and looking forward to the next one!
Please boost and follow the page for more accurate analysis and trades :) doing this for you all!
Cheers!

USDCAD - Bullish Triple BottomHello Traders !
The USDCAD price formed a triple bottom pattern.
Currently, The neckline is broken!
So, I expect a bullish move🚀
________________
TARGET: 1.39530🎯

USDCAD ~ Cheapy Choapa? IDKThe triple top resistance is found on the USDCAD weekly chart!
What we may expect with it is a high-quality downtrend.
But for the reason "This chart is so beautiful," here I have to say,
We need to be careful about this position UNTIL confirmation on sell.
Nika.

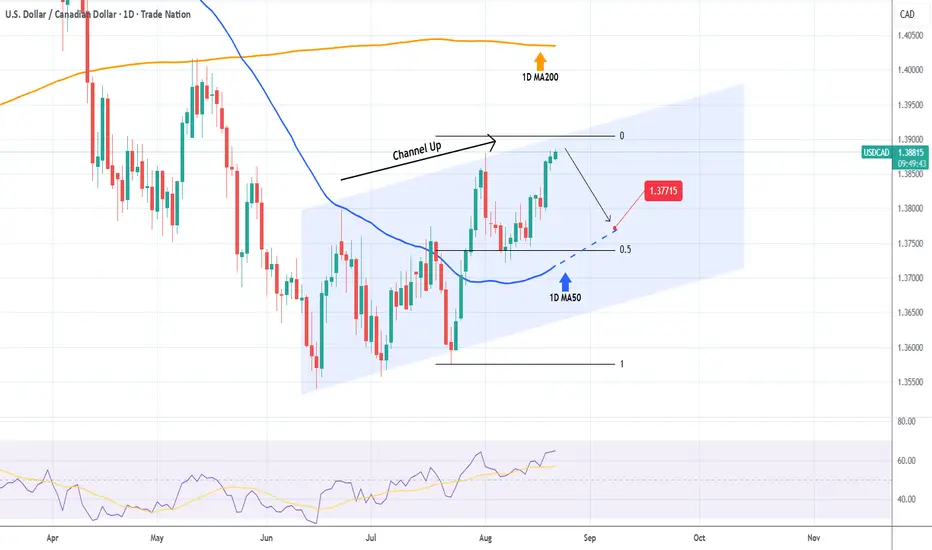
USDCAD Top of the Channel issues short-term sell signal.The USDCAD pair has been trading within a Channel Up since the 1D RSI Bullish Divergence started on the June 16 bottom and right now the price is approaching its top (Higher Highs trend-line) yet again.
With the 1D MA50 (blue trend-line) acting as Support, we expect as short-term pull-back (at least) as long as the 1D candles close within the pattern. Our Target is 1.37715.
-------------------------------------------------------------------------------
** Please LIKE 👍, FOLLOW ✅, SHARE 🙌 and COMMENT ✍ if you enjoy this idea! Also share your ideas and charts in the comments section below! This is best way to keep it relevant, support us, keep the content here free and allow the idea to reach as many people as possible. **
-------------------------------------------------------------------------------
Disclosure: I am part of Trade Nation's Influencer program and receive a monthly fee for using their TradingView charts in my analysis.
💸💸💸💸💸💸
👇 👇 👇 👇 👇 👇
USD/CAD: Inverse Head & Shoulders Playing OutHello guys.
The chart is showing a clear inverse head & shoulders pattern, which often signals a potential bullish reversal.
Price is now pushing above the neckline, suggesting momentum is shifting to the upside. As long as buyers hold this breakout, there’s room for continuation toward the 1.3853 and 1.3868 resistance levels.
Key Levels:
Support: 1.3720 (pattern invalidation if broken)
Breakout Zone: 1.3800–1.3820 (neckline retest area)
Targets: 1.3853 → 1.3868

USDCAD- Sell NowUSDCAD- Sell Now method. Its currently going well its expected that market will go downside for sometime expected to hit atkeast tP1 . however it can complete the target of 50% to 100% . what are your thoughts?

USD/ CAD Analysis is Ready This chart shows a bearish outlook for USD/CAD (1H timeframe). Price reached the channel’s upper boundary (resistance) at 1.3887 and is expected to reverse downward. The projected targets are 1.3830 and 1.3782, forming the highlighted target zone.

USDCAD A Fall Expected! SELL!
My dear friends,
My technical analysis for USDCAD is below:
The market is trading on 1.3881 pivot level.
Bias - Bearish
Technical Indicators: Both Super Trend & Pivot HL indicate a highly probable Bearish continuation.
Target - 1.3873
Recommended Stop Loss - 1.3886
About Used Indicators:
A pivot point is a technical analysis indicator, or calculations, used to determine the overall trend of the market over different time frames.
Disclosure: I am part of Trade Nation's Influencer program and receive a monthly fee for using their TradingView charts in my analysis.
———————————
WISH YOU ALL LUCK

USDCAD Roadmap reviewlooking for some downside. ABC - C looking ready for a signal to firm. keep an eye on zones- good chance extended C internals i,ii,iii,iv,v down

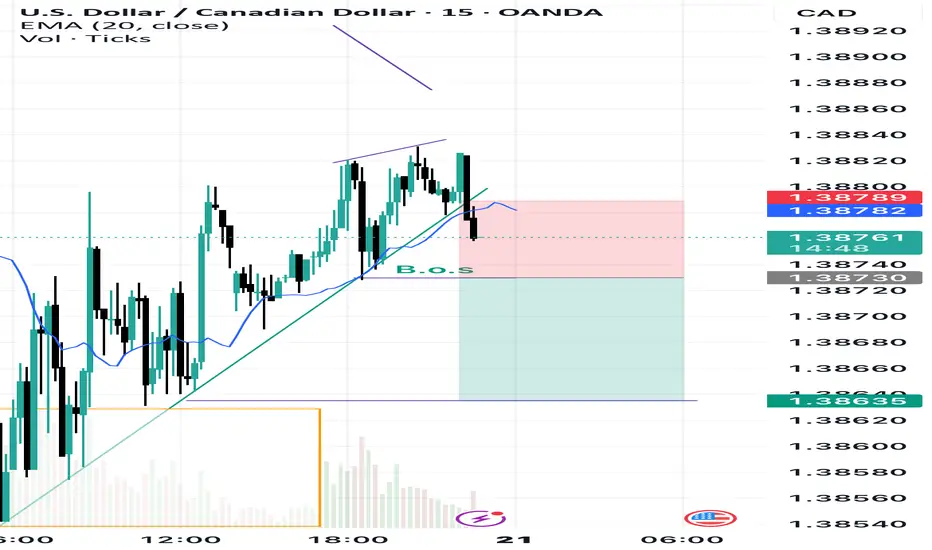
Waiting for B.O.SSpotted a up trend after an order block move has been finished.Waiting for break of structure to happen,when b.o.s is confirmed a short is recommended in my terms.
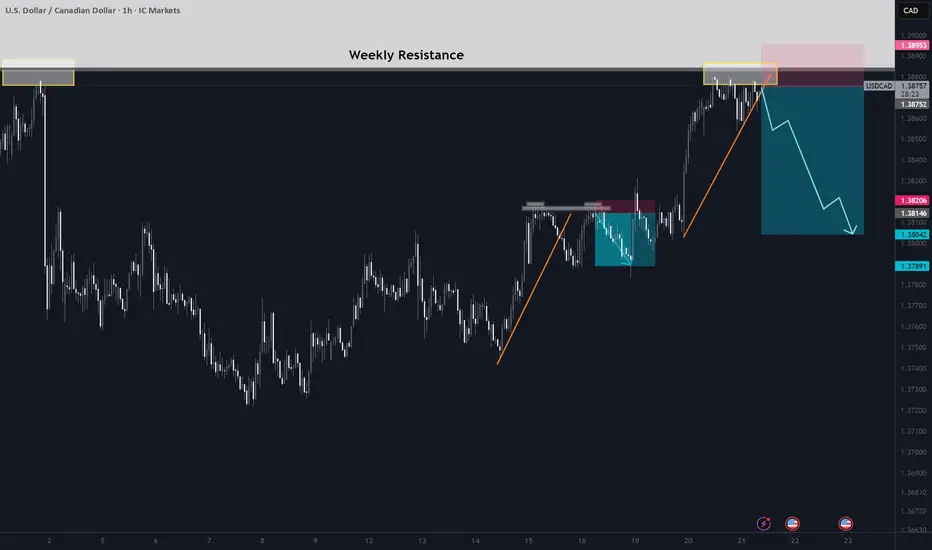
Waiting to go down. Bouncing off Weekly ResistanceFormed double top on 4H.
Hitting weekly resistance multiple times and unable to break that level.
Price is likely to move downward once it breaks a 1H trendline and retests.
USDCAD Swing Long!
HI,Traders !
#USDCAD is trading in an
Uptrend and the pair made
A retest of the horizontal
Support of 1.38022 from where
We are already seeing a
Bullish rebound so we will be
Expecting a further
Bullish move up !
Comment and subscribe to help us grow !

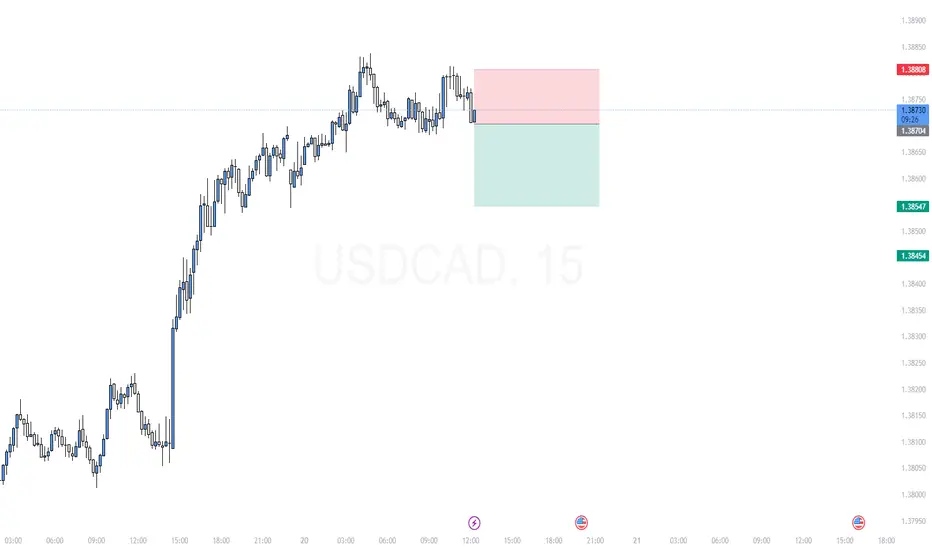
Sell idea on usdcadSell idea on usdcad
Entry at :1.38705
Stop Loss : 1.38798
Take Profit :1.38546
---------
Risk Reward : 1:1.7
---------
15min Timeframe
#7482025 | USDCAD Selling opportunity 1:4 (Premium Signal)USDCAD Selling opportunity Appears in H4 Time Frame Looking Price Action for Long Term Sell
Risk and Reward Ratio is 1:4
After 50 pips Profit Set SL Entry Level
"DISCLAIMER" Trading & investing business is "Very Profitable" as well as risky, so any trading or investment decision should be made after Consultation with Certified & Regulated Investment Advisors, by Carefully Considering your Financial Situation.

USDCAD: BEARISH CONTINUATION SETUPTechnically we were expecting for this area to work out. TVC:DXY dollar hasn't changed so much, my biais on dollar remains bearish. If that happens by positive correlation DXY WEAKNEESS means CMCMARKETS:USDCAD BEARISH

BUY OPPORTUNITY AFTER A TRIPLE BOTTOM This week I'm expecting for OANDA:USDCAD USDCAD to close bullish or at least to show lower time frame intraday momentum to the upside not only technically but also fundamentally.
USD/CAD Daily – Ichimoku Long SetupTrend & Cloud Structure
Price cleanly above the Kumo—bullish trend confirmed.
Future cloud bullish (Senkou A > B) and thick—solid support ahead.
Momentum & Confirmation
Tenkan-sen crossing above Kijun-sen — short-term momentum shift.
Chikou Span above price — confirmation of bullish intent.
Entry & Risk Levels
Entry: On daily close above cloud.
Stop: Just below cloud’s lower boundary.
Target: At least 2x stop-distance; ideally near projected cloud resistance (Senkou B or prior swing high).
Caveats
If price plunges back into the cloud or Tenkan crosses back below Kijun — invalidate and exit.
Use daily timeframe—lower ones produce false signals.
Final Thoughts
Ichimoku gives a live trend heatmap — use it. Waiting for alignment across cloud, lines, and Chikou gets you in only on structurally solid setups.
Thoughts? Will the cloud support or crush this long play?

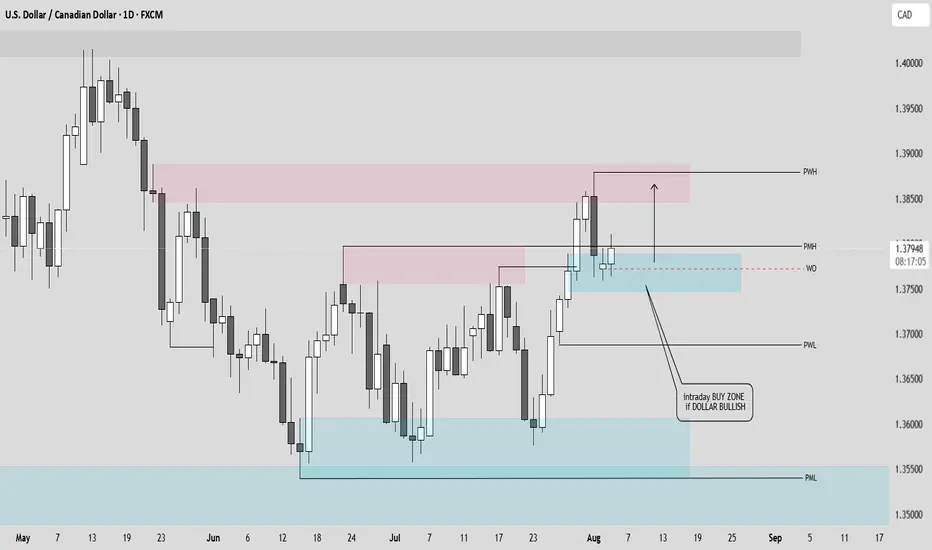
USDCAD sell opportunity and potential weekly bearish closurePrice is playig around the H4 DAILY sell zone in red. Dollar TVC:DXY currently looking bearish not only technically but also fundamentally. By positive correlation DXY weakness means CMCMARKETS:USDCAD bearish. Of course if dollar shows bullish signs we will adapt. From now , looking to see a bearish weekly close above the WO price level.

USDCAD bullish continuation supported at 1.3795The USDCAD remains in a bullish trend, with recent price action showing signs of a corrective pullback within the broader uptrend.
Support Zone: 1.3795 – a key level from previous consolidation. Price is currently testing or approaching this level.
A bullish rebound from 1.3795 would confirm ongoing upside momentum, with potential targets at:
1.3890 – initial resistance
1.3920 – psychological and structural level
1.3945 – extended resistance on the longer-term chart
Bearish Scenario:
A confirmed break and daily close below 1.3795 would weaken the bullish outlook and suggest deeper downside risk toward:
1.3770 – minor support
1.3745 – stronger support and potential demand zone
Outlook:
Bullish bias remains intact while the USDCAD holds above 1.3795. A sustained break below this level could shift momentum to the downside in the short term.
This communication is for informational purposes only and should not be viewed as any form of recommendation as to a particular course of action or as investment advice. It is not intended as an offer or solicitation for the purchase or sale of any financial instrument or as an official confirmation of any transaction. Opinions, estimates and assumptions expressed herein are made as of the date of this communication and are subject to change without notice. This communication has been prepared based upon information, including market prices, data and other information, believed to be reliable; however, Trade Nation does not warrant its completeness or accuracy. All market prices and market data contained in or attached to this communication are indicative and subject to change without notice.
