Potential short before big longingFor this week, i expect this short to happen and a start for a big long by the time market closes this friday and/or next week. Market can also act opposedly to this idea, thus beware!
CADUSD trade ideas

USDCADWe are waiting for the market, the purchasing area, to react to us and buy from the area we have specified


USD/CAD - A fine welcoming to the Forex market!Will continue to paper trade some pairs to continue to develop and prove my analysis in this market - so far, so good!
Happy Trading :)

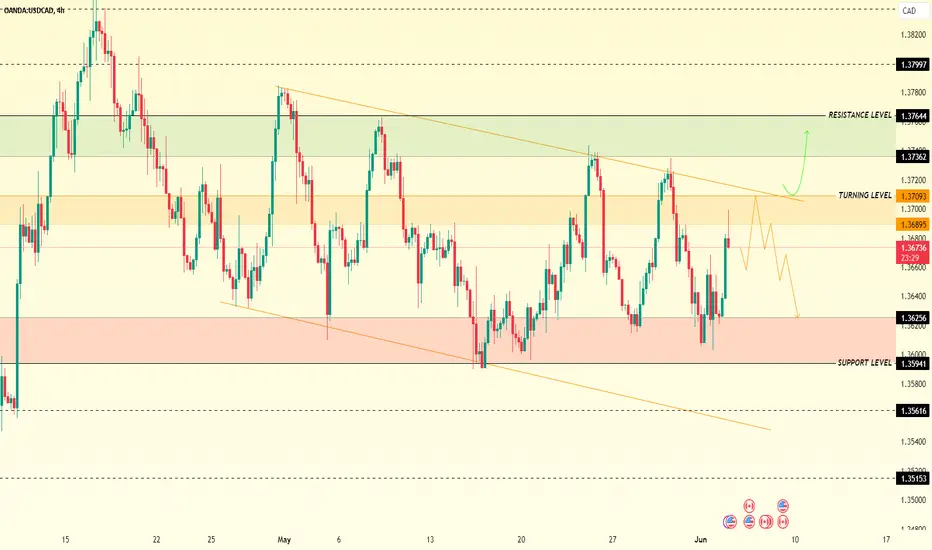
USDCAD ( 4H )USDCAD
Tendency the price is under bearish pressure between 1.36895 and 1.37093
Turning level : The turning level between 1.36895 and 1.37093 so as long as the price below this level, there will be a bearish trend
resistance level : Breaking the turning level 1.37093 , the price will rise to 1.37362 as long as the price stabilize this level , there will be reach 1.37644
support level : The trading stabilizing below1.36895 the price will reach the support level of 1.35941, and under this level it will be reach 1.35611
corrective level : price will attempt between between1.36895 and 1.37093, correct itself before falling
USDCAD demand bounceBullish bat = Reversal
Demand tap and bounce = Signal
Target = Next supply (bat recent high area)

#USDCAD: 550+ Pips Buying Opportunity! Do not miss out! FX:USDCAD
Price has started rebound from the area that we had previously had anticipated. However, we will now wait for price to breakthrough the inducement. The news on Thursday and NFP on Friday will be crucial for future of the pair.
**If you like our ideas, then please like, comment and follow us which will encourage to bring more educational ideas like this**
Team Setupsfx_

USD/CAD H4 | Rising into swing-high resistanceUSD/CAD is rising towards a swing-high resistance and could potentially reverse off this level to drop lower.
Sell entry is at 1.3724 which is a swing-high resistance that aligns with the 100.0% Fibonacci projection level.
Stop loss is at 1.3754 which is a level that sits above a swing-high resistance.
Take profit is at 1.3681 which is a pullback support.
High Risk Investment Warning
Trading Forex/CFDs on margin carries a high level of risk and may not be suitable for all investors. Leverage can work against you.
Stratos Markets Limited (www.fxcm.com):
CFDs are complex instruments and come with a high risk of losing money rapidly due to leverage. 68% of retail investor accounts lose money when trading CFDs with this provider. You should consider whether you understand how CFDs work and whether you can afford to take the high risk of losing your money.
Stratos Europe Ltd, previously FXCM EU Ltd (www.fxcm.com):
CFDs are complex instruments and come with a high risk of losing money rapidly due to leverage. 70% of retail investor accounts lose money when trading CFDs with this provider. You should consider whether you understand how CFDs work and whether you can afford to take the high risk of losing your money.
Stratos Trading Pty. Limited (www.fxcm.com):
Trading FX/CFDs carries significant risks. FXCM AU (AFSL 309763), please read the Financial Services Guide, Product Disclosure Statement, Target Market Determination and Terms of Business at www.fxcm.com
Stratos Global LLC (www.fxcm.com):
Losses can exceed deposits.
Please be advised that the information presented on TradingView is provided to FXCM (‘Company’, ‘we’) by a third-party provider (‘TFA Global Pte Ltd’). Please be reminded that you are solely responsible for the trading decisions on your account. There is a very high degree of risk involved in trading. Any information and/or content is intended entirely for research, educational and informational purposes only and does not constitute investment or consultation advice or investment strategy. The information is not tailored to the investment needs of any specific person and therefore does not involve a consideration of any of the investment objectives, financial situation or needs of any viewer that may receive it. Kindly also note that past performance is not a reliable indicator of future results. Actual results may differ materially from those anticipated in forward-looking or past performance statements. We assume no liability as to the accuracy or completeness of any of the information and/or content provided herein and the Company cannot be held responsible for any omission, mistake nor for any loss or damage including without limitation to any loss of profit which may arise from reliance on any information supplied by TFA Global Pte Ltd.
The speaker(s) is neither an employee, agent nor representative of FXCM and is therefore acting independently. The opinions given are their own, constitute general market commentary, and do not constitute the opinion or advice of FXCM or any form of personal or investment advice. FXCM neither endorses nor guarantees offerings of third-party speakers, nor is FXCM responsible for the content, veracity or opinions of third-party speakers, presenters or participants.

USDCAD Expected move today USDCAD is expected to respect our -OB which was respected before in the past

NZDCAD SHORTThis is just simple trading idea draw into chart using labels and lines. Please use it as educational purpose and you are free to modify any

@@@@ USDCAD UNIQUE IDEA $$$$$#USDCAD
UPDATE
Hey team hope you all are enjoying our ideas and analysis. Now we are here to discuss about USDCAD. USDCAD is getting a good volume here. Here we can see gain upto 150Pips+. Keep in touch we will update further soon.

USDCADPrice patterns, technical indicators and models were analyzed to perform a technical analysis for the USD/CAD currency pair trading length to identify potential upside signals
Use a daily weekly schedule for long-term in-depth analysis. Look for high highs and low lows on the chart, indicating an upward trend.
Identify key support and resistance levels where price has shown significant historical trends. These levels can help determine entry and exit points. Common time periods are 50, 100, and 200-day SMAs. A value above these averages may indicate an upward trend. They are more sensitive to recent changes in prices.
It measures price trends and volatility. An RSI above 70 indicates an overbought condition, while a below 30 indicates an oversold condition. It identifies signals that can be bought and sold based on the relationship between two moving averages.
It measures variables. Price movement out of the bands could indicate potential buying signals if it crosses the lower band to the upside. Look for bull motifs like ascending triangles, cups and hands, or upturned heads or shoulders.
I use a data set with historical USD/CAD prices. Once I have the data, I will conduct the analysis as described.

USDCAD Bullish flag forming possiblyOn the photo you can see all the price levels. Overall USDCAD has been strongly bearish movement but price has a had a short term bullish move. Currently I am seeing a bullish flag forming. Price is coming back to a very strong Weekly and Daily support area. I will be looking for longs at this price Lvl as I believe we might see a reversal in trend. Also we have news that is looking for strong for USD that I believe might help push the reversal. Happy trading. This coming week is going to be very interesting.

USD-CAD Strong Support! Buy!
Hello,Traders!
USD-CAD is again retesting
A horizontal support level
Of 1.3602 but its a strong
Key level so one move
Local bullish rebound is
To be expected
Buy!
Like, comment and subscribe to help us grow!
Check out other forecasts below too!

USDCAD: UT Curve Analysis(Based on the 2H Chart)
SLO2 @ 1.3754 ⏳
SLO1 @ 1.3737 ⏳
TP1 @ 2291
TP2 @ 2217
TP3 @ 2162
TP4 @ 2077
BSO @ 1.3630 ⏳
BLO1 @ 1.3617 ⏳
BLO2 @ 1.3598 ⏳
This is a Short-term Time Frame trade (1-minute to 3 hour):
— Highly volatile, price movements can be fast and unpredictable.
— Suitable for day trading and scalping, but require constant monitoring and quick decision-making.
— Not ideal for beginners due to the risk and stress involved.
🔑
⏳ = PENDING ORDERS
BLO = BUY LIMIT ORDER
BSO = SELL STOP ORDER
UT = UPTREND
SLO = SELL LIMIT ORDER
TP = TAKE PROFIT

USDCAD - LongUSDCAD is making Higher Highs and Higher Lows and little divergence has also been observed which shows trend will be bullish


Monthly USDCADBreakout of Symmetrical triangle leading to development of a bullish triangle and ultimately to hit August 1998 highs around the end of 2015 or into 2016.

One of my A plus set up We have a great price rejected order block on Higher time frame. OB rejected and retested. Imbalance at 10am NY ICT concept. BOs broken below and above retested on FVG then i did enter.

USD/CAD: Implications of US Treasury Auction ResultsOn Wednesday, the Canadian Dollar experienced a weakening trend across various currency pairs, as the safe-haven appeal of the US Dollar gained traction in the broader market. This decline in the Canadian Dollar's value was notably influenced by subdued bid-to-cover ratios observed in a US Treasury auction held on Tuesday, which contributed to dampened market sentiment as the week progressed, leading to a decrease in risk appetite among investors.
From a technical standpoint, the price has initiated a reversal from a previous supply area, signaling a potential bearish continuation trajectory below demand regions. This technical analysis suggests a shift in market dynamics favoring downward movement in the Canadian Dollar's value.
The economic calendar for Canada remained relatively quiet on Wednesday, with attention now turning to Thursday's release of the Canadian Current Account data. Market expectations anticipate a decline to -5.5 billion, following a climb to a six-month high of -1.62 billion in the previous quarter. Subsequently, on Friday, investors will await the release of Canadian Q1 Gross Domestic Product figures, which are projected to stabilize at 0.0% month-on-month, compared to the previous reading of 0.2%. These upcoming data releases are likely to further influence trading sentiment surrounding the Canadian Dollar.

USDCAD trading plan 3 june 2024Timeframe 1 hour
Plan:
Sell limit price at 1.36616 - 1.36776.
Stoploss at 1.36874
Reason to sell:
Strong legout with 3 candles and create imbalance
Short time in base with only 2 candles
Fresh Zone
minimum 1:2 RR
EMA 50, 100, 200 are in line (confirm downtrend)
Origin Zone
Zone overlapping with h4 zone

USDCAD tm:1hHello traders.
I hope you doing well.
These areas are based on my personal strategy and I will share it with you.
Open a sell position on the supply area or open a buy position on the demand area.
Your entry point, stop loss, and target point are based on money management and the amount of money in your trading account.
But I promise you that by trading in the areas of my trading strategy, you will definitely make a profit, because these areas, although they seem simple, are my experience of 8 years of learning and trading.
I hope you will achieve maximum continuous profit with me by using supply and demand areas.
Good luck traders.
Mohammad Goodarzi

