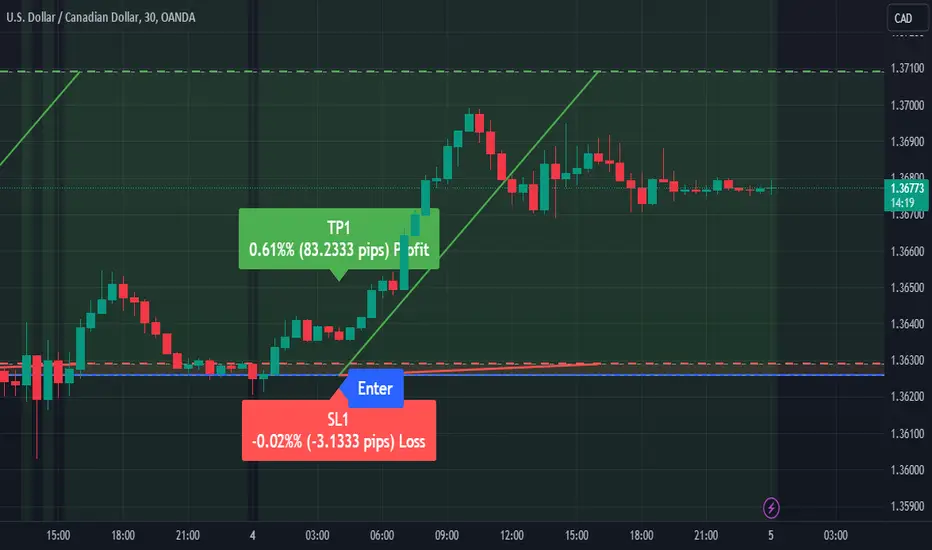
USDCAD UPDATESOn june 2, I posted the expected move, finaly the price did not retrace deep but it has hited our first entry. Always react the way market reacts. Follow me.
CADUSD trade ideas

USDCAD WILL EXPLODE BUYTP-1-------15Pip
TP-2-------35Pip
TP-3-------Full TP
Manage SL during news time, intraday trade tp and sl mentioned not a financial advice

USDCAD to $1.50 and beyondCanadian housing market is weak.
Bank of Canada needs to set interest rate low to bail out home owners and boomers
CAD is the next peso.

USDCAD Target SmashedJust as predicted, USDCAD has completed the move to the upper part of the triangle. Partially waiting for confirmations for the next move
.

USDCAD LongLong USDCAD:
Rejection off range low, breakout through countertrend line and head and shoulder.
Going in line with current fundamental biases for higher rates for longer from the FED and rate cuts this week from the BoC.
Keep in mind there is lots of high impact data this week for both the CAD and USD, weekly options expiries might be the safer choice around this potential volatility

USDCAD - Change of Character Hello Traders !
On Monday 3 June, The USDCAD reached a strong support level (1.35898 - 1.36168).
Today, The price broke the lower high (1.36687 - 1.36549).
So, I expect a bullish move📈
--------------
TARGET: 1.37170🎯

UCAD Correction to 1.3300 Levels!!Here I have USDCAD on the Daily Chart!
Since its High in April @ 1.38461, we have made multiple attempts at breaking this Support Zone @ ( 1.3627 - 1.3615 )
Acting as a Roof, we have a Falling Resistance where Price tested a couple times then brought False Breaks the past 2 weeks with Price dipping down to this Support!!
Based off the High of April and the Failed Attempt at a Higher High @ 1.37434, we are potentially looking at a Correction Wave!!
Now, for this idea to play out, we need price to make a VALID Break Down below this Support Zone! To then find Lower Support making a LOWER LOW confirming price to continue DOWN!!
Upon which we should see price come up to the ( 1.3627 - 1.3615 ) Support Zone to test as RESISTANCE!! Which then will give us our Selling Opportunities!
Based on the Fib-Ext Tool, we could see price Plummet to the ( 1.33278 - 1.32295 ) Range Target!

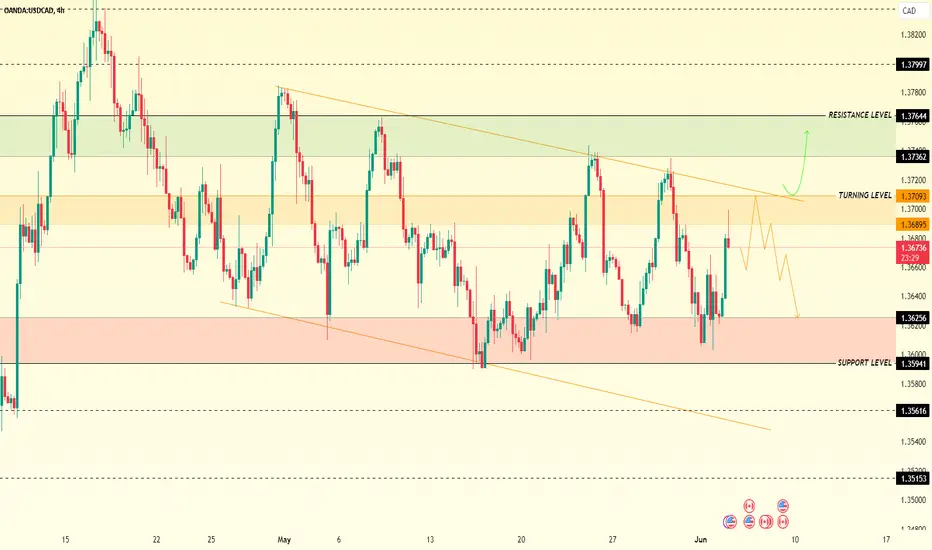
USDCADUSDCAD
Tendency the price is under bearish pressure between 1.36895 and 1.37093
Turning level : The turning level between 1.36895 and 1.37093 so as long as the price below this level, there will be a bearish trend
resistance level : Breaking the turning level 1.37093 , the price will rise to 1.37362 as long as the price stabilize this level , there will be reach 1.37644
support level : The trading stabilizing below1.36895 the price will reach the support level of 1.35941, and under this level it will be reach 1.35611
corrective level : price will attempt between between1.36895 and 1.37093, correct itself before falling
* Know the price attempt to touch 1,37093 , the price is under downward pressure , beware today have a BOC INTEREST RATE DESCITION , will affect the market trend

USDCAD LevelsI would like to say that these levels were designed to include the potential scenario where a correction from the recent bullish move gives rise to another wave pointing up, but unfortunately this whole design was developed for only bearish scenarios, at least until the middle of the project.
The polygon lurking near the current trading zone is a mystery as I am not convinced it can be penetrated, but I have left some icons in it just in case for potential milestones or even turnarounds.
The elements of higher interest for me in this project are the marked price levels for potential support/resistance action. The rectangles are not developed in a similar fashion, they are more like wild cards in case the price action will follow their overall design, then, after some confirmations of their relevance I might take them into account in trying to foresee what could happen, or even just use them as reference elements in update comments analysis .
While the project is design for a more bearish scenario, it will also try to catch the waves in both direction while we travel into the future, meaning all relevant candlestick setups near the elements will be considered for inspection regardless of the potential direction of the reversal.

USDCAD breakout possible todayIntraday Update: Ahead of the Bank of Canada rate decision today, the FX:USDCAD is in a (bearish wedge) with key support at 1.3600, resistance at 1.3700. The market is divided on a cut or not, so a breakout of the wedge is possible, but a hold could allow for a slide back below the key 1.3600 support.
We should also mention, US services ISM is due out around the same time which could add to the directionality of the pair as well.

USDCAD in focus ahead of interest rate decisionFor these reasons, we are bearish on USDCAD ahead of the Bank of Canada meeting:
- Dollar index is in a downtrend
- USDCAD is at the high of the value area of the move between late December 2023 and mid-April 2024, while the current candles show weakness
- Hidden bearish divergence in the CumulativeVolumeDelta

$USDCAD Elliott wave analysis ahead of BOC decisionFX:USDCAD is supported by 1.3600 into BOC decision. Look for the levels mentioned in the video and a trade for today


USD/CAD H4 | Rising into swing-high resistanceUSD/CAD is rising towards a swing-high resistance and could potentially reverse off this level to drop lower.
Sell entry is at 1.3724 which is a swing-high resistance that aligns with the 100.0% Fibonacci projection level.
Stop loss is at 1.3754 which is a level that sits above a swing-high resistance.
Take profit is at 1.3654 which is a pullback support.
High Risk Investment Warning
Trading Forex/CFDs on margin carries a high level of risk and may not be suitable for all investors. Leverage can work against you.
Stratos Markets Limited (www.fxcm.com):
CFDs are complex instruments and come with a high risk of losing money rapidly due to leverage. 68% of retail investor accounts lose money when trading CFDs with this provider. You should consider whether you understand how CFDs work and whether you can afford to take the high risk of losing your money.
Stratos Europe Ltd, previously FXCM EU Ltd (www.fxcm.com):
CFDs are complex instruments and come with a high risk of losing money rapidly due to leverage. 70% of retail investor accounts lose money when trading CFDs with this provider. You should consider whether you understand how CFDs work and whether you can afford to take the high risk of losing your money.
Stratos Trading Pty. Limited (www.fxcm.com):
Trading FX/CFDs carries significant risks. FXCM AU (AFSL 309763), please read the Financial Services Guide, Product Disclosure Statement, Target Market Determination and Terms of Business at www.fxcm.com
Stratos Global LLC (www.fxcm.com):
Losses can exceed deposits.
Please be advised that the information presented on TradingView is provided to FXCM (‘Company’, ‘we’) by a third-party provider (‘TFA Global Pte Ltd’). Please be reminded that you are solely responsible for the trading decisions on your account. There is a very high degree of risk involved in trading. Any information and/or content is intended entirely for research, educational and informational purposes only and does not constitute investment or consultation advice or investment strategy. The information is not tailored to the investment needs of any specific person and therefore does not involve a consideration of any of the investment objectives, financial situation or needs of any viewer that may receive it. Kindly also note that past performance is not a reliable indicator of future results. Actual results may differ materially from those anticipated in forward-looking or past performance statements. We assume no liability as to the accuracy or completeness of any of the information and/or content provided herein and the Company cannot be held responsible for any omission, mistake nor for any loss or damage including without limitation to any loss of profit which may arise from reliance on any information supplied by TFA Global Pte Ltd.
The speaker(s) is neither an employee, agent nor representative of FXCM and is therefore acting independently. The opinions given are their own, constitute general market commentary, and do not constitute the opinion or advice of FXCM or any form of personal or investment advice. FXCM neither endorses nor guarantees offerings of third-party speakers, nor is FXCM responsible for the content, veracity or opinions of third-party speakers, presenters or participants.

correction It is expected that the corrective trend will form up to the specified support ranges and then we will see a change in the trend.
It is expected that a trend change will be formed in the specified time frame and we will see the beginning of the upward trend

USD/CAD BEST PLACE TO SELL FROM|SHORT
Hello,Friends!
It makes sense for us to go short on USD/CAD right now from the resistance line above with the target of 1.363 because of the confluence of the two strong factors which are the general downtrend on the previous 1W candle and the overbought situation on the lower TF determined by it’s proximity to the upper BB band.
✅LIKE AND COMMENT MY IDEAS✅

Trading Alert: USDCAD Buy SignalDirection: Buy
Enter Price: 1.36258
Take Profit: 1.37090333
Stop Loss: 1.36289333
Justification:
The prediction for the USDCAD currency pair to move upward is based on a combination of market analysis and algorithmic insight provided by the EASY Quantum Ai strategy. Several factors have contributed to determining this Buy signal:
1. Market Sentiment: Current market sentiment indicators reveal a bullish trend for the USD against the CAD, influenced by stronger economic data from the US.
2. Technical Indicators: Key technical indicators such as Moving Averages, RSI, and MACD demonstrate a potential upward momentum. The price action is showing positive divergence, suggesting a forthcoming rally.
3. Fundamental Analysis: Recent developments and favorable economic reports from the US are likely to support USD strength. Conversely, slower economic growth forecasts for Canada may weaken the CAD.
4. Quantitative Analysis: The EASY Quantum Ai model has analyzed historical data patterns and predicts a probable upward movement.
By entering the market at 1.36258 and setting the Take Profit at 1.37090333, the strategy aims to capitalize on the expected bullish movement. The Stop Loss at 1.36289333 is placed to manage risk effectively.
This forecast is based on insights and advanced algorithms from EASY Quantum Ai, blending technical, fundamental, and quantitative analyses for a comprehensive trading decision.
Potential short before big longingFor this week, i expect this short to happen and a start for a big long by the time market closes this friday and/or next week. Market can also act opposedly to this idea, thus beware!

USDCADWe are waiting for the market, the purchasing area, to react to us and buy from the area we have specified


USD/CAD - A fine welcoming to the Forex market!Will continue to paper trade some pairs to continue to develop and prove my analysis in this market - so far, so good!
Happy Trading :)

USDCAD ( 4H )USDCAD
Tendency the price is under bearish pressure between 1.36895 and 1.37093
Turning level : The turning level between 1.36895 and 1.37093 so as long as the price below this level, there will be a bearish trend
resistance level : Breaking the turning level 1.37093 , the price will rise to 1.37362 as long as the price stabilize this level , there will be reach 1.37644
support level : The trading stabilizing below1.36895 the price will reach the support level of 1.35941, and under this level it will be reach 1.35611
corrective level : price will attempt between between1.36895 and 1.37093, correct itself before falling
USDCAD demand bounceBullish bat = Reversal
Demand tap and bounce = Signal
Target = Next supply (bat recent high area)
