CADUSD trade ideas

USD/ CAD !! DOWN correction wave ! 11/4/24 ⭐️ Smart investment, Strong finance
⭐️ USD/CAD INFORMATION:
The USD/CAD pair consolidates gains above 1.3650 in Asian trading hours, supported by stronger-than-expected US inflation. The Greenback reached a yearly high of 105.30. Investors are watching for cues from the US Producer Price Index (PPI) later today, with estimates of a 2.2% YoY increase in the headline PPI and a 2.3% YoY increase in the Core PPI.
The Bank of Canada (BoC) kept its key interest rate at 5% for the sixth consecutive time since July. BoC Governor Tiff Macklem stated that while recent inflation progress is encouraging, he needs more evidence before considering rate cuts. He also mentioned the possibility of an interest rate cut in June.
⭐️ Personal comments NOVA:
After a strong increase in price, the price needs an adjustment - a down wave to create liquidity and wait for the next motivational news.
⭐️ SET UP PRICE:
🔥SELL USD/ CAD zone: 1.36800 - 1.36950 SL 1.37400
TP1: 1.36500
TP2: 1.36100
TP3: 1.35800
⭐️ Technical analysis:
Based on technical indicators EMA 34, EMA89 and support resistance areas to set up a reasonable SELL order.
⭐️ NOTE:
Note: Nova wishes traders to manage their capital well
- take the number of lots that match your capital
- Takeprofit equal to 4-6% of capital account
- Stoplose equal to 2-3% of capital account
- The winner is the one who sticks with the market the longest

Trading Signal For USDCAD Trading Setup:
A Trading Signal is seen in the USDCAD Currency Pair.
Traders can open their Sell Trades NOW
⬇️Sell Now or Sell on 1.3703
⭕️SL@ 1.3738
🔵TP1@ 1.3588
🔵TP2@ 1.3528
🔵TP3@ 1.3421
What are these signals based on?
Classical Technical Analysis
Price Action Candlesticks Fibonacci
RSI, Moving Average , Ichimoku , Bollinger Bands
Risk Warning
Trading Forex, CFDs, Crypto, Futures, and Stocks involve a risk of loss. Please consider carefully if such trading is appropriate for you. Past performance is not indicative of future results.
If you liked our ideas, please support us with your likes 👍 and comments .

USDCAD BEARS THROUGH NEXT WEEKSelling USDCAD based on expectations of a weaker USD and filling imbalances of previous bullish move.
#TakeOutIDMandFillImbalance

USDCAD Session 11 AprilFX:USDCAD
Levels
Opening Price
Previous Day highs and lows
MTF - unmitigated Orderblocks
Asia Range - Accumulation
Waiting for London or New York to manipulate Asia liquidity and distribute to the up side

USDCAD: Your Trading Plan For TodayUSDCAD is currently testing a strong horizontal daily resistance level. Once it reached this level, the price began to consolidate in a tight horizontal range on the 1-hour timeframe.
To consider a short position with confirmation, it is recommended to wait for a breakout below the support of the range. A close below this level on an hourly candle will confirm the breach, with a bearish continuation expected towards the 1.3636 level.
If the price establishes a new higher high, the setup will no longer be valid.

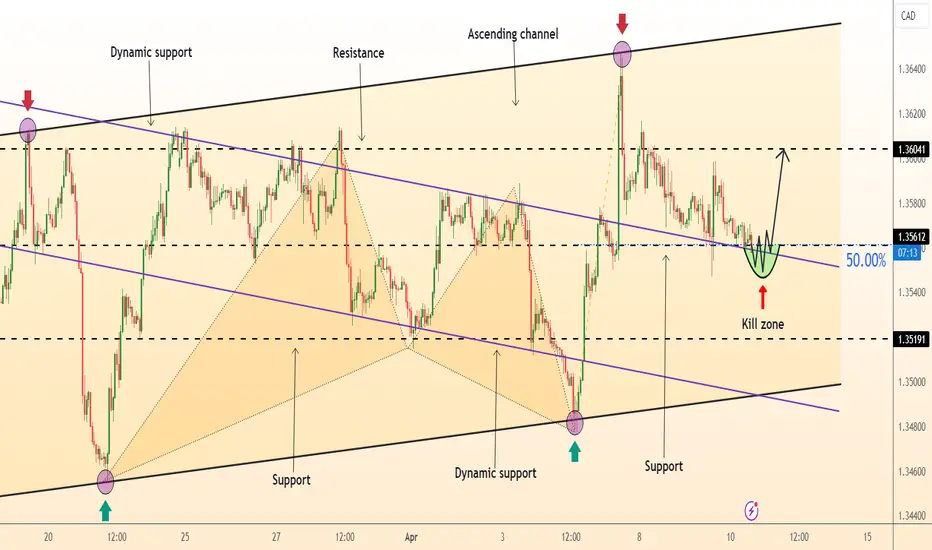
DeGRAM | USDCAD rebound from the retracement levelUSDCAD is moving in an ascending channel.
The volatility of price movement has decreased.
The chart has reached the 50% retracement level of the last upward impulse.
The price is above the level of dynamic support.
We expect a rebound after a retest of the current support.
-------------------
Share your opinion in the comments and support the idea with like. Thanks for your support!
Price actionHitting the roof of the ascending channel
Dealing with block orders
Hitting the minor node of the lower timeframe

Lingrid | USDCAD long RANGE zoneThe price has tested the resistance zone at 1.36000 multiple times, which is at the at the top of the range zone. FX:USDCAD broke through the resistance zone that became a support. I think the market will continue moving upward because we have a strong bullish daily candle. It gained momentum. I expect the pullback to support level and potentially form another impulse leg. Basically, it is going to be a 0.382 retracement and continuation of the current trend. My target is the resistance zone at 1.37100.
Traders, if you liked this idea or if you have your own opinion about it, write in the comments. I will be glad 👩💻

USDCADWe deep into USDCAD best opportunity where good sell and again buying and selling chart shows places

🔄 USDCAD: CURVE ANALYSIS 🔄(Based on the 1W Chart)
SLO2 @ 1.3880 📉 +260 pips
SLO1 @ 1.3815 ⏳
SSO @ 1.3590 ⏳
TP1 @ 1.3310
TP2 @ 1.2993
TP3 @ 1.2766
TP4 @ 1.2400
TP5 @ 1.2185
BLO @1.2115 ⏳
ADDITIONAL INFO:
🤑 Net Equity since our SLO2 is @ +260 pips
This is an Intermediate Time Frame trade (4 hours to 6 day):
— Offers a clearer picture of the underlying trend compared to short-term frames.
— Provides more opportunities for confirmation signals and technical analysis.
— Allows for more flexible trading schedules, trades can be held overnight.
— Suitable for swing traders and some positional traders.

USD CAD PRICE - CREATING A FLAG PATTERN USD CAD creating a flag pattern price will be down fall till 1.36243 marked price line,make a short trade as soon follow for more live updates

UsdCad- New rise to 1.39?Towards the end of last year, FX:USDCAD found itself testing the crucial support zone at 1.32. Subsequently, the pair reversed its course and, as of the beginning of February, has been consistently forming higher lows on our daily chart while pressing the significant resistance level at 1.36.
I anticipate that this resistance will ultimately be breached, paving the way for a rise towards 1.39. My bullish stance on this pair remains intact as long as the sequence of lower highs is not violated.

TURNING POINT BREAKOUT + BULLISH ENGULF + SSRI am sharing steps to do analysis and how to wait for a low risk trading execution.

USCAD: Fundamentally and technically bearThe USD/CAD pair has been exhibiting a bearish trend. Here are some recent observations:
Technical Forecast: The price is trading below the 22-SMA, and the RSI is below 50, favoring bearish momentum. The previous bullish trend encountered strong resistance at the 1.3802level.
-Current Situation: The USD/CAD price recently declined to the awaited correctional target at 1.3445. It may experience temporary sideways fluctuations before resuming negative trades. Breaking below this level could push the price toward 1.3392 as the next negative target.
Long-Term Outlook: The trend remains bearish, with the price below the 200-day average and several support levels broken. Short-term bounces should be approached with caution, with 1.3350 serving as the nearest old support.

USDCAD Technical and Fundamental Perspectives.USD/CAD currency pair from both technical and fundamental perspectives:
Technical Analysis:
- USD/CAD has been steadily channeling higher on US Dollar strength.
- Key technical points:
- 1.3575is the current price.
- Moving Averages (MA):
- MA5: 1.3574 (Buy)
- MA10: 1.3574 (Buy)
- MA20: 1.3554 (Buy)
- MA50: 1.3547 (Buy)
- MA100: 1.3564 (Buy)
- MA200: 1.3561 (Buy)
- Pivot Points:
- Resistance 1: 1.3575
- Resistance 2: 1.3578
- Resistance 3: 1.3581
- Support 1: 1.3569
- Support 2: 1.3572
- Support 3: 1.3575
Fundamental Analysis:
- USD/CAD has faced several factors:
- US Dollar Strength: The safe-haven appeal of the US Dollar and hawkish Fed rhetoric have allowed USD to strengthen against major counterparts, including the Canadian Dollar.
- Commodity Supply Constraints: Despite fiscal stimulus and low interest rates, commodity supply constraints have weighed on energy prices, driving inflation higher.
- Monetary Tightening Measures: Both the Fed and the Bank of Canada are implementing rate hikes, contributing to price action in Q.
- Challenges Ahead: Ensuring the withdrawal of QE does not disrupt financial stability remains a challenging task for central banks..

USDCADPrice made a huge push to the upside because of news, initially I was expecting this pair to dump really bad however the news wasn't in favour. I believe this pair is loosing its momentum now to the upside and we can now hopefully see this pair trend down maybe for a short period before continuing to the upside as the USD pairs appears to be really strong at the moment.

USDCAD LongUSDCAD Long Trade after big Bullish Momentum Candle in uptrend.
1. Price above 3 MA's (3,8,20)
2. RSI MA's Cross
3. Big Bullish Momentum Candle (possible retest)
4. Breakout of strong resistance structure
5. Strong USD economy environment
6. RSI Above 50
7. Weekly Uptrend
8. Daily structure HH-HL-HH-HL
Risk: 2%
Stop Loss: Below low of the signal candle
Take Profit: None
Trailing stop and exit on close below 20 SMA or break of structure

USD CAD chartUSD/CAD is the forex ticker that represents the US Dollar-Canadian Dollar currency pair. The USD/CAD rate, as indicated on the live chart, shows traders how many Canadian Dollars are required to buy one US Dollar. Follow the USD/CAD chart for live prices and stay up to date with the latest USD/CAD news, forecasts and analysis. Our expert industry insights will give you the edge to conduct thorough fundamental and technical analysis to trade this popular currency pair. confirm signal

USDCAD Long IdeaAfter a nice reaction from the FVG level, the price surged to a new high.
The 1.35200 area appears to be a promising location for placing long positions.
I’ll patiently await confirmation from CHoCH on the lower time frames (15 minutes to 1 hour) around 1.35200 levels.

USDCAD - Analysis using ICT ConceptsEverything was pretty much said in the video.
Basically price reached a higher timeframe Premium Array on the 3D chart, so now I have the expectation of lower prices based on the lower timeframe Premium Arrays, specifically a 2h Sibi.
Today is CPI, so anything can happen. Price can always go above and beyond what is ordinary in such events.
- R2F

USECHF AFTER NFPPrice successfully went as analysed and currently trade around 1.36595 area. This makes over 0.8% increase today. Buyers are dominating the market after the release of CPI DATA

USDCAD⚠️ Reaction From Hedger Premium Zone Out✔️USDCAD is expected to rise
✔️Recommended to consider buying
🟢 Try to BUY🔼 all the Dips !!!
✔️Confirmation Buyer Limit Area
Trade active:
Now try to go up with new buyers...
✔️Buy the dips!!!
