USDCAD Technical & Order Flow AnalysisOur analysis is based on a multi-timeframe top-down approach and fundamental analysis.
Based on our assessment, the price is expected to return to the monthly level.
DISCLAIMER: This analysis may change at any time without notice and is solely intended to assist traders in making independent investment decisions. Please note that this is a prediction, and I have no obligation to act on it, nor should you.
Please support our analysis with a boost or comment!
CADUSD trade ideas

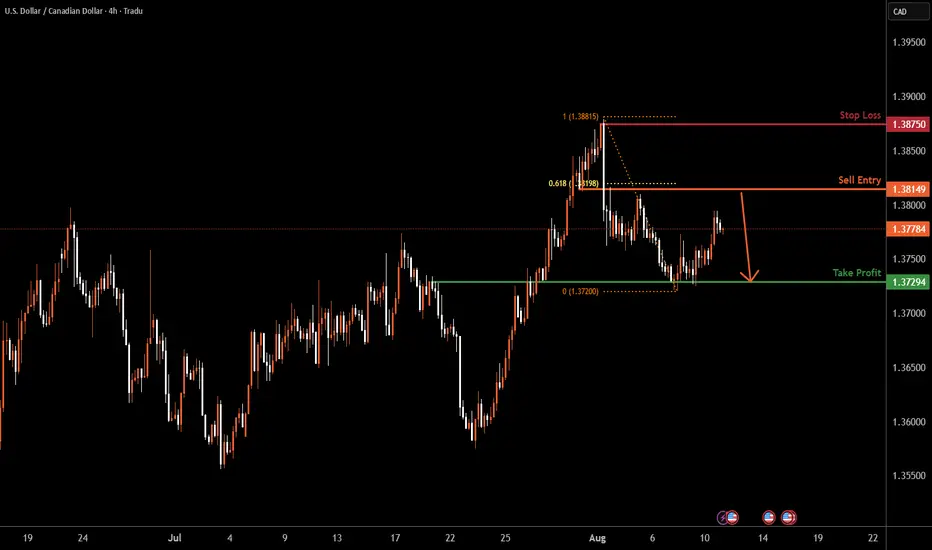
LOONIE H4 | Bearish reversalBased on the H4 chart analysis, we could see the price rise to the sell entry which is a pullback resistance that aligns with the 61.8% Fibonacci retracement and could reversr to the downside.
Sell entry is at 1.3814, which is a pullback ressitance that lines up with the 61.8% Fibonaci retracement.
Stop loss is at 1.3875, whihc is a swing high resistance.
Take profit is at 1.3729, whihc is a pullback support.
High Risk Investment Warning
Trading Forex/CFDs on margin carries a high level of risk and may not be suitable for all investors. Leverage can work against you.
Stratos Markets Limited (tradu.com ):
CFDs are complex instruments and come with a high risk of losing money rapidly due to leverage. 65% of retail investor accounts lose money when trading CFDs with this provider. You should consider whether you understand how CFDs work and whether you can afford to take the high risk of losing your money.
Stratos Europe Ltd (tradu.com ):
CFDs are complex instruments and come with a high risk of losing money rapidly due to leverage. 66% of retail investor accounts lose money when trading CFDs with this provider. You should consider whether you understand how CFDs work and whether you can afford to take the high risk of losing your money.
Stratos Global LLC (tradu.com ):
Losses can exceed deposits.
Please be advised that the information presented on TradingView is provided to Tradu (‘Company’, ‘we’) by a third-party provider (‘TFA Global Pte Ltd’). Please be reminded that you are solely responsible for the trading decisions on your account. There is a very high degree of risk involved in trading. Any information and/or content is intended entirely for research, educational and informational purposes only and does not constitute investment or consultation advice or investment strategy. The information is not tailored to the investment needs of any specific person and therefore does not involve a consideration of any of the investment objectives, financial situation or needs of any viewer that may receive it. Kindly also note that past performance is not a reliable indicator of future results. Actual results may differ materially from those anticipated in forward-looking or past performance statements. We assume no liability as to the accuracy or completeness of any of the information and/or content provided herein and the Company cannot be held responsible for any omission, mistake nor for any loss or damage including without limitation to any loss of profit which may arise from reliance on any information supplied by TFA Global Pte Ltd.
The speaker(s) is neither an employee, agent nor representative of Tradu and is therefore acting independently. The opinions given are their own, constitute general market commentary, and do not constitute the opinion or advice of Tradu or any form of personal or investment advice. Tradu neither endorses nor guarantees offerings of third-party speakers, nor is Tradu responsible for the content, veracity or opinions of third-party speakers, presenters or participants.
USDCADLong on this pair, price already did its thing by overselling to continue its trend higher. Let's see how this pans out.
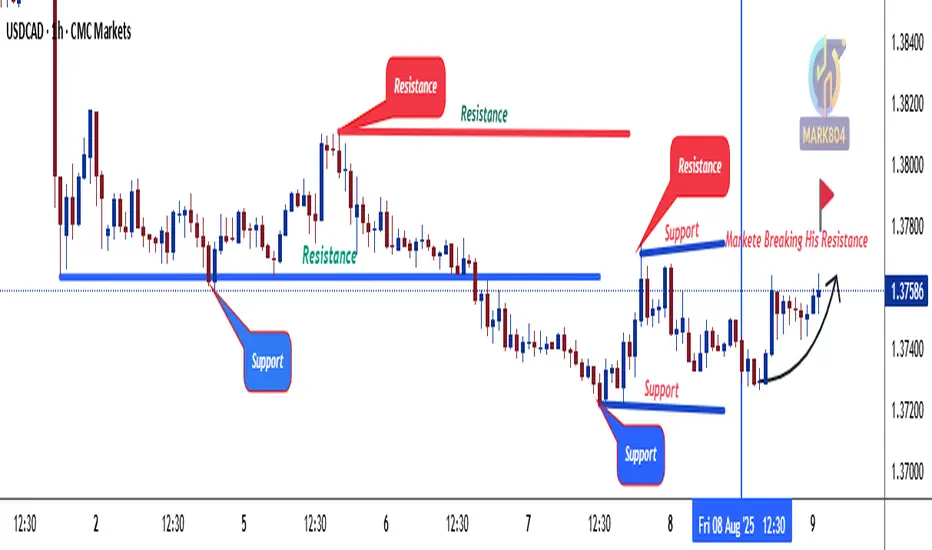
USDCAD Prepaing to Gilde Down ??USDCAD has been struglling to move up, All the monthly and Bi-Monthly analysis show down including D1. Check your support and resistances and open positions accordingly. Wait for Price Again to preform and see the strong breakouts.
Disclaimer:
The content presented in this IMAGE is intended solely for educational and informational purposes. It does not constitute financial, investment, or trading advice.
Trading foreign exchange (Forex) on margin involves a high level of risk and may not be suitable for all investors. The use of leverage can work both for and against you. Before deciding to participate in the Forex market, you should carefully consider your investment objectives, level of experience, and risk tolerance.
There is a possibility that you may incur a loss of some or all of your initial investment, and therefore, you should not invest money that you cannot afford to lose. Be fully aware of all the risks associated with foreign exchange trading, and seek advice from a licensed and independent financial advisor if you have any doubts.
Past performance is not indicative of future results. Always trade responsibly.

usdcad terlihat akan strong bullishConsider placing a buy stop in this area, as it represents a strong zone for potential upward movement. A confirmed breakout above this level could trigger further bullish momentum. However, if the price fails to break through and shows signs of rejection, shift your focus towards identifying selling opportunities instead.

USD/CAD BEARS ARE GAINING STRENGTH|SHORT
Hello, Friends!
USD/CAD pair is in the downtrend because previous week’s candle is red, while the price is obviously rising on the 4H timeframe. And after the retest of the resistance line above I believe we will see a move down towards the target below at 1.371 because the pair is overbought due to its proximity to the upper BB band and a bearish correction is likely.
Disclosure: I am part of Trade Nation's Influencer program and receive a monthly fee for using their TradingView charts in my analysis.
✅LIKE AND COMMENT MY IDEAS✅


USDCAD Sell Setup – Watch for Bearish Engulfing at 1.37727!USDCAD is approaching a key resistance zone at 1.37727, a level where sellers have stepped in before.
My plan is clear: I’ll be watching closely for a Bearish Engulfing candle on the 4H timeframe before pulling the trigger on a short position.
Here’s my breakdown:
Market Structure: Price is currently in a corrective move within a broader range, and 1.37727 has acted as a strong rejection zone in the past.
Entry Plan: Wait for a 4H Bearish Engulfing pattern at or near 1.37727 before entering short.
Target Levels:
TP1: 1.37000
TP2: 1.36450
Stop Loss: Above 1.38000 to allow room for false breakouts.
Why This Matters: A confirmed bearish engulfing here would suggest strong selling pressure and potential continuation to the downside.
Note: This is not financial advice. Always trade with discipline and risk management in place.
📊 Key Levels to Watch:
Resistance: 1.37727

Buy USDCADUSD CAD is in bullish based on breakout of range.
Cot summary also suggets a bullish dollar as commercial, smart money, holds most position.
Alligator is waking to feed his hunger (trend).

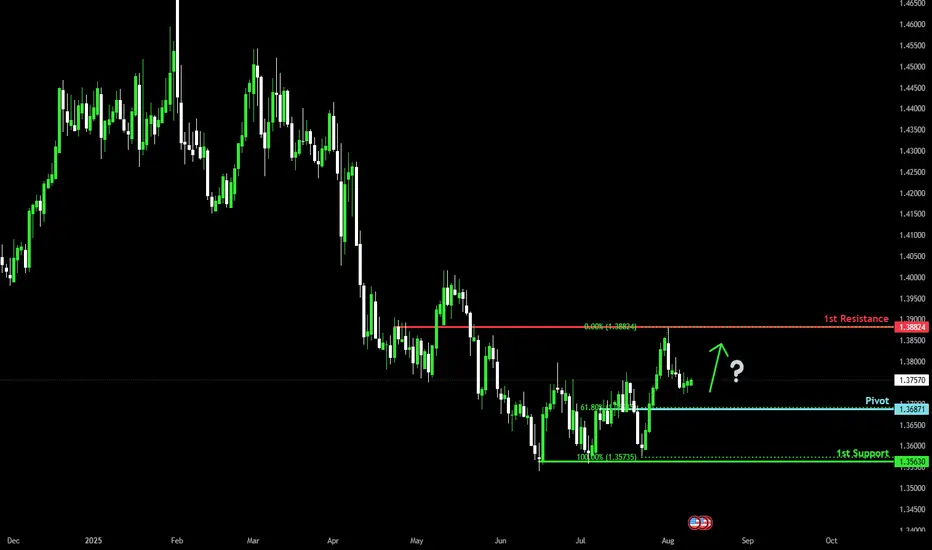
Falling towards 61.8% Fibonacci support?The Loonie (USD/CAD) is falling towards the pivot and could bounce to the pullback resistance.
Pivot: 1.3687
1st Support: 1.3563
1st Resistance: 1.3882
Risk Warning:
Trading Forex and CFDs carries a high level of risk to your capital and you should only trade with money you can afford to lose. Trading Forex and CFDs may not be suitable for all investors, so please ensure that you fully understand the risks involved and seek independent advice if necessary.
Disclaimer:
The above opinions given constitute general market commentary, and do not constitute the opinion or advice of IC Markets or any form of personal or investment advice.
Any opinions, news, research, analyses, prices, other information, or links to third-party sites contained on this website are provided on an "as-is" basis, are intended only to be informative, is not an advice nor a recommendation, nor research, or a record of our trading prices, or an offer of, or solicitation for a transaction in any financial instrument and thus should not be treated as such. The information provided does not involve any specific investment objectives, financial situation and needs of any specific person who may receive it. Please be aware, that past performance is not a reliable indicator of future performance and/or results. Past Performance or Forward-looking scenarios based upon the reasonable beliefs of the third-party provider are not a guarantee of future performance. Actual results may differ materially from those anticipated in forward-looking or past performance statements. IC Markets makes no representation or warranty and assumes no liability as to the accuracy or completeness of the information provided, nor any loss arising from any investment based on a recommendation, forecast or any information supplied by any third-party.
trade idea: Aug 10 - UJ Asia HTF: 4Hr shows support in the last two moves, if we break above key levels or blow, could be the beginning of a trend.
MTF: 30min - Marked off key levels
ETF: 5min - On break of the key level

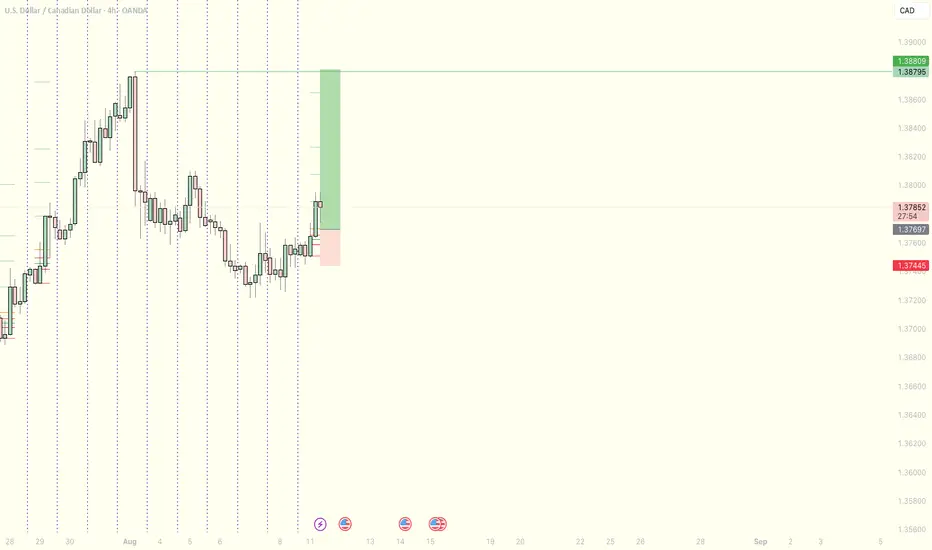
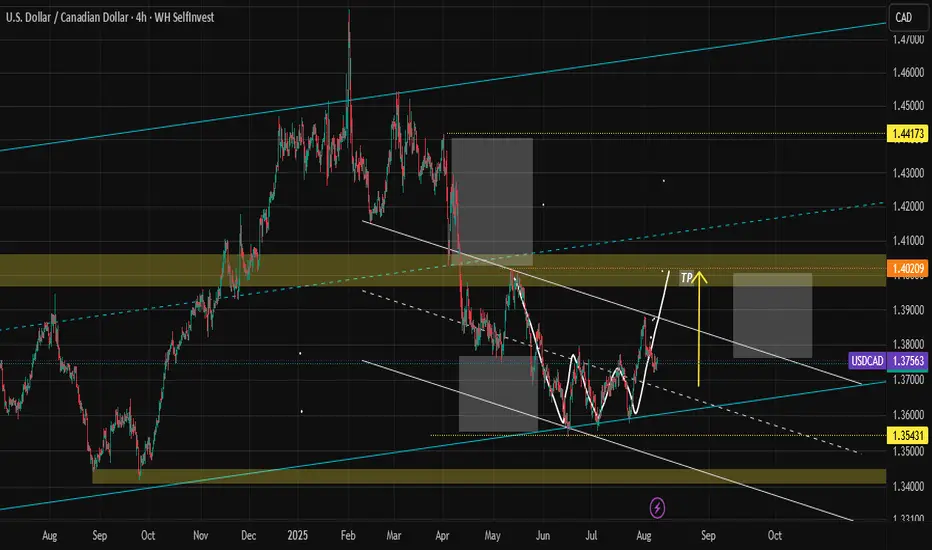
USDCADProbability of reaching the TP (rise to the 1.4020 area): about 65% to 70%
Probability of reversal before reaching the TP: about 30% to 35%
USDCAD TRADE SETUPWait for breakout the structure then take a trade for Market bias otherwise skip this setup

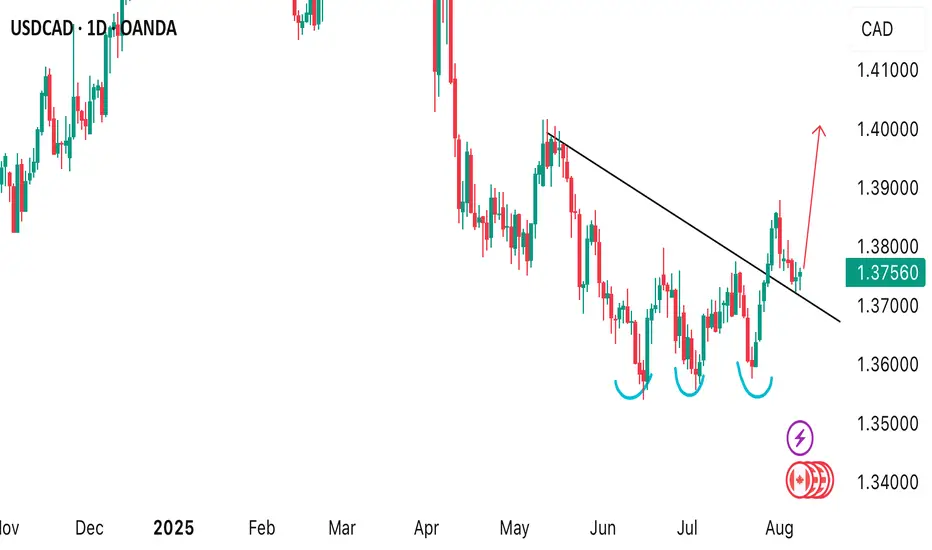
TRIPPLE BUTTON REVERSAL PATTERN ON USDCAD USDCAD look promising for a buy as we saw a triple button reversal pattern formation which successfully broke the neckline and currently retesting it. A buy opportunity is expected this coming week.
USDCAD 1H sell analysislooking for sell opportunities if/when the market hits the 1H order block + fvg area
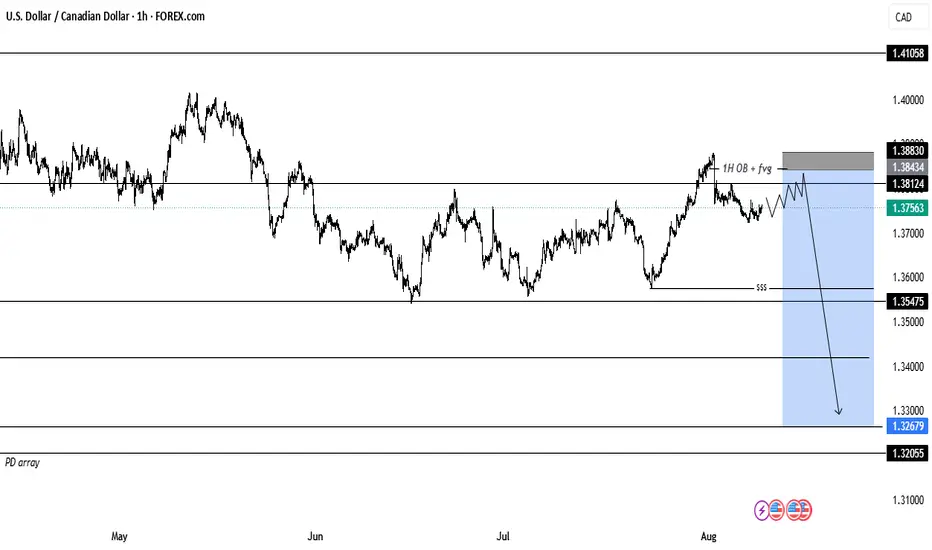
USDCAD Potential DownsidesHey Traders, in the coming week we are monitoring USDCAD for a selling opportunity around 1.37700 zone, USDCAD is trading in a downtrend and currently is in a correction phase in which it is approaching the trend at 1.37700 support and resistance area.
Trade safe, Joe.
USD/CADLooking for a bullish breakout here
Been in a downtrend for a while now and looking for a bullish breakout
Already rejected and showed a higher low on the retest and aiming for local high
USD strong after some positive SEC replacement news to add strength
I also have another trade shorting EUR/USD if you want to check that out!
Lets see how we go!

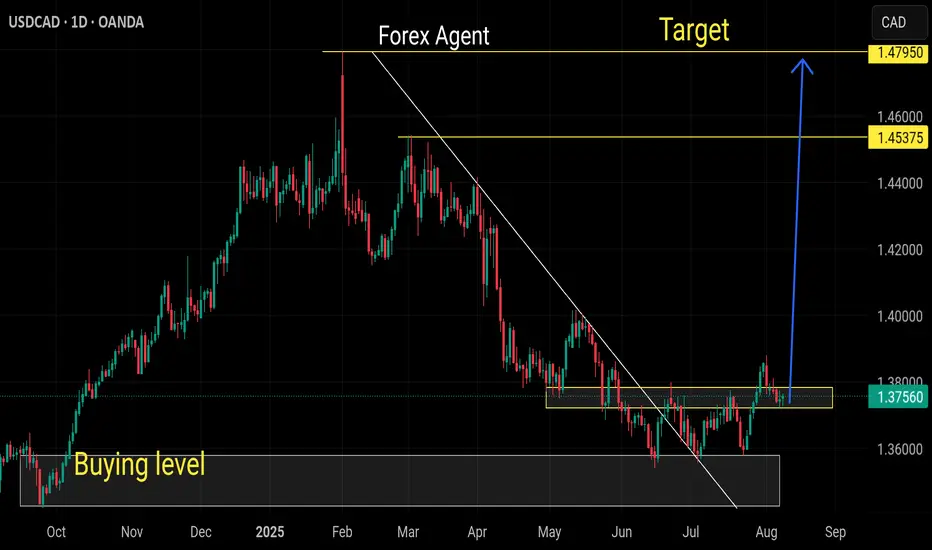
USD/CAD – Bullish ScenarioUSD/CAD – Bullish Scenario
Bias: Bullish, expecting upside continuation.
Current Structure: Price is holding above a key daily support level.
Plan:
As long as support holds, the bullish structure remains valid.
Look for bullish confirmations on lower timeframes — such as a fair value gap or a break of short-term highs.
First major upside target is the next daily resistance.
Extended target at the higher resistance zone if momentum is strong.
Invalidation: A daily close below support will void this bullish plan and require reassessment.
Summary:
Holding support and looking for bullish continuation toward the next resistance zone, with potential for further extension if momentum continues.


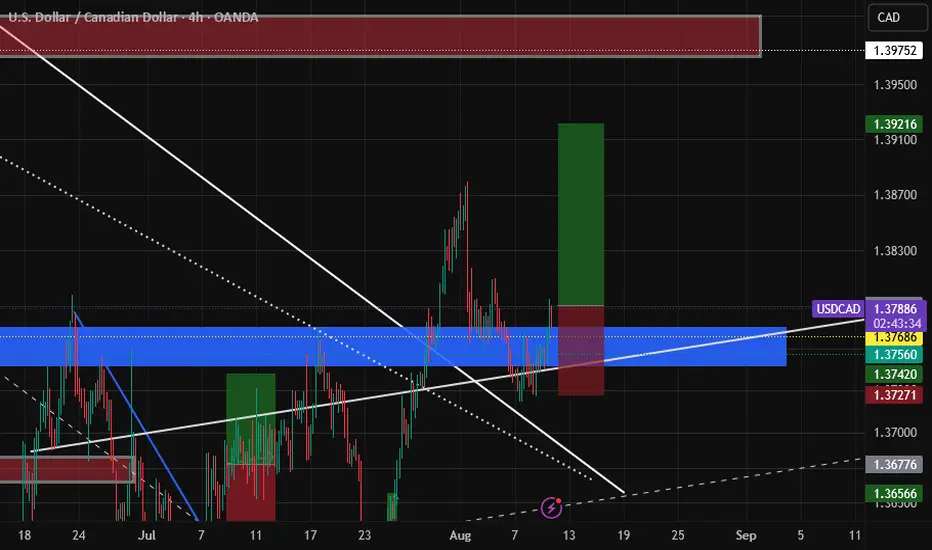
Next week sell USDCAD upon retracementHave a great weekend guys, for next week I am going to sell USDCAD upon retracement, targeting at the purple line there, coincidence with fibo 423.6. Reason is price had rejected the lower low level with great reversal candle, high chance continuing the big trend which is the downtrend. In previous I had posted that double bottom may formed and right now from candlestick analysis it seems the pattern no longer valid. Cheers~

USDCAD BEARISH ZONE COMESUP Current Technical Landscape
Market Sentiment & Drivers
The USD/CAD has risen modestly following Canada’s weak jobs data showing a −40.8 k drop in employment, raising expectations of dovish Bank of Canada policy and fueling a weaker Loonie.
Meanwhile, signals of a more dovish Fed—especially after Trump’s appointed governor tone—have added further downward pressure on the USD.
Key Levels & Technical Indicators
ActionForex (Intraday):
4H MACD has crossed above its signal, neutralizing bias for now.
Break below 1.3720 could target a deeper fall back to 1.3538 — the recent corrective low.
Break above 1.3809 would invalidate that bearish view and suggest a retest of 1.3878.
ActionForex (Weekly):
The pair hovered around 1.3720 last week with a neutral weekly bias.
A downside break could confirm continuation of the corrective decline toward 1.3538.
A bullish breakout beyond 1.3809 could lead to a retest of 1.3878 and possibly higher.
StockTA (as of July 28):
Overall sentiment remains bearish (score: −0.26), particularly in the short-term (−0.48).
Key resistance cluster around 1.47 to 1.45, with multiple levels noted between 1.47 and 1.37.
Support appears near 1.36, based on their analysis.
Marketscreener (latest in July):
Short-term trend: Neutral; Mid-term trend: Bearish; Long-term trend: Neutral.
Short-term resistance: 1.3733, support: 1.3571.
Mid-term resistance: 1.3978, support: 1.3571.
Long-term resistance: 1.4524, support: 1.3490.
Interpretation: Bearish Zone “Coming Up”
The phrase “bearish zone comes up” likely refers to the pair approaching a key resistance area where bearish reversal pressure is increasing. Currently:
1.3720–1.3809 is a critical near-term range. A failure to break above 1.3809 may invite renewed downside toward 1.3538.
Medium-term resistance clusters between 1.37 and 1.40 are also zones where bearish setups may form.
Broader resistance around 1.45–1.47 remains the major structural ceiling, although this lies further out unless the bias shifts.
Strategy Considerations
Bearish setup: Wait for rejection near 1.38, ideally with confirmation (e.g. bearish candle, MACD crossover). A break below 1.3720 could accelerate retest of 1.3538.
Bullish invalidation: A sustained move above 1.3809 could negate the immediate bearish bias, opening targets back toward 1.3878 and beyond.