Sell USDCAD USDCAD Bearish Idea. It seems as though the entire USD index is negative today. A bearish flag can be seen on the 4hr chart on USDCAD this Tuesday.
CADUSD trade ideas

BoC signals two-way USDCAD opportunities Bank of Canada Governor Tiff Macklem has commended US Federal Reserve Chair Jerome Powell's for managing of a difficult environment well, and pointed out that political attacks on the Fed from President Trump are a concern for the BoC too.
For USDCAD, this means traders might start viewing Canada’s central bank as acting more independently, instead of just following the Fed. This could create more two-way trading opportunities.
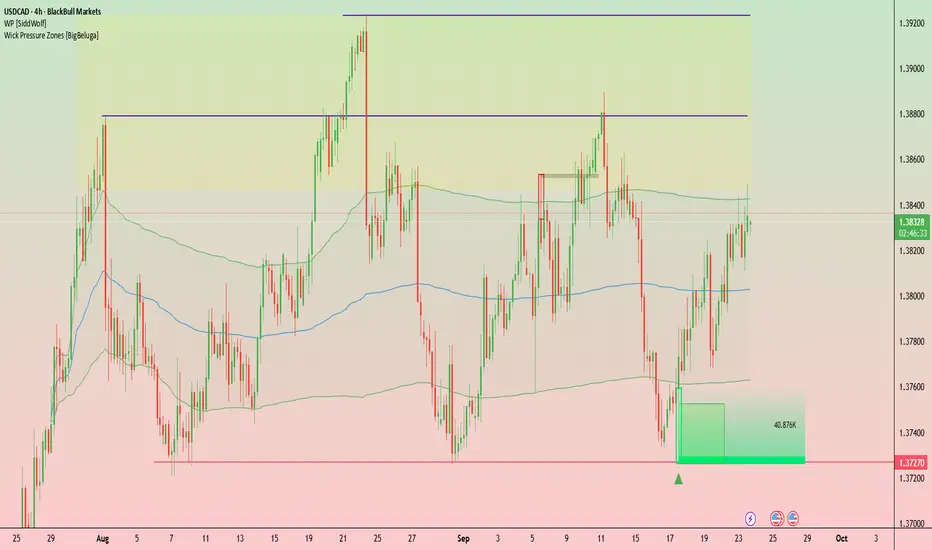
On the 4-hour chart, USDCAD has shown clear range dynamics: immediate resistance sits near 1.3845–1.3880, a zone repeatedly rejecting advances through September, while the 1.3720 area has acted as strong demand. The higher lows since mid-September could suggest buyers are building strength though.
USD/CAD - Bearish Flag (15.09.2025)The USD/CAD Pair on the M30 timeframe presents a Potential Selling Opportunity due to a recent Formation of a Bearish Flag Pattern. TRADENATION:USDCAD
This suggests a shift in momentum towards the downside in the coming hours.
Possible Short Trade:
Entry: Consider Entering A Short Position around Trendline Of The Pattern.
Target Levels:
1st Support – 1.3814
2nd Support – 1.3796
🎁 Please hit the like button and
🎁 Leave a comment to support for My Post !
Your likes and comments are incredibly motivating and will encourage me to share more analysis with you.
Best Regards, KABHI_TA_TRADING
Thank you.

USD.CADAlready in play. Capitalising off DXY Weakness and last week OB.
Look for continuation entry if interested. Do the work

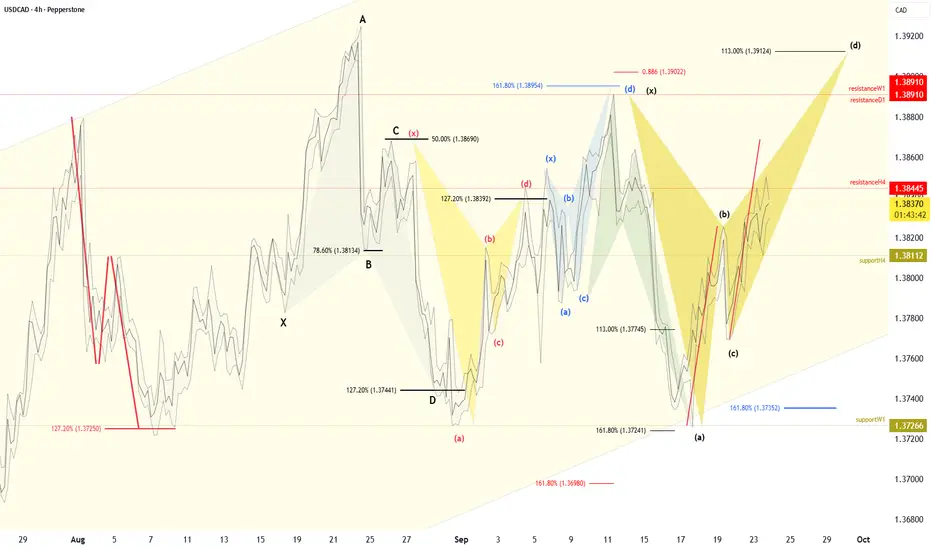
USDCAD | Yield Gap Supports Wave (y) Push to 1.40
The U.S.–Canada yield spread has widened back toward 1.0%, reflecting hawkish Fed–dovish BoC divergence. This has underpinned broad USD strength and weighed on the CAD.
Technical Lens:
USDCAD has progressed into wave (y) of the corrective structure, breaking through interim resistance and testing the upper channel toward the 1.40 region. The structure remains constructive as long as the channel holds, with the Elliott count framing 1.40 as a key inflection point.
Scenarios:
If the yield gap continues to widen and the channel holds → potential extension to 1.40.
If spreads narrow and price rejects 1.40 → pullback toward mid-channel support near 1.37–1.38.
Catalysts:
U.S. economic data & Fed communication.
Canadian growth signals and BoC policy stance.
Oil price stability (limited CAD support so far).
Takeaway:
The 1.40 zone is the decision point where macro divergence and technical structure converge.

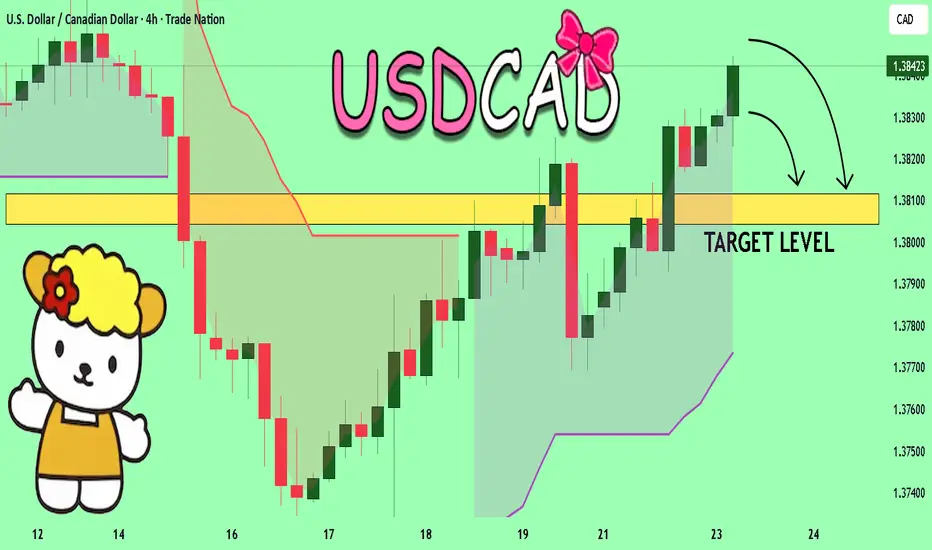
USDCAD Fall Expected! SELL!
My dear subscribers,
This is my opinion on the USDCAD next move:
The instrument tests an important psychological level 1.3841
Bias - Bearish
Technical Indicators: Supper Trend gives a precise Bearish signal, while Pivot Point HL predicts price changes and potential reversals in the market.
Target - 1.3811
About Used Indicators:
On the subsequent day, trading above the pivot point is thought to indicate ongoing bullish sentiment, while trading below the pivot point indicates bearish sentiment.
Disclosure: I am part of Trade Nation's Influencer program and receive a monthly fee for using their TradingView charts in my analysis.
———————————
WISH YOU ALL LUCK
USDCAD Long Trade OANDA:USDCAD Long Trade
Entry: 0.37700 - 0.37880
TP: 0.38096
This is good trade.
Don't overload your risk like Greedy gambler!!!
Be Disciplined Trader, risk what you can afford.
Use proper risk management.
Disclaimer: Trading is risky, only idea, not advice.

CAD Weakens, USDCAD Pushes AheadOn September 23, 2025, the Canadian dollar fell to an 11-day low as the interest rate spread between the U.S. and Canada widened further. This continued to put pressure on the CAD, giving USDCAD strong upward momentum.
Looking at the chart, USDCAD is moving steadily within an ascending channel. The current price around 1.3890, after a minor consolidation, has the potential to test the 1.3900 resistance zone. This is a key level — if broken decisively, the bullish trend will be reinforced and extended.
On the downside, the 1.3830 support zone remains the key level to hold the trend. As long as price stays above this area, the strategy favors buying with the trend.
In summary : USDCAD is in a clear uptrend, with fundamentals supporting the bulls. The immediate target is 1.3900, with potential for higher gains if CAD weakness continues.

USDCAD SHORT Market structure bearish on HTFs 3
Entry on both Weekly and Daily AOi
Weekly Rejection at AOi
Previous Weekly Structure Point
Daily Rejection at AOi
Previous Daily Structure Point
Around Psych Level 1.38000
Touching EMA H4
H4 Candlestick rejection
Rejection from Previous structure
Levels
Entry 120
REMEMBER : Trading is a Game Of Probability
: Manage Your Risk
: Be Patient
: Every Moment Is Unique
: Rinse, Wash, Repeat!
: Christ is King.

USD/CAD BEARISH BIAS RIGHT NOW| SHORT
USD/CAD SIGNAL
Trade Direction: short
Entry Level: 1.387
Target Level: 1.379
Stop Loss: 1.392
RISK PROFILE
Risk level: medium
Suggested risk: 1%
Timeframe: 12h
Disclosure: I am part of Trade Nation's Influencer program and receive a monthly fee for using their TradingView charts in my analysis.
✅LIKE AND COMMENT MY IDEAS✅

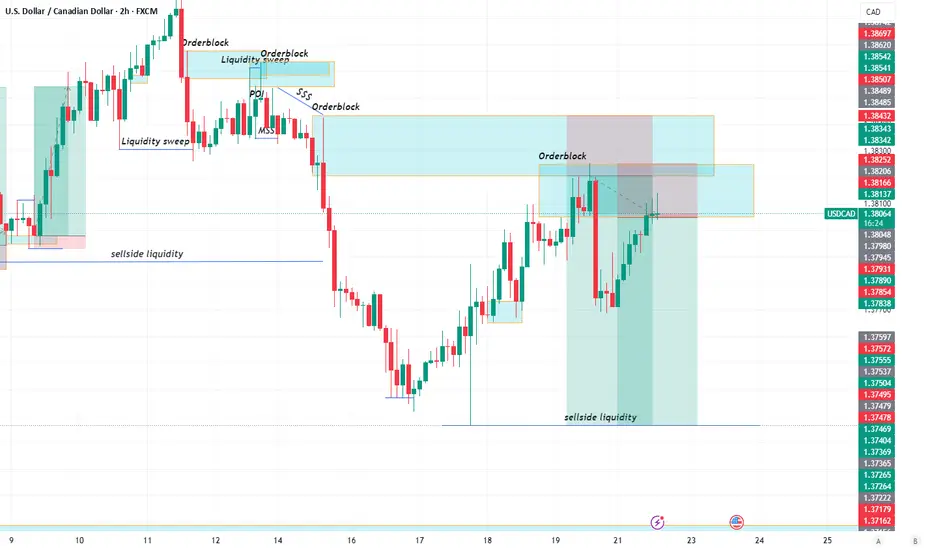
USDCAD SELL!! price rallied up slightly to tap into the 2hrly orderblock anticipating a sell to the previous low from here
Short Trade on USDCADShort term trend is down
Selling pressure is strong
price approach strong supply zone.

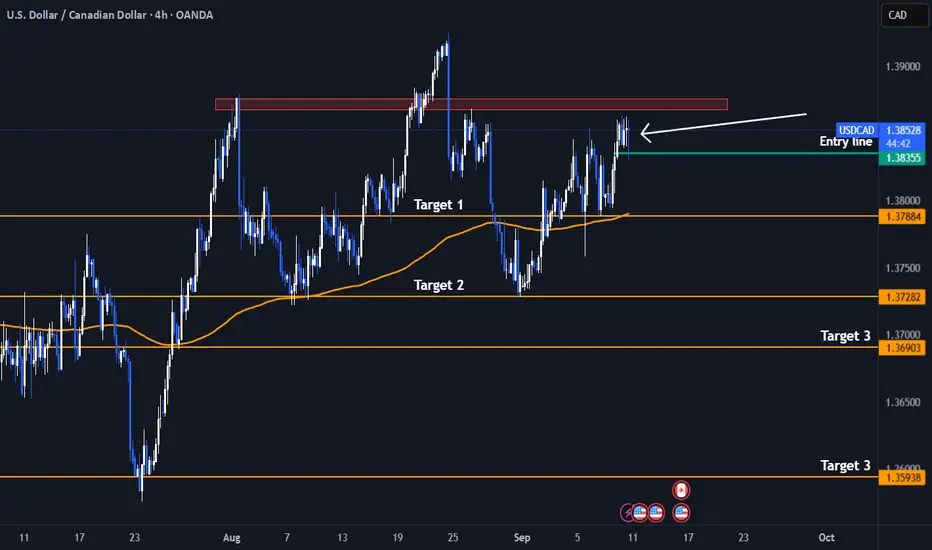
Short! Short! USDCAD - Double Head and Shoulder PatternI have identified a clear head and shoulders pattern forming within a larger head and shoulders structure on the daily timeframe for USD/CAD, indicating a potential bearish reversal.
From a fundamental perspective, several key factors are contributing to the current weakness in the Canadian dollar against the US dollar:
Canada's labor market showed significant weakness in August 2025, with a notable loss of 65.5 thousand jobs and a rise in unemployment to 7.1%, the highest in years. This has increased market expectations for monetary easing from the Bank of Canada (BoC).
Although core inflation remains above target, the weak jobs data is pushing the BoC towards potential rate cuts or a more accommodative policy stance, which weighs on the Canadian dollar.
The market is currently pricing in a very high chance (around 98%) of an additional rate cut by the BoC in September, following previous reductions to 2.75%. This dovish stance contrasts with the Federal Reserve’s more cautious or hawkish approach, creating a wider interest rate differential that supports US dollar strength.
Additionally, declining oil prices, a major export for Canada, are exerting further downward pressure on the CAD.
While recent US economic data has been mixed, the Fed is generally seen as less dovish than the BoC, sustaining demand for the USD.
Trade tensions and geopolitical risks between the US and Canada add to concerns over Canada’s growth outlook, contributing to CAD depreciation risk.
Trade Tip
A strong close below the Entry line will be a perfect entry /4hr TF
Stoploss : Above the Left Shoulder (Red Rectangle)
In summary, the combination of a weakening Canadian economy, dovish BoC bias, lower oil prices, and interest rate divergence between the US and Canada all support a bearish outlook for USD/CAD, which aligns well with the bearish head and shoulders pattern I have spotted on the chart.
Not an Investment Advise
USD/CAD Forecast (1H)🔥 USD/CAD Forecast (1H Breakdown)
🕰 Weekly View
Market is sitting in a bigger swing range.
We had a strong sell-off, but bulls are clawing back — retracing into mid-range supply.
Momentum leaning corrective → buyers probing liquidity before any bigger move.
📅 Daily View
Clear demand base built around 1.3720s.
Price stair-stepped higher with higher lows, heading back toward the 1.3890–1.3920 daily supply pocket.
Structure is short-term bullish, but daily still hovering inside a corrective leg.
⏳ 4H View
Several internal BOS (i-BOS) prints on the way up → strong intraday bullish order flow.
We’re now reacting from internal range supply.
Below, SSL + imbalance + fib 71% confluence sits at 1.3780–1.3800 = 🔑 reload zone.
⏱ 1H View
BSL swept, sellers testing the entry zone.
Expecting a pullback into SSL/71% → if buyers hold, 🚀 continuation higher.
If price smashes swing low, bullish idea invalid and shorts take over.
🎯 Forecast Summary
📍 Bias : Bullish but expecting a dip before continuation
🎯 Upside Target: 1.3890–1.3920
🪙 Reload Zone: 1.3780–1.3800
❌ Invalidation: Clean break of swing low


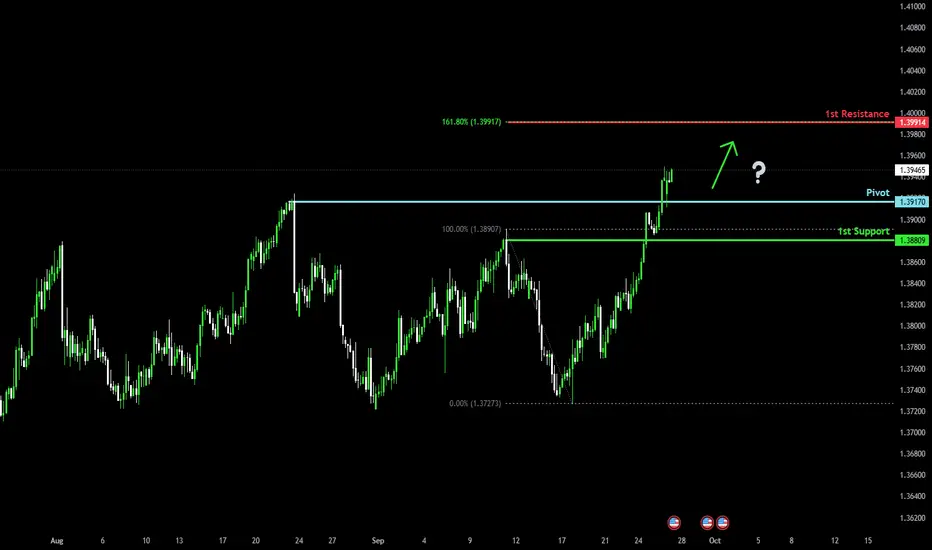
Bullish momentum to extend?The Loonie (USD/CAD) has bounced off the pivot and could rise to the 1st resistance.
Pivot: 1.3917
1st Support: 1.3880
1st Resistance: 1.3991
Disclaimer:
The above opinions given constitute general market commentary, and do not constitute the opinion or advice of IC Markets or any form of personal or investment advice.
Any opinions, news, research, analyses, prices, other information, or links to third-party sites contained on this website are provided on an "as-is" basis, are intended only to be informative, is not an advice nor a recommendation, nor research, or a record of our trading prices, or an offer of, or solicitation for a transaction in any financial instrument and thus should not be treated as such. The information provided does not involve any specific investment objectives, financial situation and needs of any specific person who may receive it. Please be aware, that past performance is not a reliable indicator of future performance and/or results. Past Performance or Forward-looking scenarios based upon the reasonable beliefs of the third-party provider are not a guarantee of future performance. Actual results may differ materially from those anticipated in forward-looking or past performance statements. IC Markets makes no representation or warranty and assumes no liability as to the accuracy or completeness of the information provided, nor any loss arising from any investment based on a recommendation, forecast or any information supplied by any third-party.
USD/CAD Head and Shoulders patternA clear Head and Shoulders formation has developed. Left Shoulder (~1.3850), Head (~1.3950), and Right Shoulder (~1.3850). Price is now retesting the neckline zone around 1.3730–1.3750.
Normally this pattern formed when it's end of a trend.
So its safer to wait until the break of the support and establishing below the Resistance to enter.

USD/CAD Shorts?Previous AOI which didn't get mitigated could be useful now.
Take partials as price goes lower

Breakout or Fakeout? Loonie at a Critical JuncturePEPPERSTONE:USDCAD is currently trading around 1.3836, after breaking above the key resistance level at 1.3825 earlier in the session. This breakout may have shifted momentum in favor of the bulls, but the pair now faces a new intraday fractal resistance at 1.3844 , which it is currently testing. A clean break above this barrier could open the door for further upside toward the weekly fractal resistance at 1.3891 .
The 1.3891 level remains pivotal, as it coincides with previous highs and represents a strong resistance zone. Should the market approach this area, price action will need to be monitored closely. A failure to break decisively higher could lead to the formation of a bearish Alt-Bat harmonic pattern, projected slightly above at 1.3912 .
In the near term, the battle between 1.3844 intraday resistance and 1.3811 intraday support will be crucial for short-term positioning. A sustained move above 1.3844 would strengthen the case for a test of 1.3891, while a failure to hold above 1.3811 could trigger another pullback toward the weekly fractal support.
Safe Trades,
André Cardoso
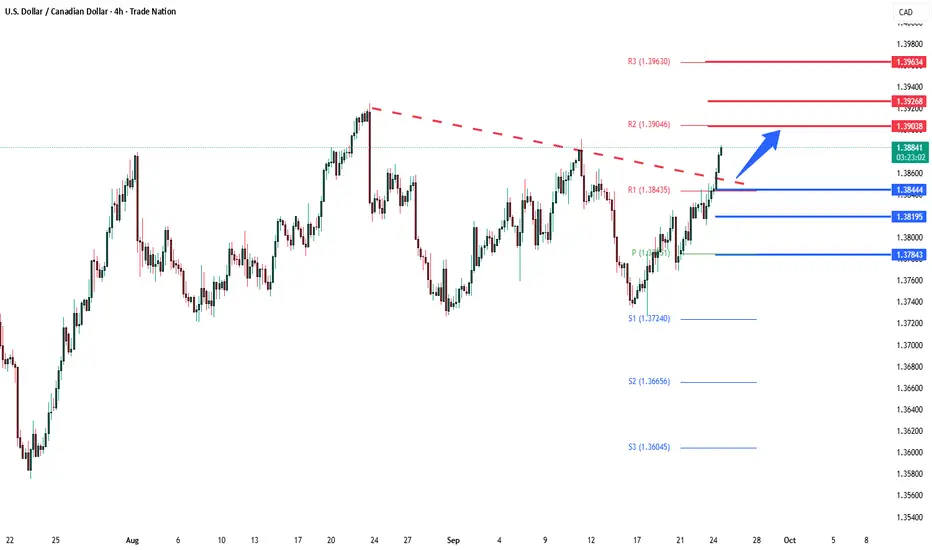
USDCAD bullish breakout support at 1.3844The USDCAD remains in a bullish trend, with recent price action showing signs of a corrective pullback within the broader uptrend.
Support Zone: 1.3844 – a key level from previous consolidation. Price is currently testing or approaching this level.
A bullish rebound from 1.3844 would confirm ongoing upside momentum, with potential targets at:
1.3900 – initial resistance
1.3930 – psychological and structural level
1.3960 – extended resistance on the longer-term chart
Bearish Scenario:
A confirmed break and daily close below 1.3844 would weaken the bullish outlook and suggest deeper downside risk toward:
1.3820 – minor support
1.3780 – stronger support and potential demand zone
Outlook:
Bullish bias remains intact while the USDCAD holds above 1.3844. A sustained break below this level could shift momentum to the downside in the short term.
This communication is for informational purposes only and should not be viewed as any form of recommendation as to a particular course of action or as investment advice. It is not intended as an offer or solicitation for the purchase or sale of any financial instrument or as an official confirmation of any transaction. Opinions, estimates and assumptions expressed herein are made as of the date of this communication and are subject to change without notice. This communication has been prepared based upon information, including market prices, data and other information, believed to be reliable; however, Trade Nation does not warrant its completeness or accuracy. All market prices and market data contained in or attached to this communication are indicative and subject to change without notice.
USDCAD Bulls Building Momentum as Loonie WeakensUSDCAD has bounced strongly from recent lows, with buyers regaining control and pushing the pair toward key resistance levels. The move reflects a combination of weaker Canadian fundamentals and resilient USD demand. With oil prices under pressure and the Bank of Canada leaning dovish, the stage looks set for USD strength to continue pressing higher against the CAD.
Current Bias
Bullish – price structure favors further upside toward resistance.
Key Fundamental Drivers
Federal Reserve: While the Fed is moving toward gradual easing, safe-haven demand and inflation risks from tariffs keep the dollar supported.
Bank of Canada: Markets price a high probability of another BoC rate cut, reflecting weak labor market data and slowing growth.
Oil Prices: Crude remains soft near the low $60s, weighing directly on the CAD as energy exports weaken.
Macro Context
Interest Rates: The Fed is cautious but still less dovish than the BoC, creating policy divergence that favors USD.
Economic Growth: Canada’s GDP contracted in Q2, and labor data confirms rising unemployment; meanwhile, the U.S. economy, though slowing, is relatively stronger.
Commodity Flows: Oil remains CAD’s key driver, and falling prices keep downside pressure on the currency.
Geopolitics: U.S. tariffs on Canadian auto parts and broader trade uncertainty add extra headwinds for Canada.
Primary Risk to the Trend
A sharp rebound in oil prices or surprisingly hawkish comments from the BoC could reverse the bullish momentum.
Most Critical Upcoming News/Event
Canada GDP and employment reports
U.S. PCE inflation data
BoC policy meeting outlook
Leader/Lagger Dynamics
USDCAD often acts as a lagger to oil moves, with crude leading sentiment on CAD. However, in times of strong USD demand, USDCAD can act as a leader for CAD crosses like CADJPY and AUDCAD.
Key Levels
Support Levels: 1.3738, 1.3668
Resistance Levels: 1.3826, 1.3891
Stop Loss (SL): 1.3668 (below recent swing support)
Take Profit (TP): 1.3826 (first target), extension to 1.3891
Summary: Bias and Watchpoints
USDCAD carries a bullish bias, supported by weaker Canadian data, softer oil prices, and dovish BoC expectations. A stop loss below 1.3668 protects against downside risks, while targets at 1.3826 and 1.3891 keep focus on upside continuation. Watch Canadian GDP and employment data closely, alongside U.S. PCE inflation, as key catalysts. The pair remains reactive to oil prices but could act as a leader for CAD crosses if USD strength dominates.

USDCAD SELLTargets far down below @ 1.36975 & 1.35980 - 1.2bn @ 1.38030 (TP2) - Bank Targets @ 1.37035 (TP3) - Retail Trendline TP1 if it does not break immediately. Good Luck!

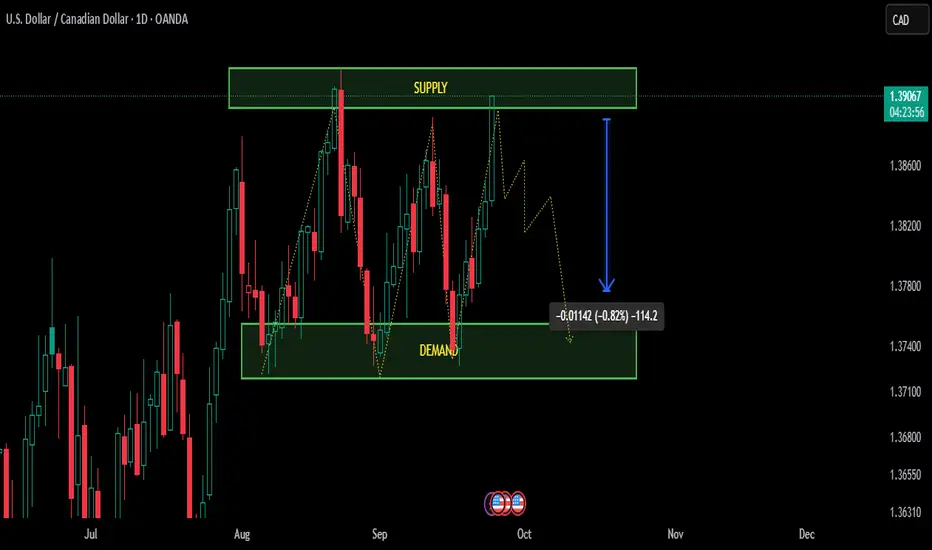
A perfect Supply and Demand USDCADA perfect Supply and Demand is created by the market on daily time frame, But maybe possible a little bit Liquidity sweep maybe created before down trend on above the supply zone ...
IMPORTANT POINTS;
PAIR: USDCAD
TIME FRAME: Daily
Liquidity sweeps maybe created by market makers be aware
Always put STOPLOSS