USD/CAD: Bearish Loonie SlideUSD/CAD: Bearish Loonie Slide Amid #Fed Cut Hype and #Forex Volatility Buzz? 1.39 Breakout Target in Sight?
USD/CAD is trading at 1.3795 today, up 0.17% amid a rebound from 1.3728 lows as markets eye the Fed's rate decision later, with 65% odds of a 50bps cut to 4.00-4.25% pressuring the dollar but offset by BoC's own easing signals.
This follows a 0.25% CAD gain earlier in the week on CPI data, but the pair remains range-bound with analysts forecasting a bearish tilt to 1.35 by year-end if Fed cuts deepen.
Just as #Fed surges with 15K mentions on X amid rate speculation, and #Forex trends spotlight policy divergence (e.g., BoC vs. Fed easing), USD/CAD's sensitivity to oil and CAD vulnerability position it for choppy action in the $1.8T daily forex market.
But with volatility at 3.88%, is USD/CAD undervalued for a bull run to 1.39, or will dovish Fed trigger a CAD rebound? Let's break down the fundamentals, SWOT, charts, and setups for September 18, 2025.
Fundamental Analysis
USD/CAD's trajectory hinges on diverging central bank paths, with the BoC's recent cuts weakening the loonie while Fed easing caps USD upside—yet oil prices above $70/bbl support CAD via Canada's export reliance.
Analysts project a 2025 average of 1.35, bearish on CAD amid #Fed cuts, but short-term resistance at 1.3800 could hold if US data softens. With #Forex volatility buzzing, the pair's undervaluation shines in a risk-on environment if Fed delivers 50bps, but sticky US inflation (2.6% core) risks a hawkish pivot.
- **Positive:**
- BoC easing and CAD vulnerability amid #Forex hype project USD strength to 1.3863 if Fed holds steady.
- Oil tailwinds and EM inflows (e.g., SA bonds) bolster CAD floors, undervaluing the pair at current levels vs. 1.40 peaks.
- Broader #Fed trends favor USD if dot plot signals fewer cuts, eyeing 0.5% monthly gains.
- **Negative:**
- Dovish Fed expectations weaken USD, clashing with #Fed optimism if 50bps cut confirms CAD rebound.
- Canada CPI resilience (2.0% YoY) could strengthen CAD if BoC pauses, pressuring the pair lower.
SWOT Analysis
**Strengths:** Policy divergence favors USD with Fed's relative hawkishness vs. BoC, amplified by #Fed relevance in dollar sentiment.
**Weaknesses:** High oil correlation exposes CAD upside; overbought momentum vulnerable in #Forex-shifting markets post-Fed.
**Opportunities:** Fed cut confirmation narrows spreads, with undervalued bull potential to 1.3891 amid #Fed boom.
**Threats:** Hawkish BoC surprises eroding gains; competition from AUD/CAD if commodity trends capitalize on #Forex volatility.
Technical Analysis
On the daily chart, USD/CAD rebounds in an ascending channel from 1.3728 support, with a pivot at 1.3800 mirroring #Fed volatility spikes. The weekly shows neutral bias with 1.3889 as key breakout. Current price: 1.3795, with VWAP at 1.3770 as intraday balance.
Key indicators:
- **RSI (14-day):** At 55, neutral—potential bull signal amid #Fed surge. 📈
- **MACD:** Histogram positive, crossover holding for upside.
- **Moving Averages:** Price above 21-day EMA (1.3750) but testing 50-day SMA (1.3820)—bullish if holds.
Support/Resistance: Support at 1.3728 (recent low), resistance at 1.3863 and 1.3891. Patterns/Momentum: Channel bounce targets 1.3863; fueled by #Forex momentum. 🟢 Bullish signals: Higher lows on volume. 🔴 Bearish risks: Failure at 1.3800 eyes 1.36.
Scenarios and Risk Management
- **Bullish Scenario:** Break above 1.3863 on hawkish Fed targets 1.3891; long on pullbacks to 1.3728, especially if #Fed signals fewer cuts.
- **Bearish Scenario:** Drop below 1.3728 eyes 1.3538; watch for CAD cross amid #Forex fade on dovish pivot.
- **Neutral/Goldilocks:** Range-bound 1.3728–1.3863 if dot plot mixed and #Fed cools.
Risk Tips: Use stops at 1.3700. Risk 1-2% per trade. Diversify to avoid correlation traps with #Fed-linked pairs like EUR/USD.
Conclusion/Outlook
Overall, a bullish bias if USD/CAD holds 1.3728, supercharged by today's #Fed and #Forex trends, with 0.7% upside to 1.39 on policy divergence. But watch the Fed outcome for confirmation—this fits September's rate volatility theme amid easing hype.
What’s your take? Bullish on USD/CAD amid #Fed cuts or fading the loonie? Share in the comments!
CADUSD trade ideas

USDCAD 1H longCurrently I'm in this trade 2 buy orders long,
2 limit buy orders still open
Price is still at a good place to step in imo.
Tomorrow high impact news for the CAD and USD so I expect some fireworks!
The plan is simple as always:
The price is already extended, clean drop down.
Support level visible on the 4H
No big pullbacks happend yet or consollidation zones
RSI oversold
- So I buy on the way down every 20 pips a limit buy order
- I exit when I make 2R profit
Let's goo
btw... EURUSD and USDCHF are aslo looking juicy

Bank of Canada lowers rates, Canadian dollar edges upwardsThe Canadian dollar has posted small gains on Wednesday. In the North American session, USD/CAD is trading at 1.3762, up 0.17% on the day.
There were no surprises from the Bank of Canada, which lowered its policy rate by a quarter-point to 2.5%, its lowest level since July 2022. This was the first time the Bank of Canada lowered rates since March, as it was forced to respond to signs of weakness in the economy and lower inflation.
The rate statement said that a rate cut was justified, given that the economy had weakened and there was less upside risk to inflation. The US tariffs were expected to have a further dampening effect on economic activity.
The statement made three references to the uncertainty of the economic outlook, which has required the BoC to act cautiously. At a follow-up press conference, Governor Macklem defended the rate cut due to a weaker labor market and less upside pressure on underlying inflation.
What was missing from the rate statement and press conference was any forward guidance about future rate cuts, as the central bank doesn't want to be pushed into any corners with regard to future decisions. If inflation risks continue to fade, the BoC could deliver one or even two rate cuts before the end of the year.
The Federal Reserve is virtually certain to lower rates at today's meeting, barring a monumental surprise. The expected rate cut would be the Fed's first since December 2024. With the rate decision virtually a given, investors will be looking for some clues as to whether the Fed is looking at further rates cuts before the end of the year.
USD/CAD is testing resistance at 1.3752. Above, there is resistance at 1.3770
There is support at 1.3721 and 1.3703


USDCAD short at current market price USDCAD is at POI now.
the risk is reasonable in my opinion and i'm short from here.
or else, zoom-in in lower time frame for reversal confirmation.
for H1 timeframe confirmation, yu can wait for the nearest support to be broken.
Good Luck

USD/CAD: Range-Bound with Recovery Attempt from Key SupportUSD/CAD continues to trade within a defined sideways channel, following a strong rejection near the 1.3925 resistance zone. The recent formation of a lower high has pushed price into the 1.3764–1.3693 support area, where buyers are attempting to hold the line.
A bounce from this demand zone could lead to a short-term recovery toward 1.3850, but the overall structure remains corrective. A clear break above the descending trendline would be needed to shift the momentum back in favor of the bulls and confirm a broader reversal.
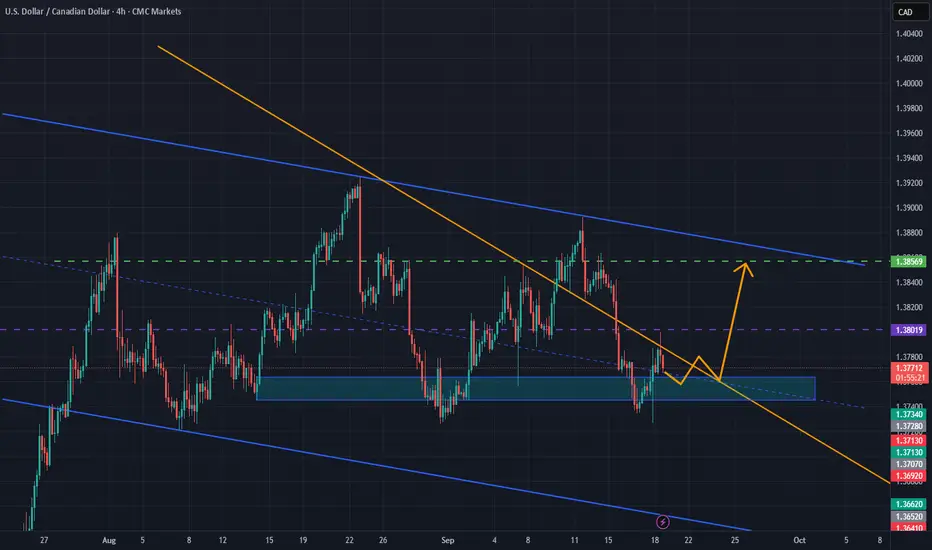
USD/CAD - Forecast🚨 USD/CAD – Key Levels in Play 🚨
🕰 Weekly View:
Price is trapped inside a 1.36 – 1.40 swing range.
Break above 1.40 → clean run into 1.44 – 1.46 supply.
Fail here → liquidity below 1.34 – 1.35 becomes the target.
📉 Daily Structure:
We’re moving inside a parallel channel, sitting mid-range at 1.38 – 1.39. Liquidity is building under 1.37 — sellers might want to grab that first.
⏱ 8H Play:
Rejection spotted at 1.38 – 1.385 supply.
➡️ Short-term pullback toward 1.37 demand looks likely.
➡️ If buyers defend that, we could see another push into 1.39 – 1.40.
📌 Outlook:
Short-term pullback 🔽 → Mid-term bullish if 1.37 holds.
Break under 1.37? Bears take control toward 1.35.
Follow for more

USDCAD – Bearish Channel Break📉 USDCAD – Bearish Channel Break
USDCAD has been moving inside a rising channel, but price has now closed below the lower boundary, suggesting potential bearish pressure.
🔎 Technical View
Rising channel structure respected since late August.
Current break below support could open the way toward 1.3780 – 1.3700.
Invalidated if price reclaims 1.3860 and sustains above.
📌 Key Levels
Resistance: 1.3860
Support: 1.3780 / 1.3750 / 1.3700
This setup highlights a shift in momentum worth keeping an eye on.
👍 If this analysis helps you:
Hit LIKE ❤️
Share your thoughts in the comments 💬
Follow for more clean technical breakdowns 📊
#USDCAD #Forex #TechnicalAnalysis #ChartPattern

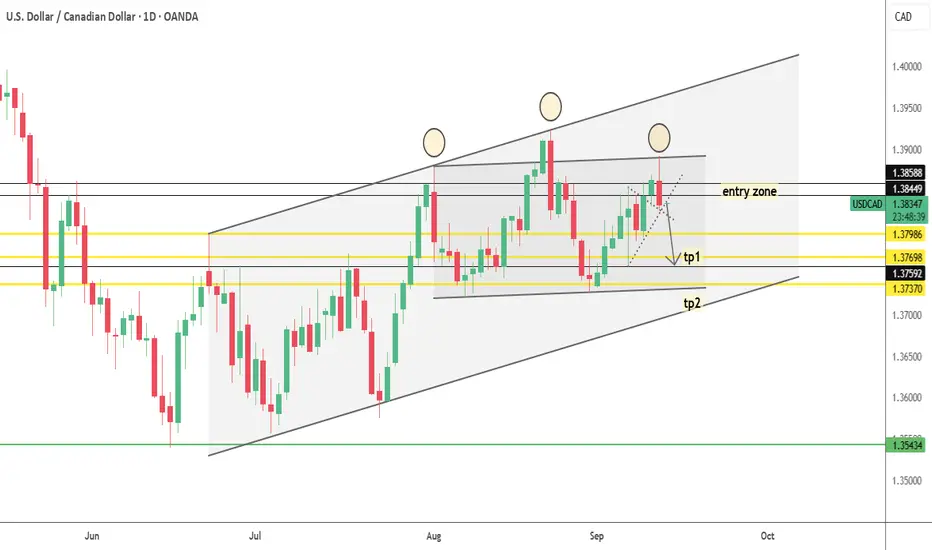
USDCAD Daily Head and ShouldersGoing into next week we have a nice head and shoulders pattern on the daily. This is also at a nice resistance level. We have recently broken out of a weekly channel so I think this will be the pattern we need to continue to the downside.

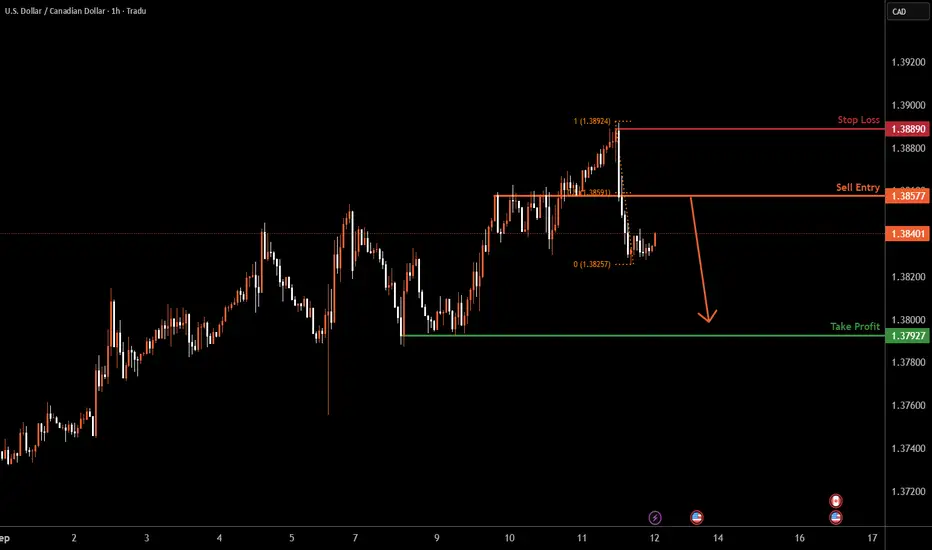
USDCAD H4 | Bearish reversal off overlap resistanceUSD/CAD is reacting off the sell entry which is an overlap resistance that lines up with the 61.8% Fibonacci retracement and could reverse from this level to the take profit.
Sell entry is at 1.3856, which is an overlap resistance that lines up with the 61.8% Fibonacci retracement.
Stop loss is at 1.3918, which is a swing high resistance that lines up with the 100% Fibonacci projection.
Take profit is at 1.3791, which is a pullback support that aligns with the 50% Fibonacci retracement.
High Risk Investment Warning
Trading Forex/CFDs on margin carries a high level of risk and may not be suitable for all investors. Leverage can work against you.
Stratos Markets Limited (tradu.com ):
CFDs are complex instruments and come with a high risk of losing money rapidly due to leverage. 65% of retail investor accounts lose money when trading CFDs with this provider. You should consider whether you understand how CFDs work and whether you can afford to take the high risk of losing your money.
Stratos Europe Ltd (tradu.com ):
CFDs are complex instruments and come with a high risk of losing money rapidly due to leverage. 66% of retail investor accounts lose money when trading CFDs with this provider. You should consider whether you understand how CFDs work and whether you can afford to take the high risk of losing your money.
Stratos Global LLC (tradu.com ):
Losses can exceed deposits.
Please be advised that the information presented on TradingView is provided to Tradu (‘Company’, ‘we’) by a third-party provider (‘TFA Global Pte Ltd’). Please be reminded that you are solely responsible for the trading decisions on your account. There is a very high degree of risk involved in trading. Any information and/or content is intended entirely for research, educational and informational purposes only and does not constitute investment or consultation advice or investment strategy. The information is not tailored to the investment needs of any specific person and therefore does not involve a consideration of any of the investment objectives, financial situation or needs of any viewer that may receive it. Kindly also note that past performance is not a reliable indicator of future results. Actual results may differ materially from those anticipated in forward-looking or past performance statements. We assume no liability as to the accuracy or completeness of any of the information and/or content provided herein and the Company cannot be held responsible for any omission, mistake nor for any loss or damage including without limitation to any loss of profit which may arise from reliance on any information supplied by TFA Global Pte Ltd.
The speaker(s) is neither an employee, agent nor representative of Tradu and is therefore acting independently. The opinions given are their own, constitute general market commentary, and do not constitute the opinion or advice of Tradu or any form of personal or investment advice. Tradu neither endorses nor guarantees offerings of third-party speakers, nor is Tradu responsible for the content, veracity or opinions of third-party speakers, presenters or participants.

USDCAD H1 | 50% Fibonacci resistance signals bearish reversalLoonie (USD/CAD) is rising towards the sell entry, which is a pullback resistance that aligns with the 50% Fibonacci retracement and could reverse from this level to the downside.
Sell entry is at 1.3857, which is a pullback resistance that aligns with the 50% retracement.
Stop loss is at 1.3792, which is a swing high resistance.
Take profit is at 1.3792, which is a pullback support.
High Risk Investment Warning
Trading Forex/CFDs on margin carries a high level of risk and may not be suitable for all investors. Leverage can work against you.
Stratos Markets Limited (tradu.com ):
CFDs are complex instruments and come with a high risk of losing money rapidly due to leverage. 65% of retail investor accounts lose money when trading CFDs with this provider. You should consider whether you understand how CFDs work and whether you can afford to take the high risk of losing your money.
Stratos Europe Ltd (tradu.com ):
CFDs are complex instruments and come with a high risk of losing money rapidly due to leverage. 66% of retail investor accounts lose money when trading CFDs with this provider. You should consider whether you understand how CFDs work and whether you can afford to take the high risk of losing your money.
Stratos Global LLC (tradu.com ):
Losses can exceed deposits.
Please be advised that the information presented on TradingView is provided to Tradu (‘Company’, ‘we’) by a third-party provider (‘TFA Global Pte Ltd’). Please be reminded that you are solely responsible for the trading decisions on your account. There is a very high degree of risk involved in trading. Any information and/or content is intended entirely for research, educational and informational purposes only and does not constitute investment or consultation advice or investment strategy. The information is not tailored to the investment needs of any specific person and therefore does not involve a consideration of any of the investment objectives, financial situation or needs of any viewer that may receive it. Kindly also note that past performance is not a reliable indicator of future results. Actual results may differ materially from those anticipated in forward-looking or past performance statements. We assume no liability as to the accuracy or completeness of any of the information and/or content provided herein and the Company cannot be held responsible for any omission, mistake nor for any loss or damage including without limitation to any loss of profit which may arise from reliance on any information supplied by TFA Global Pte Ltd.
The speaker(s) is neither an employee, agent nor representative of Tradu and is therefore acting independently. The opinions given are their own, constitute general market commentary, and do not constitute the opinion or advice of Tradu or any form of personal or investment advice. Tradu neither endorses nor guarantees offerings of third-party speakers, nor is Tradu responsible for the content, veracity or opinions of third-party speakers, presenters or participants.
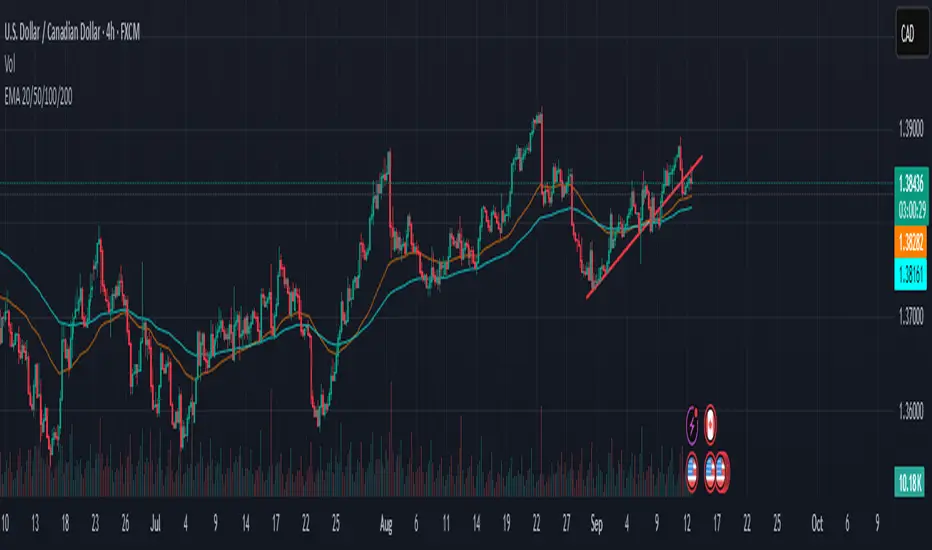
PERFECT USDCAD SHORT ENTRYI have a weekly short bias on FX:USDCAD , we can see a previous strong rejection of the weekly 50ema, and currently price is rejecting the level again. Moving into next week this gives a bearish bias.
Now moving down to the daily timeframe there looks to be a clear head and shoulders structure forming, with the previous days candle showing a bearish engulfing bar from a liquidity zone, I am bearish, and looking for a lower timeframe entry.
Now on the lower 1h timeframe I am seeing a bos to the downside with a double pin rejection of ema.
#
This break of trend, with all timeframes aligned, gives a perfect short setup imo.
Give a follow for more:)
Bearish setup in play?The Loonie (USD/CAD) has rejected off the pivot and could drop to the 1st support, which acts as a multi-swing low support.
Pivot: 1.3828
1st Support: 1.3729
1st Resistance: 1.3920
Disclaimer:
The above opinions given constitute general market commentary, and do not constitute the opinion or advice of IC Markets or any form of personal or investment advice.
Any opinions, news, research, analyses, prices, other information, or links to third-party sites contained on this website are provided on an "as-is" basis, are intended only to be informative, is not an advice nor a recommendation, nor research, or a record of our trading prices, or an offer of, or solicitation for a transaction in any financial instrument and thus should not be treated as such. The information provided does not involve any specific investment objectives, financial situation and needs of any specific person who may receive it. Please be aware, that past performance is not a reliable indicator of future performance and/or results. Past Performance or Forward-looking scenarios based upon the reasonable beliefs of the third-party provider are not a guarantee of future performance. Actual results may differ materially from those anticipated in forward-looking or past performance statements. IC Markets makes no representation or warranty and assumes no liability as to the accuracy or completeness of the information provided, nor any loss arising from any investment based on a recommendation, forecast or any information supplied by any third-party.


(USDCAD, 1-hour timeframe).(USDCAD, 1-hour timeframe), I see that you have drawn a bullish setup with:
Price breaking above a resistance zone (yellow box around 1.3860 – 1.3870).
An ascending trendline supporting the move.
Ichimoku cloud showing bullish momentum.
My chart already marks a "Target Point" around 1.3940.
📍 Target: Based on my analysis, the next resistance level is around 1.3940 – 1.3950.
That’s my immediate upside target if the breakout holds.
⚠ Watch for retests of 1.3860 support (former resistance) before continuation.

Market Watch – USD/CAD Pullback Setup?USD/CAD is currently in a steady uptrend and is making a possible pullback into a well-defined support/resistance zone.
We’ll keep an eye on this one for confirmation:
✅ Engulfing candle trigger
✅ Strong volume
✅ Momentum hooking in alignment
⚔️ War Room Lesson: An uptrend plus a clean pullback into structure often sets the stage for high-quality trades — but only if the signals line up. Until then, patience.

USDCADThe trend in the USD/CAD currency pair is bullish. In the range of 1.38356 to 1.38113, after confirmation, this area could provide a good buying opportunity. ✅


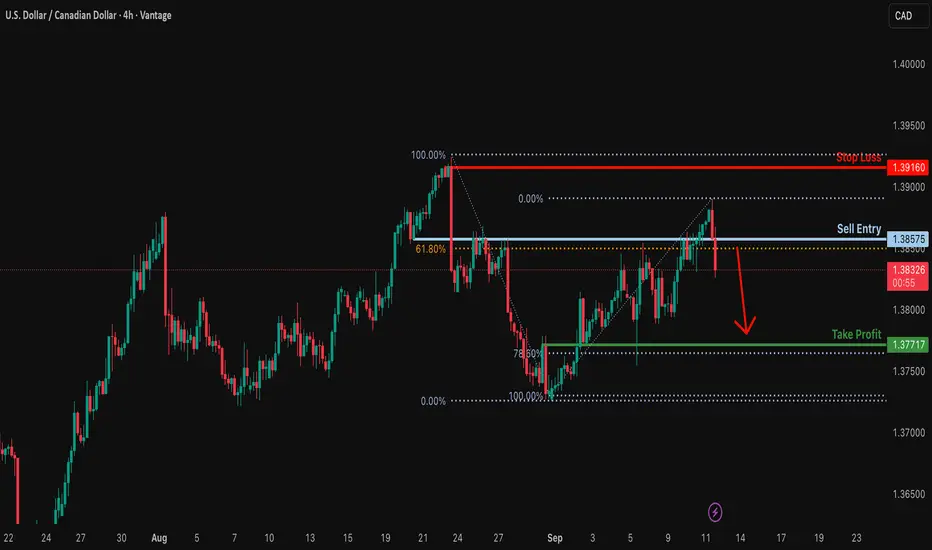
Potential bearish drop?USD/CAD is reacting off the resistance level which is a pullback resistance that aligns with the 61.8% Fibonacci retracement and could drop from this level to our take profit.
Entry: 1.3857
Why we like it:
There is a pullback resistance level that lines up with the 61.8% Fibonacci retracement.
Stop loss: 1.3916
Why we like it:
There is a swing high resistance level.
Take profit: 1.3771
Why we like it:
There is a pullback support that aligns with the 78.6% Fibonacci retracement.
Enjoying your TradingView experience? Review us!
Please be advised that the information presented on TradingView is provided to Vantage (‘Vantage Global Limited’, ‘we’) by a third-party provider (‘Everest Fortune Group’). Please be reminded that you are solely responsible for the trading decisions on your account. There is a very high degree of risk involved in trading. Any information and/or content is intended entirely for research, educational and informational purposes only and does not constitute investment or consultation advice or investment strategy. The information is not tailored to the investment needs of any specific person and therefore does not involve a consideration of any of the investment objectives, financial situation or needs of any viewer that may receive it. Kindly also note that past performance is not a reliable indicator of future results. Actual results may differ materially from those anticipated in forward-looking or past performance statements. We assume no liability as to the accuracy or completeness of any of the information and/or content provided herein and the Company cannot be held responsible for any omission, mistake nor for any loss or damage including without limitation to any loss of profit which may arise from reliance on any information supplied by Everest Fortune Group.
USDCAD BUY!!Sold off aggressively targeting the previous days high , expecting price to continue on an upward trend

Bullish rise?The Loonie (USD/CAD) could fall to the pivot and bounce to the 1st resistance, which acts as a swing high resistance.
Pivot: 1.3828
1st Support: 1.3791
1st Resistance: 1.3918
Disclaimer:
The above opinions given constitute general market commentary, and do not constitute the opinion or advice of IC Markets or any form of personal or investment advice.
Any opinions, news, research, analyses, prices, other information, or links to third-party sites contained on this website are provided on an "as-is" basis, are intended only to be informative, is not an advice nor a recommendation, nor research, or a record of our trading prices, or an offer of, or solicitation for a transaction in any financial instrument and thus should not be treated as such. The information provided does not involve any specific investment objectives, financial situation and needs of any specific person who may receive it. Please be aware, that past performance is not a reliable indicator of future performance and/or results. Past Performance or Forward-looking scenarios based upon the reasonable beliefs of the third-party provider are not a guarantee of future performance. Actual results may differ materially from those anticipated in forward-looking or past performance statements. IC Markets makes no representation or warranty and assumes no liability as to the accuracy or completeness of the information provided, nor any loss arising from any investment based on a recommendation, forecast or any information supplied by any third-party.

USD/CAD - Forecast 13/9🕰 Weekly
Price has been holding inside a swing range with support around 1.36 – 1.37 and resistance higher near 1.46. Structure hints at a bigger bullish leg if buyers step in.
📅 Daily
Market is pressing against a descending trendline and sitting in a parallel channel. Demand is building around 1.37 – 1.38, while upside targets point toward 1.41 – 1.42 if broken.
⏱ 8H
Price recently swept liquidity below (BSL) and is now coiling under resistance. If we hold 1.37 support, the path opens for a push into 1.40 – 1.41.
🎯 Outlook
Bullish Case: Hold above 1.37 → breakout toward 1.40 – 1.42.
Bearish Case: Lose 1.37 → deeper correction back toward 1.35 demand.
⚖️ Bias : Short-term consolidation → mid-term bullish toward 1.40+.
Thanks traders and like and follow if you agree
