USDCAD Analysis – Market Recovery and Bullish OutlookUSDCAD Analysis – Market Recovery and Bullish Outlook
USDCAD Market Report
USDCAD is emerging from a completed downside leg into a constructive recovery cycle. The prior bearish momentum created imbalance, but recent order flow shows that liquidity has been absorbed, allowing buyers to regain control. The transition reflects a clean structural shift, where corrective pressure is evolving into directional expansion.
The sequence of price action highlights disciplined progression: accumulation at lower levels, controlled impulsive candles, and measured volatility. This behavior signals that the market is not in exhaustion but in the early stages of a potential bullish leg. The rotation from decline into expansion suggests renewed confidence from larger market participants.
Looking ahead, the pair remains positioned for continuation. The rhythm of correction followed by orderly advancement underlines a resilient structure, with market dynamics favoring sustained upside development in the medium term.
CADUSD trade ideas

USDCAD bullish idea1 Structure
*The price has previously made higher highs and higher lows, indicating a broader uptrend.
*The recent pullback could be a healthy correction before continuation.
Support Zone
*The price bounced near the 0.5 Fibonacci retracement level and a clear horizontal support zone (gray rectangle).
*This confluence of support strengthens the case for a bullish move.
⚠️ Caution
**While the setup is technically bullish, price is near a key decision point. If it breaks below the support, it invalidates the bullish thesis.
**Watch for confirmation candles (bullish engulfing, strong rejection wicks) before entry.
***Also, be mindful of the upcoming economic events (news icons are visible), which could cause volatility

USDCAD SELL SETUP OPPORTUNITY IF PULLBACKHello traders I wish you a great WEDNESDAY, Here's my point of view about CMCMARKETS:USDCAD
TECHNICALLY:
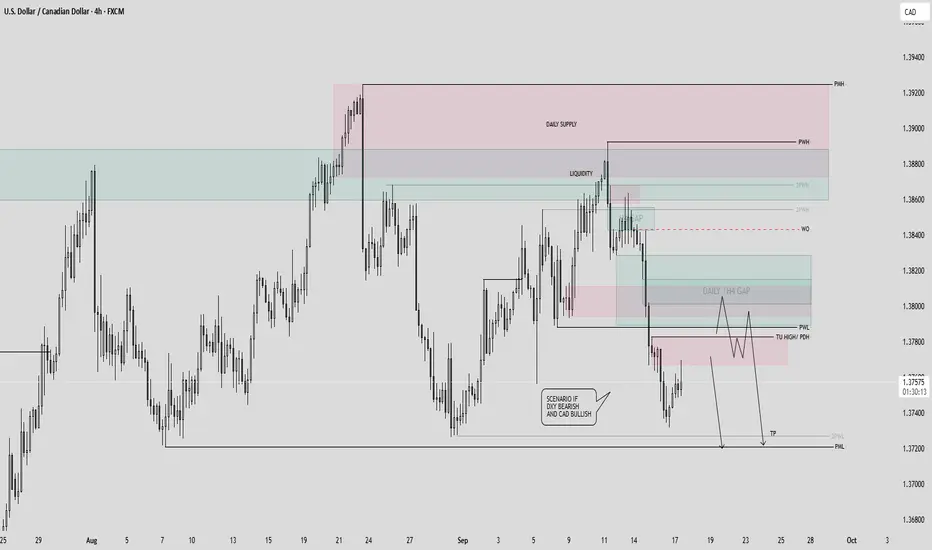
HIGHER TIME FRAMES such as DAILY WEEKLY show a liquidity grab before a bearish momentum near the 2-3 previous weekly highs around the 1.38800. This liquidity grab was released last week on Thursday- Friday. Then price re-integrated and gave us a valid sell setup that was aligned with our strategy to sell at the H4 GAP RETEST. Right now, price is very over extended and we are all waiting for pullbacks. Either way, we all have to wait for FOMC to be released today & CAD rates released. This will invalidate or confirm our setup. Next target is the previous monthly low at 1.37250. I am interested to sell close the 1.3800O OR ABOVE THE PREVIOUS DAILY HIGH.
FUNDAMENTALLY
All eyes on today's FOMC! a change in the US DOLLAR SENTIMENT can invalidate the setup! However, if we stick with the same tone, then US will likely continue bearish!
You may find more details in the chart!
Thank you and Good Luck! MAKE SURE TO STAY STRICT WITH YOUR RISK MANAGEMENT!
PS: Please support with a like or comment if you find this analysis useful for your trading day.
USDCAD Analysis: Bearish Reversal Signal ? 👋Hello everyone, it's great to see you again! Let’s take a look at OANDA:USDCAD !
Here’s my perspective:
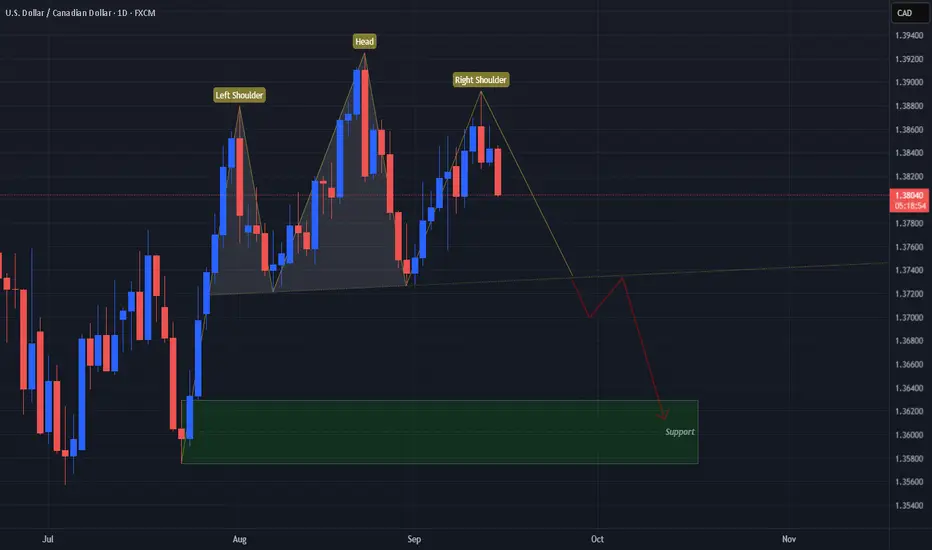
USDCAD has formed a Head and Shoulders pattern, signaling a potential bearish reversal. The price recently tested the 1.386 level and is now heading lower. The next target is approaching an important trendline support.
What do you think about this currency pair? Feel free to share your thoughts, and let’s discuss it!

UCAD Dropping Signs of Potentially Strong ReversalOANDA:USDCAD has followed suit with last week so far with starting this week off continuing the decline in price from the Sept. 11th High beginning to form what looks to be a "Right Shoulder" or Lower High then the previous.
This strong triple Reversal Pattern is the Head and Shoulders!
Now the Right Shoulder was created but still has yet to form completely which will happen once price revisits the "Neckline" or Support Line price has been bouncing from to create the 3 peaks.
Once Price has Confirmed the Pattern, this should deliver potential Short Opportunities as a Head and Shoulders Breakout and Retest Scenario!
*The next suspected area Price will travel to if the Pattern is confirmed will be the Last Support Zone Price visited before beginning the formation of the Pattern.
USDCAD – Medium-Term H1 OutlookUSDCAD – Medium-Term H1 Outlook
USDCAD is maintaining a steady corrective uptrend, supported by sustained strength in the US Dollar. This broader USD momentum continues to benefit the pair in the medium term.
The recently filled gap has led to a minor pullback, but this reaction creates an attractive opportunity for long positions at current levels. From a structural perspective, the Point of Control (POC) on the Volume Profile aligns well with a liquidity-driven retracement zone, reinforcing this as a favourable entry for trend-following trades.
Trading Plan (H1)
Buy Entry: 1.3760 – 1.3770
Stop Loss: 1.3730
Take Profit: 1.3795 – 1.3820 – 1.3850 – 1.3875
I will continue to monitor the market and share updates as price action unfolds. Wishing you successful trades with this scenario.


USD/CAD - Forecast🚨 USD/CAD – Key Levels in Play 🚨
🕰 Weekly View:
Price is trapped inside a 1.36 – 1.40 swing range.
Break above 1.40 → clean run into 1.44 – 1.46 supply.
Fail here → liquidity below 1.34 – 1.35 becomes the target.
📉 Daily Structure:
We’re moving inside a parallel channel, sitting mid-range at 1.38 – 1.39. Liquidity is building under 1.37 — sellers might want to grab that first.
⏱ 8H Play:
Rejection spotted at 1.38 – 1.385 supply.
➡️ Short-term pullback toward 1.37 demand looks likely.
➡️ If buyers defend that, we could see another push into 1.39 – 1.40.
📌 Outlook:
Short-term pullback 🔽 → Mid-term bullish if 1.37 holds.
Break under 1.37? Bears take control toward 1.35.
Follow for more

USD/CAD –Buy SetupEntry: 1.3772
Stop Loss (SL): 1.3730
Target Zones (TP):
TP1: 1.3815
TP2: 1.3849
TP3: 1.3873
🔹 Price broke out of consolidation and retested a minor support.
🔹 Strong bullish rejection candle confirming buyers stepping in.
🔹 EMA acting as dynamic support.
🟢 Bias: Short-term bullish towards 1.3850+ if structure holds.
⚠️ Note: Always manage risk, this is a short-term setup.

The importance of trendlines in FOREXIn the world of currencies or FOREX, there are certain entry points that only happen a few times a year , but they’re incredibly powerful . These opportunities come after a trend breaks, a trend that has been touched and confirmed as a support or resistance zone over several years.
Right now, with OANDA:USDCAD , we’re seeing a break and pullback to one of these long-term trends. That makes this a great moment to go short on this pair.
Let me share a couple of examples with USDBRL and USDMXN. In both cases, after similar long-term trends were broken, the price moved strongly in one direction, these are the kinds of moves that can really grow your account.
There are other pairs showing similar breakouts.
Have you spotted them? If not, leave a comment and I’ll share the other pairs with you!

4H USD/CAD Head + Shoulders PatternWaiting for potential break and retest of the 1.37200 level. If this happens, I’ll be watching USD/CAD on a lower timeframe in order a for a better entry. I’ll be placing my TP around the 1.3600 level and my SL around the 1.37400 level.

USDCAD OVERVIEWUSDCAD has bounced after testing the long-term trendline support. Price is now retesting the 1.3817 – 1.3795 resistance zone.
🔼 Bullish case: Break and hold above 1.3817 could trigger continuation towards 1.3860+.
🔽 Bearish case: Rejection at this resistance may pull price back into supports at 1.3768 and 1.3739.
📌 The trendline remains a key pivot – holding above keeps bias bullish, a break below flips momentum bearish.
⚠️ For educational purposes only, not financial advice

USD/CAD: Range-Bound with Recovery Attempt from Key SupportUSD/CAD continues to trade within a defined sideways channel, following a strong rejection near the 1.3925 resistance zone. The recent formation of a lower high has pushed price into the 1.3764–1.3693 support area, where buyers are attempting to hold the line.
A bounce from this demand zone could lead to a short-term recovery toward 1.3850, but the overall structure remains corrective. A clear break above the descending trendline would be needed to shift the momentum back in favor of the bulls and confirm a broader reversal.
Head & Shoulders Confirmed – USDCAD Bearish Move🎯 Target (TP):
Measure from head to neckline = ~200 pips.
First Target: 1.3680
Extended Target: 1.3600 (near rising trendline support)
---
🛑 Stop Loss (SL):
Place above right shoulder = 1.3830
---
📍 Support Levels:
1.3720 (minor support, just broken)
1.3680 (measured target)
1.3600 (major support / trendline)
📍 Resistance Levels:
1.3830 (right shoulder / SL zone)
1.3900 (strong resistance)
---
📝 Dialogue for Clients (Share Post):
"📉 USDCAD (4H) has formed a clear Head & Shoulders pattern. Price broke the neckline, indicating bearish momentum.
✅ Target: 1.3680 → 1.3600
⛔ Stop Loss: 1.3830
📍 Support: 1.3720 / 1.3680 / 1.3600
📍 Resistance: 1.3830 / 1.3900
Bearish setup in play, manage risk wisely. 🔑"

USD/CAD: Bearish Loonie SlideUSD/CAD: Bearish Loonie Slide Amid #Fed Cut Hype and #Forex Volatility Buzz? 1.39 Breakout Target in Sight?
USD/CAD is trading at 1.3795 today, up 0.17% amid a rebound from 1.3728 lows as markets eye the Fed's rate decision later, with 65% odds of a 50bps cut to 4.00-4.25% pressuring the dollar but offset by BoC's own easing signals.
This follows a 0.25% CAD gain earlier in the week on CPI data, but the pair remains range-bound with analysts forecasting a bearish tilt to 1.35 by year-end if Fed cuts deepen.
Just as #Fed surges with 15K mentions on X amid rate speculation, and #Forex trends spotlight policy divergence (e.g., BoC vs. Fed easing), USD/CAD's sensitivity to oil and CAD vulnerability position it for choppy action in the $1.8T daily forex market.
But with volatility at 3.88%, is USD/CAD undervalued for a bull run to 1.39, or will dovish Fed trigger a CAD rebound? Let's break down the fundamentals, SWOT, charts, and setups for September 18, 2025.
Fundamental Analysis
USD/CAD's trajectory hinges on diverging central bank paths, with the BoC's recent cuts weakening the loonie while Fed easing caps USD upside—yet oil prices above $70/bbl support CAD via Canada's export reliance.
Analysts project a 2025 average of 1.35, bearish on CAD amid #Fed cuts, but short-term resistance at 1.3800 could hold if US data softens. With #Forex volatility buzzing, the pair's undervaluation shines in a risk-on environment if Fed delivers 50bps, but sticky US inflation (2.6% core) risks a hawkish pivot.
- **Positive:**
- BoC easing and CAD vulnerability amid #Forex hype project USD strength to 1.3863 if Fed holds steady.
- Oil tailwinds and EM inflows (e.g., SA bonds) bolster CAD floors, undervaluing the pair at current levels vs. 1.40 peaks.
- Broader #Fed trends favor USD if dot plot signals fewer cuts, eyeing 0.5% monthly gains.
- **Negative:**
- Dovish Fed expectations weaken USD, clashing with #Fed optimism if 50bps cut confirms CAD rebound.
- Canada CPI resilience (2.0% YoY) could strengthen CAD if BoC pauses, pressuring the pair lower.
SWOT Analysis
**Strengths:** Policy divergence favors USD with Fed's relative hawkishness vs. BoC, amplified by #Fed relevance in dollar sentiment.
**Weaknesses:** High oil correlation exposes CAD upside; overbought momentum vulnerable in #Forex-shifting markets post-Fed.
**Opportunities:** Fed cut confirmation narrows spreads, with undervalued bull potential to 1.3891 amid #Fed boom.
**Threats:** Hawkish BoC surprises eroding gains; competition from AUD/CAD if commodity trends capitalize on #Forex volatility.
Technical Analysis
On the daily chart, USD/CAD rebounds in an ascending channel from 1.3728 support, with a pivot at 1.3800 mirroring #Fed volatility spikes. The weekly shows neutral bias with 1.3889 as key breakout. Current price: 1.3795, with VWAP at 1.3770 as intraday balance.
Key indicators:
- **RSI (14-day):** At 55, neutral—potential bull signal amid #Fed surge. 📈
- **MACD:** Histogram positive, crossover holding for upside.
- **Moving Averages:** Price above 21-day EMA (1.3750) but testing 50-day SMA (1.3820)—bullish if holds.
Support/Resistance: Support at 1.3728 (recent low), resistance at 1.3863 and 1.3891. Patterns/Momentum: Channel bounce targets 1.3863; fueled by #Forex momentum. 🟢 Bullish signals: Higher lows on volume. 🔴 Bearish risks: Failure at 1.3800 eyes 1.36.
Scenarios and Risk Management
- **Bullish Scenario:** Break above 1.3863 on hawkish Fed targets 1.3891; long on pullbacks to 1.3728, especially if #Fed signals fewer cuts.
- **Bearish Scenario:** Drop below 1.3728 eyes 1.3538; watch for CAD cross amid #Forex fade on dovish pivot.
- **Neutral/Goldilocks:** Range-bound 1.3728–1.3863 if dot plot mixed and #Fed cools.
Risk Tips: Use stops at 1.3700. Risk 1-2% per trade. Diversify to avoid correlation traps with #Fed-linked pairs like EUR/USD.
Conclusion/Outlook
Overall, a bullish bias if USD/CAD holds 1.3728, supercharged by today's #Fed and #Forex trends, with 0.7% upside to 1.39 on policy divergence. But watch the Fed outcome for confirmation—this fits September's rate volatility theme amid easing hype.
What’s your take? Bullish on USD/CAD amid #Fed cuts or fading the loonie? Share in the comments!

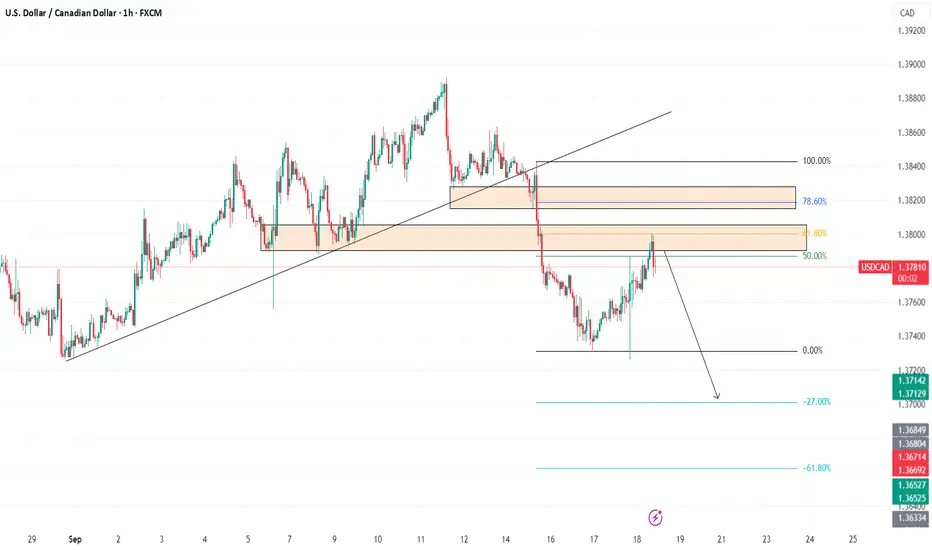
UsdCadafter a big breakout we see a good retracement till to our fibo zone 61.8 or 78.60 but we might see it during hours or day and till to see a good bearish candle from our sell point...
lets see
USDCAD Trade IdeaBias: Bullish (continuation of uptrend).
Current Context:
Price has not broken the previous low, keeping the bullish structure intact.
Currently retracing to fill the imbalance / unmitigated order block (OB).
Key Observations:
As long as price respects the order block area, the uptrend bias remains valid.
This zone should act as a potential demand area for continuation to the upside.
Trade Scenarios:
Long Opportunity:
Wait for reversal confirmations (CHoCH, bullish BOS, liquidity sweep, or strong rejection wicks) inside the OB/demand zone.
Entry from OB → targeting previous highs / next liquidity pool.
Invalidation:
If price breaks and closes below the identified low/OB, bullish bias is invalidated → wait for new structure to form.

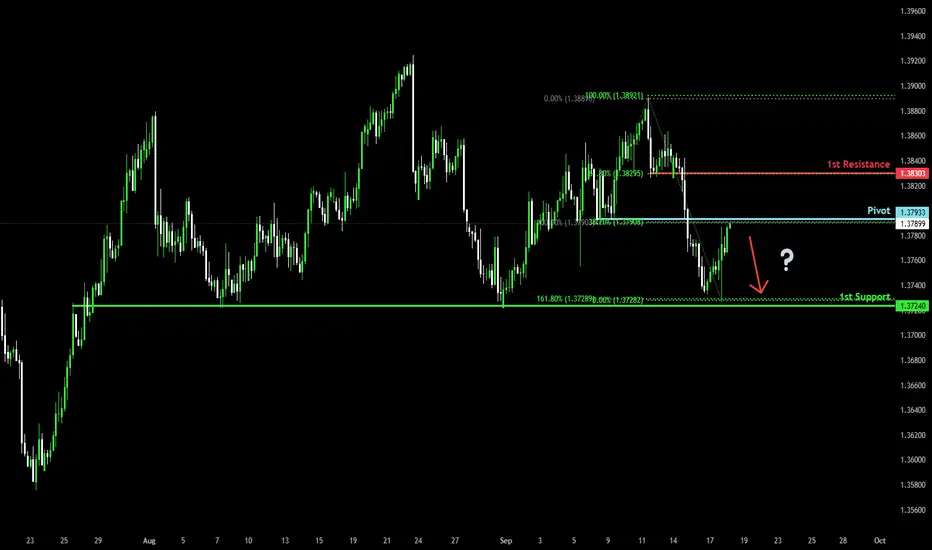
Could the Loonie reverse from here?The price is rising towards the pivot which acts as a pullback resistance that aligns with the 38.2% Fibonacci retracement and could reverse to the 1st support.
Pivot: 1.3793
1st Support: 1.3724
1st Resistance: 1.3830
Disclaimer:
The above opinions given constitute general market commentary, and do not constitute the opinion or advice of IC Markets or any form of personal or investment advice.
Any opinions, news, research, analyses, prices, other information, or links to third-party sites contained on this website are provided on an "as-is" basis, are intended only to be informative, is not an advice nor a recommendation, nor research, or a record of our trading prices, or an offer of, or solicitation for a transaction in any financial instrument and thus should not be treated as such. The information provided does not involve any specific investment objectives, financial situation and needs of any specific person who may receive it. Please be aware, that past performance is not a reliable indicator of future performance and/or results. Past Performance or Forward-looking scenarios based upon the reasonable beliefs of the third-party provider are not a guarantee of future performance. Actual results may differ materially from those anticipated in forward-looking or past performance statements. IC Markets makes no representation or warranty and assumes no liability as to the accuracy or completeness of the information provided, nor any loss arising from any investment based on a recommendation, forecast or any information supplied by any third-party.
USDCAD 1H longCurrently I'm in this trade 2 buy orders long,
2 limit buy orders still open
Price is still at a good place to step in imo.
Tomorrow high impact news for the CAD and USD so I expect some fireworks!
The plan is simple as always:
The price is already extended, clean drop down.
Support level visible on the 4H
No big pullbacks happend yet or consollidation zones
RSI oversold
- So I buy on the way down every 20 pips a limit buy order
- I exit when I make 2R profit
Let's goo
btw... EURUSD and USDCHF are aslo looking juicy

Bank of Canada lowers rates, Canadian dollar edges upwardsThe Canadian dollar has posted small gains on Wednesday. In the North American session, USD/CAD is trading at 1.3762, up 0.17% on the day.
There were no surprises from the Bank of Canada, which lowered its policy rate by a quarter-point to 2.5%, its lowest level since July 2022. This was the first time the Bank of Canada lowered rates since March, as it was forced to respond to signs of weakness in the economy and lower inflation.
The rate statement said that a rate cut was justified, given that the economy had weakened and there was less upside risk to inflation. The US tariffs were expected to have a further dampening effect on economic activity.
The statement made three references to the uncertainty of the economic outlook, which has required the BoC to act cautiously. At a follow-up press conference, Governor Macklem defended the rate cut due to a weaker labor market and less upside pressure on underlying inflation.
What was missing from the rate statement and press conference was any forward guidance about future rate cuts, as the central bank doesn't want to be pushed into any corners with regard to future decisions. If inflation risks continue to fade, the BoC could deliver one or even two rate cuts before the end of the year.
The Federal Reserve is virtually certain to lower rates at today's meeting, barring a monumental surprise. The expected rate cut would be the Fed's first since December 2024. With the rate decision virtually a given, investors will be looking for some clues as to whether the Fed is looking at further rates cuts before the end of the year.
USD/CAD is testing resistance at 1.3752. Above, there is resistance at 1.3770
There is support at 1.3721 and 1.3703

USD/CAD, GBP/CAD, EUR/CAD: Canadian Dollar Bulls Regain FootingPrice action on several Canadian dollar charts suggests that we've entered a phase of strength from the bull camp. With Canadian CPI and a Bank of Canada meeting on tap, there is plenty of opportunity for volatility. Today I outline my bias for USD/CAD, GBP/CAD and EUR/CAD.
Matt Simpson, Market Analyst at City Index and Forex.com (part of StoneX)

On weekly Consolidation. Looking Swing LongOn weekly Consolidation. Price should manipulate Equal Lows. There is a two type of TPs i see.
Type 1 - On Liquidity Voids / in weekly and Daily Time Frames /
Type 2 - On weekly Bearish OB

Double Blow for the USD/CAD MarketDouble Blow for the USD/CAD Market
Today, the USD/CAD market faces a “double blow” from central banks:
→ At 16:45 GMT+3, the Bank of Canada will announce its decision. The rate is expected to be cut from 2.75% to 2.50%.
→ At 21:00 GMT+3, the Federal Reserve will follow with its own rate announcement.
Both events will be accompanied by statements from the central bank chairmen on future outlooks, and the USD/CAD market is likely to experience heightened volatility today.
Technical Analysis of the USD/CAD Chart
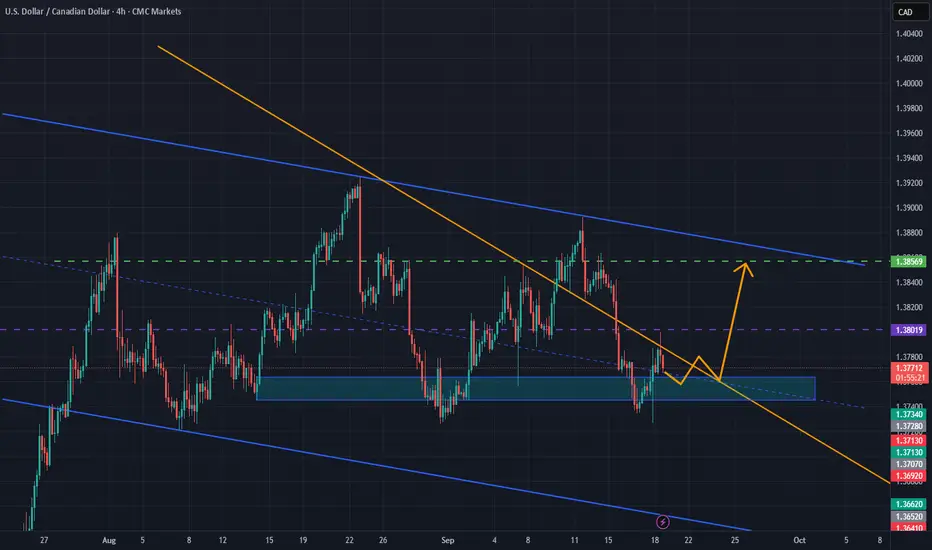
When analysing the USD/CAD chart earlier this month, we noted the formation of a symmetrical narrowing triangle (a sign of balance between supply and demand), bounded by:
→ a long-term descending channel (red), which has been in place since early February;
→ a short-term channel (blue), shaped by price fluctuations since mid-summer.
At that time, we suggested that supply and demand forces would keep USD/CAD in a temporary state of equilibrium until today.
Since then:
→ the price has reversed sharply from the upper boundary of the triangle (marked with an arrow);
→ on the eve of key announcements, the pair is attempting to consolidate below the lower boundary, signalling bearish pressure (in other words, a shift in balance in favour of supply).
Key observations:
→ the aggressive nature of the September support breakout (S);
→ the decline towards the critical 1.3725 level, which has acted as support since August.
Given the above, we could assume that the market is leaning bearish. Today’s announcements could trigger a downward impulse in USD/CAD – in this context, the chart may be interpreted through:
→ a potential breakout of the bearish flag pattern (formed by the blue channel);
→ prospects for the resumption of the broader downtrend within the red channel.
This article represents the opinion of the Companies operating under the FXOpen brand only. It is not to be construed as an offer, solicitation, or recommendation with respect to products and services provided by the Companies operating under the FXOpen brand, nor is it to be considered financial advice.
