CADUSD trade ideas

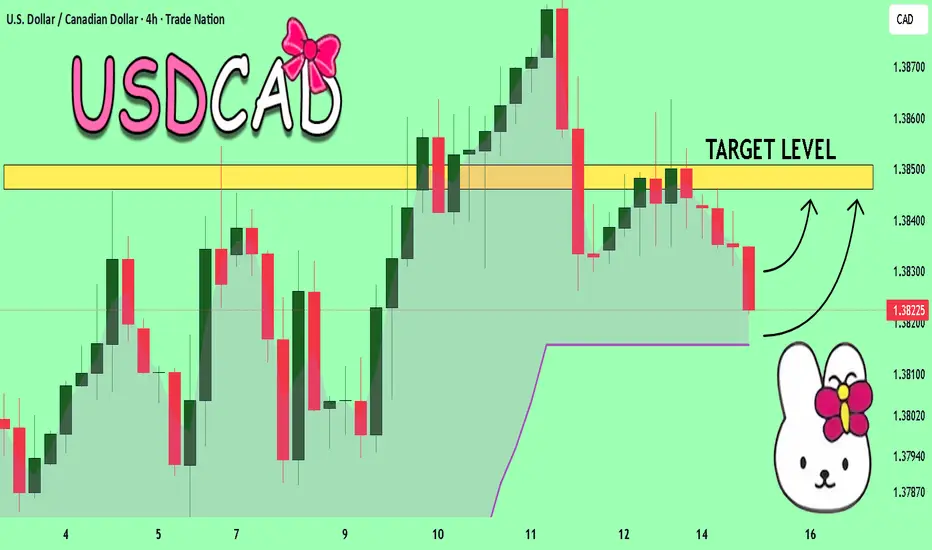
USD-CAD Support Ahead! Buy!
Hello,Traders!
USD-CAD keeps falling
Down but a wide horizontal
Support area is ahead
Around 1.3728 so after
The retest a local bullish
Correction is to be
Expected
Buy!
Comment and subscribe to help us grow!
Check out other forecasts below too!
Disclosure: I am part of Trade Nation's Influencer program and receive a monthly fee for using their TradingView charts in my analysis.


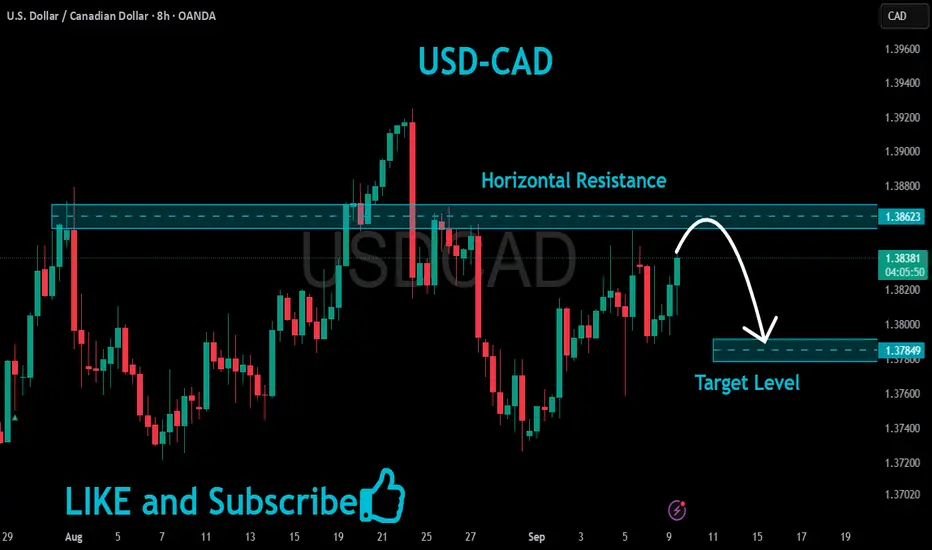
USDCAD Resistance Ahead!
HI,Traders !
#USDCAD is trading in an
Uptrend but the pair is locally
Overbought so after the pair
Hits the horizontal resistance
Level of 1.38623 we will be
Expecting a local bearish
Move down !
Comment and subscribe to help us grow !
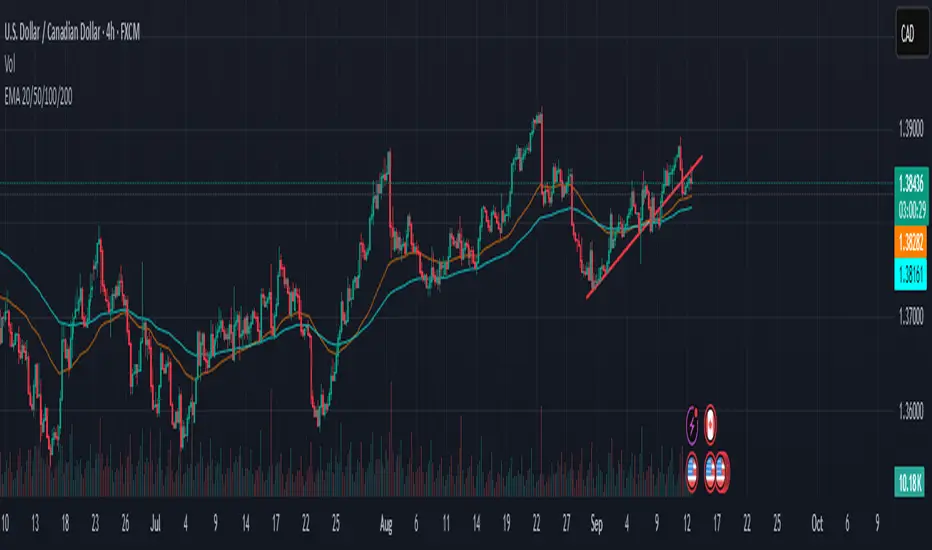
PERFECT USDCAD SHORT ENTRYI have a weekly short bias on FX:USDCAD , we can see a previous strong rejection of the weekly 50ema, and currently price is rejecting the level again. Moving into next week this gives a bearish bias.
Now moving down to the daily timeframe there looks to be a clear head and shoulders structure forming, with the previous days candle showing a bearish engulfing bar from a liquidity zone, I am bearish, and looking for a lower timeframe entry.
Now on the lower 1h timeframe I am seeing a bos to the downside with a double pin rejection of ema.
#
This break of trend, with all timeframes aligned, gives a perfect short setup imo.
Give a follow for more:)
USDCAD – Bearish Channel Break📉 USDCAD – Bearish Channel Break
USDCAD has been moving inside a rising channel, but price has now closed below the lower boundary, suggesting potential bearish pressure.
🔎 Technical View
Rising channel structure respected since late August.
Current break below support could open the way toward 1.3780 – 1.3700.
Invalidated if price reclaims 1.3860 and sustains above.
📌 Key Levels
Resistance: 1.3860
Support: 1.3780 / 1.3750 / 1.3700
This setup highlights a shift in momentum worth keeping an eye on.
👍 If this analysis helps you:
Hit LIKE ❤️
Share your thoughts in the comments 💬
Follow for more clean technical breakdowns 📊
#USDCAD #Forex #TechnicalAnalysis #ChartPattern

USDCAD: Bull Trap & Confirmed Bearish MovementThe USDCAD appears to be bearish following a false violation of a significant daily resistance level.
The formation of a cup and handle pattern, coupled with a bearish imbalance after the neckline violation, suggests a strong bearish signal.
I anticipate a downward movement, potentially reaching 1.3797.

USDCAD The Target Is UP! BUY!
My dear subscribers,
This is my opinion on the USDCAD next move:
The instrument tests an important psychological level 1.3824
Bias - Bullish
Technical Indicators: Supper Trend gives a precise Bullish signal, while Pivot Point HL predicts price changes and potential reversals in the market.
Target - 1.3846
About Used Indicators:
On the subsequent day, trading above the pivot point is thought to indicate ongoing bullish sentiment, while trading below the pivot point indicates bearish sentiment.
Disclosure: I am part of Trade Nation's Influencer program and receive a monthly fee for using their TradingView charts in my analysis.
———————————
WISH YOU ALL LUCK

USDCAD Head & Shoulders forming.Price got rejected at the left shoulder at (1.38927 - 1.38758) and triggered a sell off followed by tight consolidation with rising trendline. Wait for price to break the rising trendline for Sell Entries to the Neckline at (1.37554 - 1.37221).

USDCAD 1H BearishBreak of trendline
Bearish engulfing candles
Liquidity sweep Aug 22, new high
RSI = 44
Bearish Divergence on RSI
R/R 3:1
Multiple confluences
Beware buyers around 1.39000

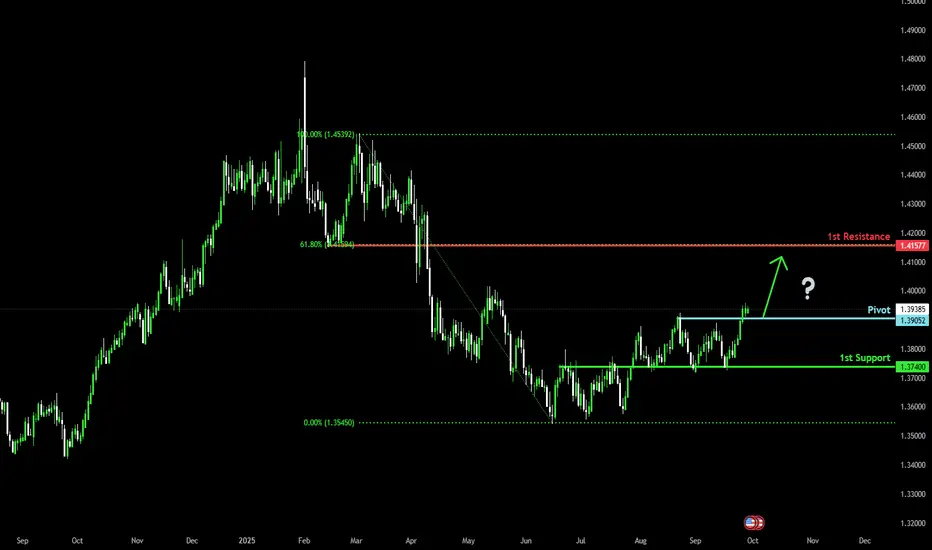
Bullish momentum to extend?The Loonie (USD/CAD) is reacting off the pivot which is a pullback support and could rise to the 1st resistance which aligns with the 61.8% Fibonacci retracement.
Pivot: 1.3905
1st Support: 1.3740
1st Resistance: 1.4157
Disclaimer:
The above opinions given constitute general market commentary, and do not constitute the opinion or advice of IC Markets or any form of personal or investment advice.
Any opinions, news, research, analyses, prices, other information, or links to third-party sites contained on this website are provided on an "as-is" basis, are intended only to be informative, is not an advice nor a recommendation, nor research, or a record of our trading prices, or an offer of, or solicitation for a transaction in any financial instrument and thus should not be treated as such. The information provided does not involve any specific investment objectives, financial situation and needs of any specific person who may receive it. Please be aware, that past performance is not a reliable indicator of future performance and/or results. Past Performance or Forward-looking scenarios based upon the reasonable beliefs of the third-party provider are not a guarantee of future performance. Actual results may differ materially from those anticipated in forward-looking or past performance statements. IC Markets makes no representation or warranty and assumes no liability as to the accuracy or completeness of the information provided, nor any loss arising from any investment based on a recommendation, forecast or any information supplied by any third-party.
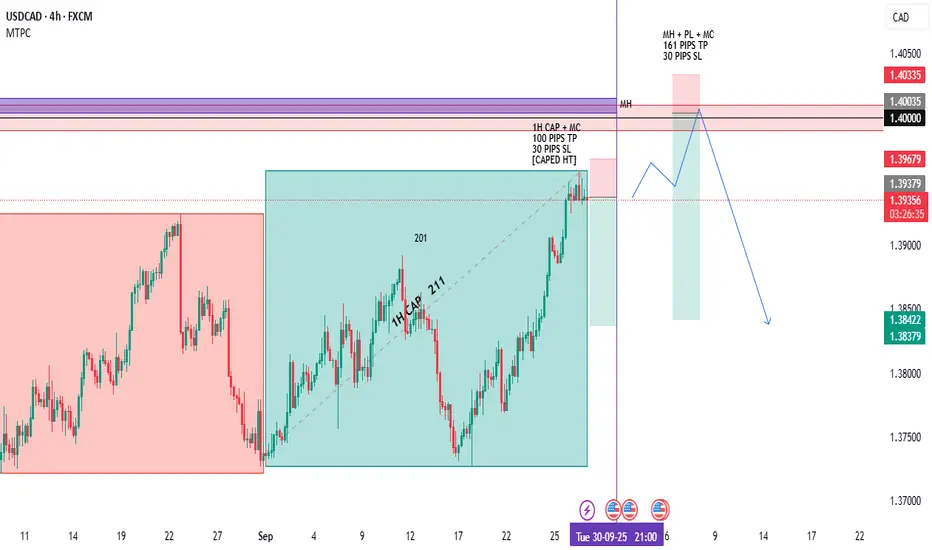
SWING SHORTING OPPORTUNITYLast week market have been trending continuously without making any significant pullback, also the market have already moved 1H CAP avg movement, preparing for a pull back , last candles also shows signs of bullish exhaustion. but there are also chances market can move towards 1.4 PL upto the previous MH before making the Pullback Swing.
USD/ CAD) Bullish Analysis Read The captionSMC Trading point update
Technical analysis of USD/CAD (1H timeframe) chart analysis:
---
Bullish USD/CAD Setup
Support Zone: Price is respecting the support level (yellow box around 1.3920 – 1.3930).
Moving Averages:
50 EMA (red) is below current price, providing short-term bullish support.
200 EMA (blue) is also trending upward, confirming overall bullish bias.
Market Structure: Higher highs and higher lows suggest continuation to the upside.
Projection: Price is expected to bounce from the support zone and push toward the next resistance/target.
---
Target Point
1.3998 (near 1.4000 psychological level).
This aligns with the measured move projection from the last impulsive rally.
Mr SMC Trading point
---
Trading Idea
Bias: Bullish.
Entry Zone: Around 1.3920 – 1.3930 (support level retest).
Target: 1.3998.
Invalidation: A sustained break below 1.3900 would invalidate the bullish scenario.
---
Please support boost 🚀 this analysis

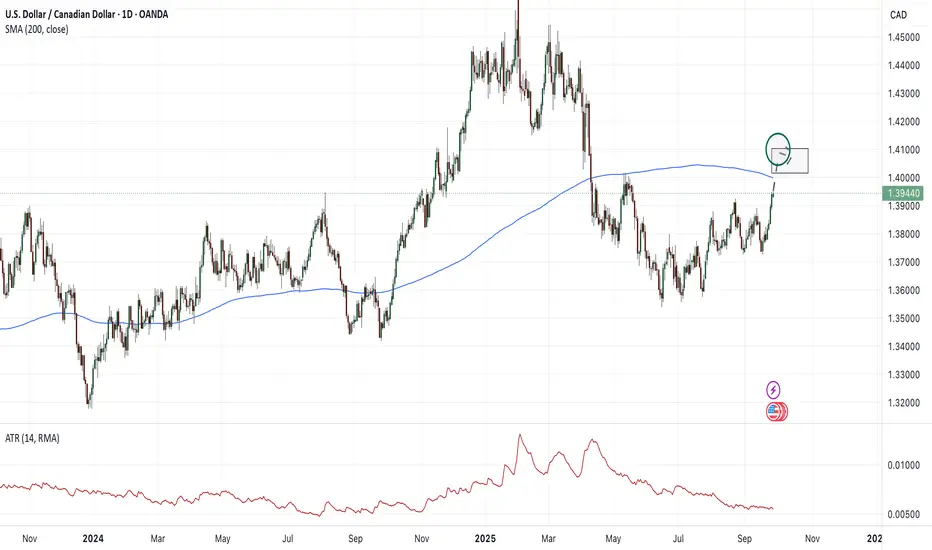
Canadian dollar under pressureThe Canadian dollar is weakening against the greenback in a week of a bearish rally, as the US dollar gains strength in anticipation of the most volatile month around the corner, and weakening “Dovish FED” narrative. The technical picture is particularly interesting here, as it finished the week near the 200-day moving average: the long-term reference, which might become a trigger for more selling pressure for CAD against the USD.
Given the strong momentum of USDCAD, we can expect it to expand this week reaching the target of 1.4050, and potentially higher.
Don't forget - this is just the idea, always do your own research and never forget to manage your risk!
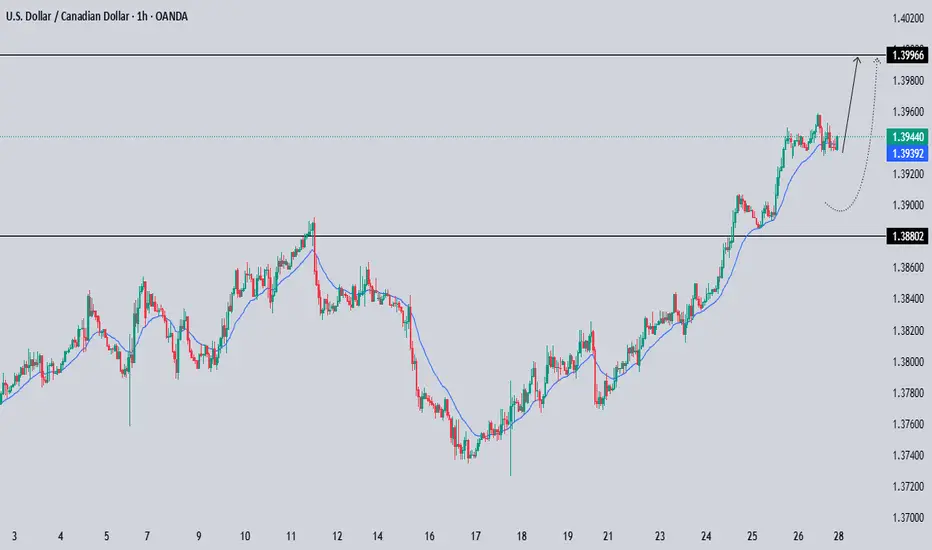
Usdcad sell on a pullback,I like the fact that the usd has stretched up a d broke a structure area which means for me there will be a possible pullback here from 1.39400 to 1.38400 areas.

USDCAD Technical & Order Flow AnalysisOur analysis is based on a multi-timeframe top-down approach and fundamental analysis.
Based on our assessment, the price is expected to return to the monthly level.
DISCLAIMER: This analysis may change at any time without notice and is solely intended to assist traders in making independent investment decisions. Please note that this is a prediction, and I have no obligation to act on it, nor should you.
Please support our analysis with a boost or comment!
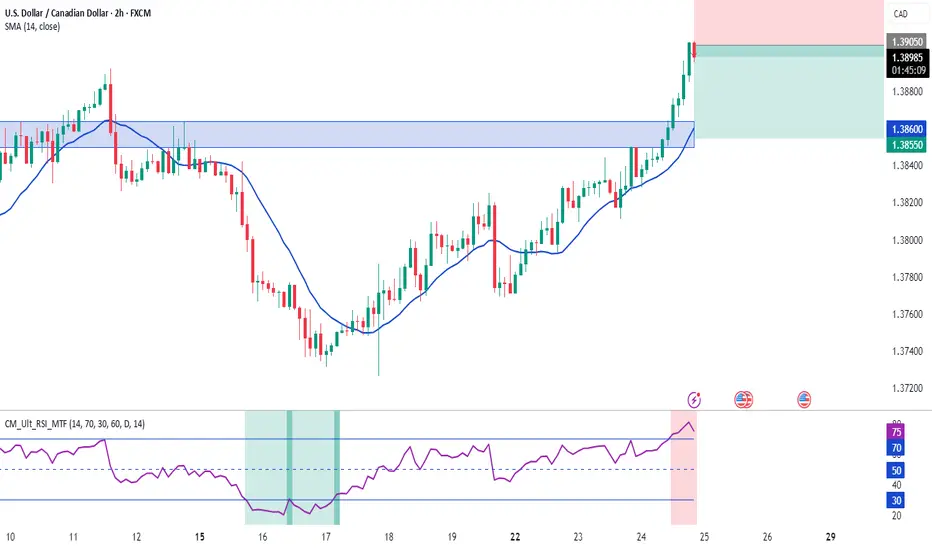
USDCAD LongWe are in an uptrend we are waiting for the retest of the fair value gap that is in line with a key area on the Fibonacci level.


Sell⬇️ Sell Entry: 1.39050
⏹️ Stop Loss: 1.39400
*️⃣ Take Profit: 1.38550
🔠 Downward corrective movement to the nearest local support level.
USDCAD - Parabolic ExhaustionPossibility of reversal/s back to test support.
Await confirmation of closes below the trend-lines.

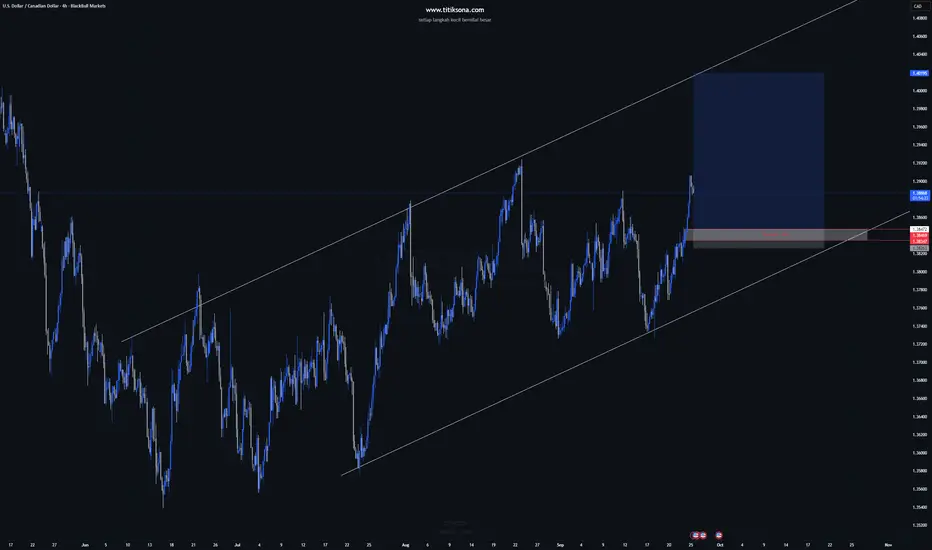
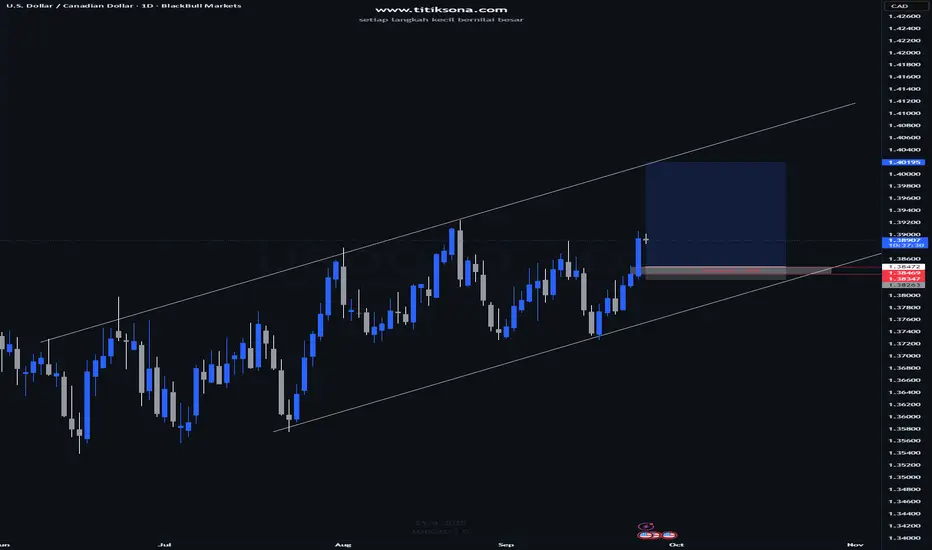
USDCAD H4 – Buy Setup on Support Channel with Attractive RR USDCAD — H4 Timeframe
Titik Sona Community — 25 Sep 2025
Entry
1.38472
Stop Loss
1.38263
Take Profit
1.40195
Risk / Reward
~1 : 8.2
Validation Zone: H4 trendline support (around 1.3830–1.3850)
Reference chart: view charts on TradingView
Trading Ideas
Setup buy near the H4 support trendline with entry at 1.38472. The final target is at 1.40195. Stop loss at 1.38263 to limit the risk.
Technical Reasons
The price is in the support channel up H4.
The higher low structure is maintained.
Risk reward is very attractive (±1:8).
Confirmation of a bullish candle is required before a valid entry.
Entry & Position Management
Entry Strategy:
Entry buy around 1.3847 after the confirmation of the bullish candle.
The stop loss was placed below the trendline (1.3826).
The profit target is in the upper resistance channel (1.4019).
Position Management:
Optional TP scaling in minor resistance areas.
Once the price moves +40–50 pips, shift the SL to Break Even (BE).
Invalidation & Alternative Scenarios
Invalidation: if the H4 close is below 1.3820, the buy setup is canceled.
Bearish alternative: if the channel breakdown, the next target is 1.3750–1.3720.
Pre-Entry Checklist
Wait for the bullish confirmation candle.
Check high impact news (USD/CAD, Oil).
The maximum risk is 1–2% of the account.
Analyst: Titik Sona Community — 25 Sep 2025
USDCAD H4 – Buy Setup on Support Channel with Attractive RRUSDCAD — H4 Timeframe
Titik Sona Community — 25 Sep 2025
Entry
1.38472
Stop Loss
1.38263
Take Profit
1.40195
Risk / Reward
~1 : 8.2
Validation Zone: H4 trendline support (around 1.3830–1.3850)
Reference chart: view charts on TradingView
Trading Ideas
Setup buy near the H4 support trendline with entry at 1.38472. The final target is at 1.40195. Stop loss at 1.38263 to limit the risk.
Technical Reasons
The price is in the support channel up H4.
The higher low structure is maintained.
Risk reward is very attractive (±1:8).
Confirmation of a bullish candle is required before a valid entry.
Entry & Position Management
Entry Strategy:
Entry buy around 1.3847 after the confirmation of the bullish candle.
The stop loss was placed below the trendline (1.3826).
The profit target is in the upper resistance channel (1.4019).
Position Management:
Optional TP scaling in minor resistance areas.
Once the price moves +40–50 pips, shift the SL to Break Even (BE).
Invalidation & Alternative Scenarios
Invalidation: if the H4 close is below 1.3820, the buy setup is canceled.
Bearish alternative: if the channel breakdown, the next target is 1.3750–1.3720.
Pre-Entry Checklist
Wait for the bullish confirmation candle.
Check high impact news (USD/CAD, Oil).
The maximum risk is 1–2% of the account.