USDCAD; A Bearish Confirmation Or Breakout ?The chat is plainly showing us how USDCAD have been moving within the area of support and resistance. which we are expecting a short opportunity at the moment.
Although there may be a breakout above the resistance in regard to double bottom chat pattern been displayed.
Possible Outline:
A confirmed reversal below the resistance zone would trigger a movement down to next support.
Like and follow up
Thanks for your time.
CADUSD trade ideas

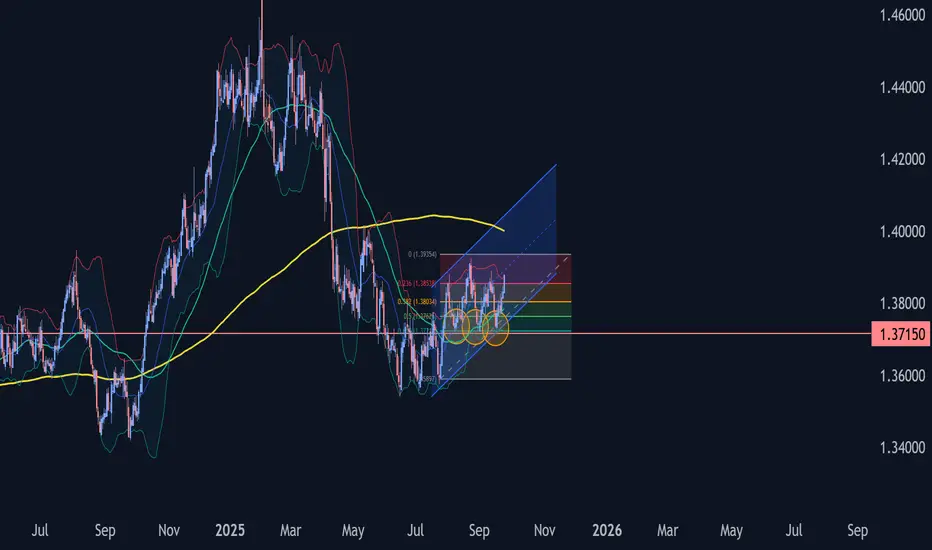
USDCAD Wave Analysis – 24 September 2025- USDCAD reversed from support area
- Likely to rise to resistance level 1.3900l
USDCAD currency pair recently reversed from the support area between the pivotal support level 1.3715 (which has been reversing the price from the start of August) and the lower daily Bollinger Band.
This support area was further strengthened by the support trendline of the daily up channel from July and by the 61.8% Fibonacci correction of the upward impulse from July.
USDCAD currency pair can be expected to rise further in the active impulse wave 3 toward the next resistance level 1.3900.
USD/CAD: Climbing Within Channel But Facing Overhead ResistanceUSD/CAD has rebounded sharply from a double bottom near 1.3700 and is now moving within an upward channel. The current structure features lower highs, limited by a descending red resistance trendline, while buyers aim to push toward the 1.3868–1.3924 resistance zone.
If the price fails to break and hold above 1.3868, a rejection could trigger a move back toward the 1.3800 support level. In the broader context, this advance appears to be a corrective upswing within a larger resistance area, where sellers remain active and could reassert control.

USDCAD — Timeframe H4Trading Ideas
There are two setups: a short-term counter-trend BUY order in the 1.3765–1.3775 demand zone, and a trend-following SELL order in the 1.3880–1.3890 supply zone. The strategy requires waiting for candlestick confirmation before entering.
Buy Setup (Counter-Trend)
Entry: 1.37686
Stop-Loss: 1.37468
Final Target: 1.38852
Risk/Reward: ± 1:4.9
Price is in the H4 demand zone, with potential for an upward correction before reaching the supply zone.
SELL Setup (Following the Trend)
Entry: 1.38851
Stop-Loss: 1.38951
Final Target: 1.37866
Risk/Reward: ± 1:9.8
Supply area + trendline resistance, in line with the main bearish trend, strong rejection potential.
Technical Reasoning
The large structure remains within the downtrend channel.
BUY is only a short-term correction from the demand zone.
SELL is stronger because it aligns with the main trend and is near resistance.
The combination of the supply zone and trendline increases the potential for rejection.
Pre-Entry Checklist
Wait for price action confirmation (rejection candle/engulfing candle).
Ensure high-impact news (USD/CAD, Oil, USD) does not conflict with the entry.
Use a maximum risk of 1–2% of the account.
Choose one direction based on confirmation; do not take two directions simultaneously.
USDCADFX:USDCAD
Technical Analysis: sentiment to the upward trend
The trend structure on the four-hour chart is bullish.
Given the change in structure, we should wait for confirmation of the bullish trend within the demand range of 1.3798, probably in the short term, if the aforementioned support is confirmed
we will witness an upward trend towards higher targets.
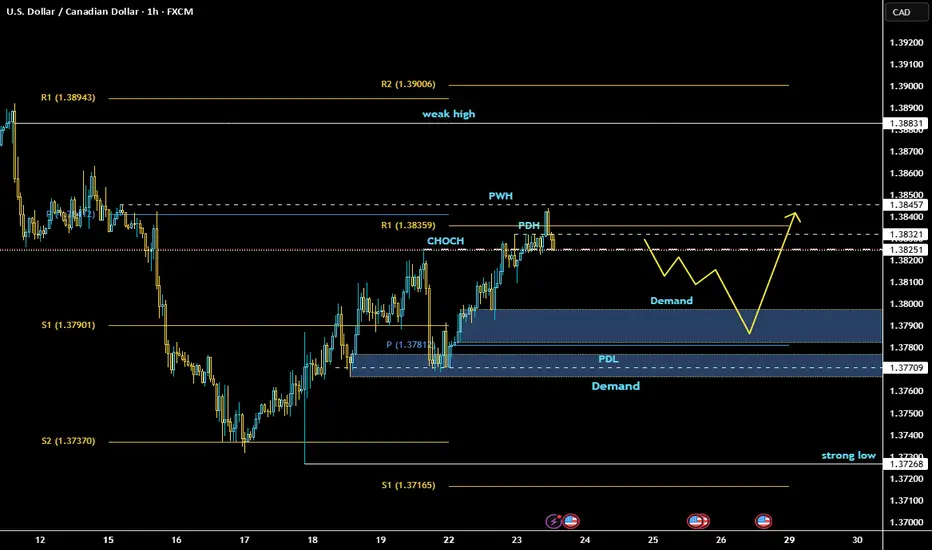
USDCAD(20250923)Today's AnalysisMarket News:
Federal Reserve Chairman Bostic: There is currently little reason to cut interest rates further, and only one rate cut is expected this year. Musallem: There is limited room for further rate cuts. If inflation risks increase, further rate cuts will not be supported. Hammak: We should be very cautious when lifting policy restrictions. My estimate of the neutral interest rate is on the higher side. Milan: I believe the appropriate interest rate is in the mid-2% range. I do not support adjusting the 2% inflation target at this time.
Technical Analysis:
Today's Buy/Sell Levels:
1.3806
Support and Resistance Levels:
1.3866
1.3844
1.3829
1.3783
1.3768
1.3746
Trading Strategy:
If the price breaks above 1.3829, consider buying, with the first target at 1.3844.
If the price breaks below 1.3806, consider selling, with the first target at 1.3783

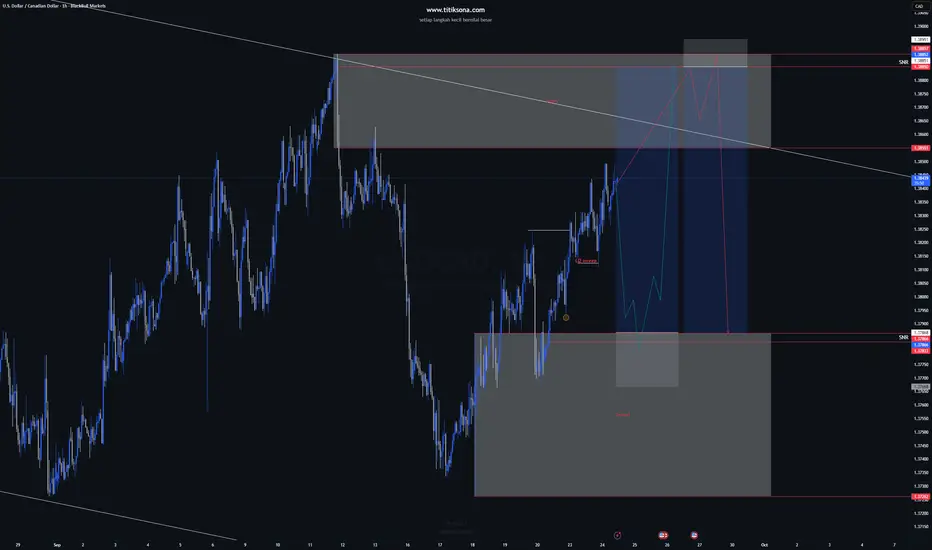
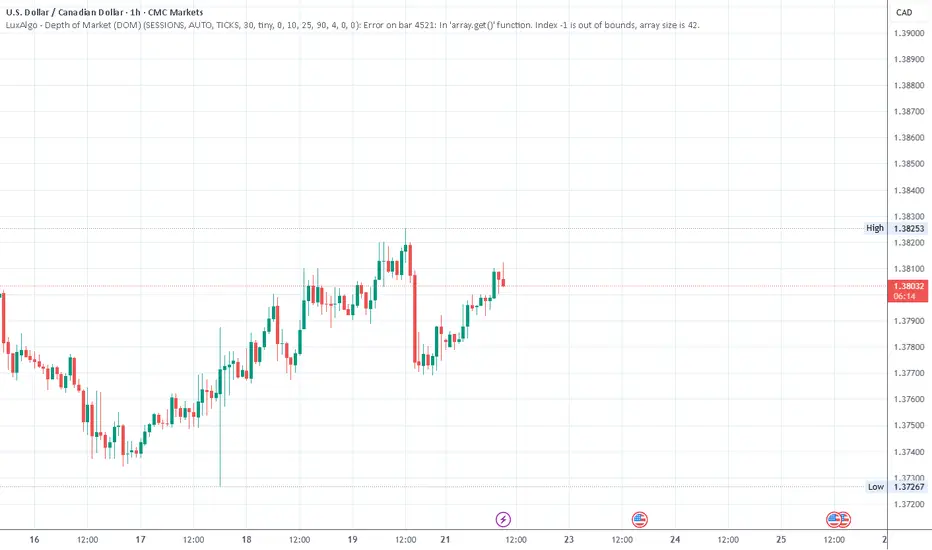
#USDCAD short stops 1.3815 tp 1.3752looking from the left there was a trap set for the buyers on the 60 minutes chart where it clearly shows now after the pullback back to the area buyers may have released because a trap on the 5 minutes has also been identified with some volumes
possibility of uptrend It is expected that a triangle pattern will form and then we will see the start of the upward trend. With the support trend line broken, the continuation of the downward trend is likely.

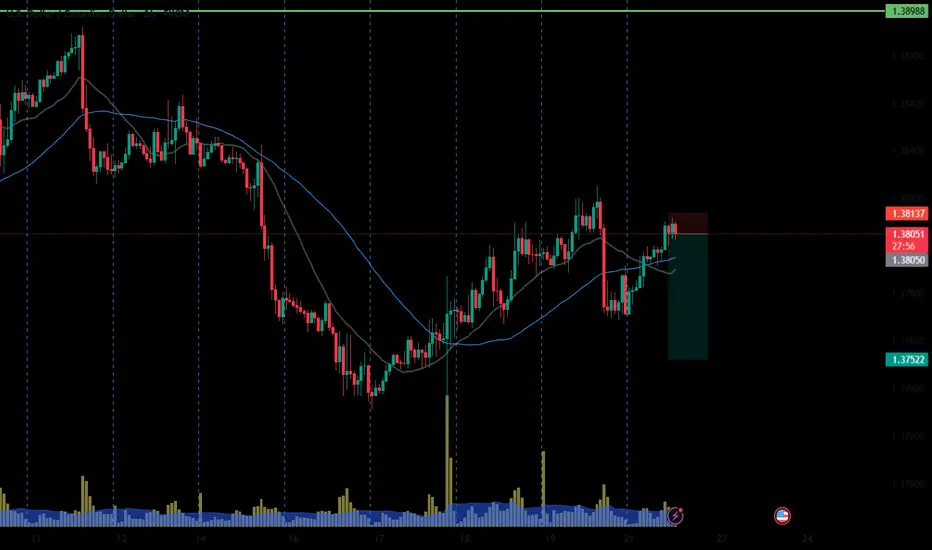
Long trade
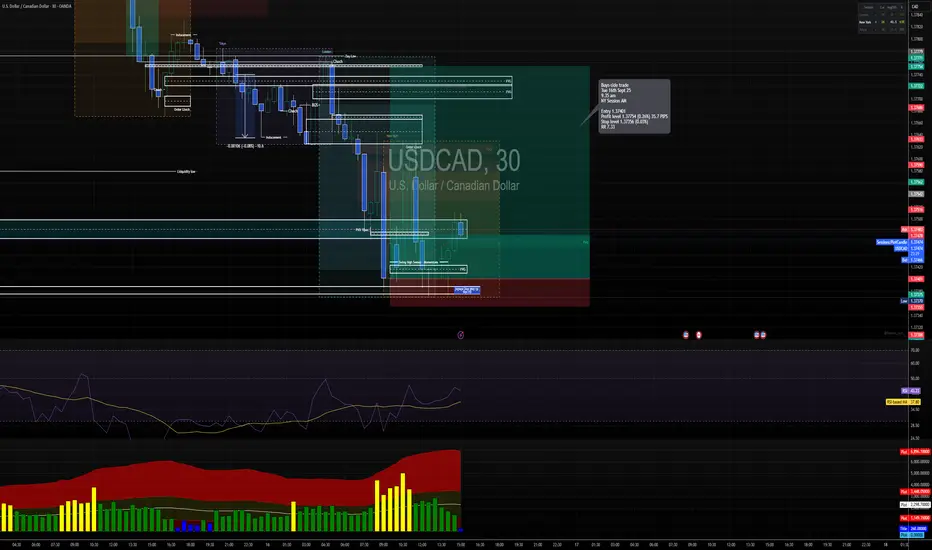
Trade 2
Type: Buyside trade 2
Date: Thurs 18th Sept 25
Session: NY Session AM
Entry: 1.34973
Profit level: 1.35273 (+0.20%) → 26.1 pips
Stop level: 1.34947 (-0.05%) → 2.6 pips
RR: 2.1
Narrative:
Following the earlier stop-out, a second entry was executed after confirmation of bullish structure. The market engineered liquidity below intra-day lows before running back into a bullish order block aligned with the 15m FVG. Entry was timed to coincide with the NY AM open drive

Buy USD/CAD at low of sideways rangeUSD/CAD has been trading sideways so a straight forward trade, buy at low / profit at high until something changes.
Buy Limit : 1.3756 bottom of range
Stop : 1.3699 under bottom of range
Profit : 1.3870 top of range
Risk 1 : 2 stop is 57 pips

Long Trade
30min TF overview
Pair: USDCAD
Direction: Buyside Trade
Date: Tuesday, 16th September 2025
Time: 9:35 AM
Session: New York Session AM
Entry Timeframe: 30m TF
Trade Parameters
Entry: 1.37407
Profit Level: 1.37764 (+0.26%) ≈ 35.7 pips
Stop Level: 1.37348 (–0.01%)
Risk-to-Reward (RR): 7.35
Narrative & Rationale
Buyside entry taken after liquidity sweep and confirmation of bullish order flow shift (CHOCH). Entry located within the discount zone, aligned with OB and FVG support areas.
Tight stop placement beneath accumulation lows reflects a precision entry model.
Targeting continuation into NY session highs and imbalance fill (FVG above).
RSI rebound confirms momentum shift, with volume surge suggesting institutional order flow participation.
Demand Zone and price level 1.37407 equal to (Mon 1st Sept 25) - 8.00 am OB Zone.
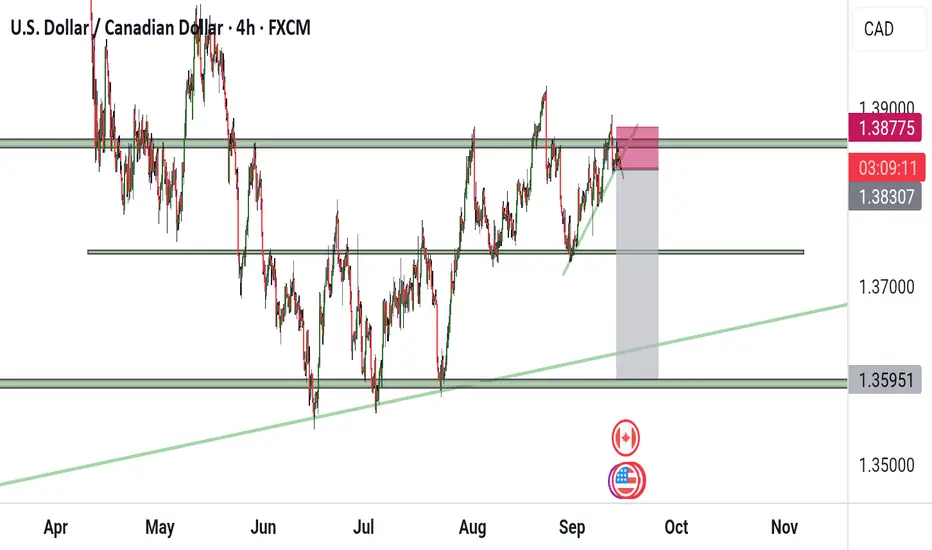
USDCAD upside resistance at 1.3790The USDCAD pair is currently trading with a bearish bias, aligned with the broader downward trend. Recent price action shows a retest of the falling resistance, suggesting a temporary relief rally within the downtrend.
Key resistance is located at 1.3790, a prior consolidation zone. This level will be critical in determining the next directional move.
A bearish rejection from 1.3790 could confirm the resumption of the downtrend, targeting the next support levels at 1.3725, followed by 1.3700 and 1.3690 over a longer timeframe.
Conversely, a decisive breakout and daily close above 1.3790 would invalidate the current bearish setup, shifting sentiment to bullish and potentially triggering a move towards 1.3820, then 1.3840.
Conclusion:
The short-term outlook remains bearish unless the pair breaks and holds above 1.3790. Traders should watch for price action signals around this key level to confirm direction. A rejection favours fresh downside continuation, while a breakout signals a potential trend reversal or deeper correction.
This communication is for informational purposes only and should not be viewed as any form of recommendation as to a particular course of action or as investment advice. It is not intended as an offer or solicitation for the purchase or sale of any financial instrument or as an official confirmation of any transaction. Opinions, estimates and assumptions expressed herein are made as of the date of this communication and are subject to change without notice. This communication has been prepared based upon information, including market prices, data and other information, believed to be reliable; however, Trade Nation does not warrant its completeness or accuracy. All market prices and market data contained in or attached to this communication are indicative and subject to change without notice.

USDCADToday’s Elliott Wave outlook for USDCAD suggests the pair is completing its corrective phase, with potential for the next bearish leg if the structure holds. Traders should watch for confirmation around key levels.

USD/CAD POTENTIAL bullish SOONusd/cad has hit its all time low and could potentially become bullish, tomorrow there will be news about the fed cuts for the US so we will see, on the 10 minute timeframe the momentum has slowed down for the sellers and buyers so there is some indecision taking place.

USDCAD Setup: A Textbook Trade in Motion Sometimes, the market paints a picture so clean it feels like it came straight out of a trading manual—and USDCAD is doing just that.
🔍 What I'm seeing:
- A classic Head and Shoulders pattern forming with clear neckline structure
- A fresh supply zone just above, recently tested
- A sharp reaction as price touches that zone—textbook rejection behavior
📉 My plan: I’ve placed a sell stop just below yesterday’s wick, anticipating a strong bearish move if momentum kicks in. The setup aligns with pattern confirmation and supply zone logic.
🎯 Why it matters: This could be a high-probability move—or not. That’s trading. But as they say: “Risk a little, gain a lot.” I’m ready to see how it plays out.
Let me know your thoughts or if you’re seeing something different on the chart. Let’s trade smart and stay sharp.
Potential bearish drop for the Loonie?The price has reacted off the pivot and could drop to the 1st support which has been identified as a multi-swing low support.
Pivot: 1.3807
1st Support: 1.3720
1st Resistance: 1.3877
Oil markets on September 16, 2025, are caught between conflicting forces. While immediate supply disruption risks from Ukrainian attacks on Russian infrastructure and anticipated Federal Reserve rate cuts are providing near-term price support, fundamental market conditions point to significant oversupply ahead. The EIA's projection of massive inventory builds and OPEC+'s continued production increases suggest substantial downward price pressure through 2026, with Brent potentially falling to $50 per barrel despite current geopolitical tensions. The market is essentially pricing in short-term disruption risks while bracing for longer-term oversupply challenges.

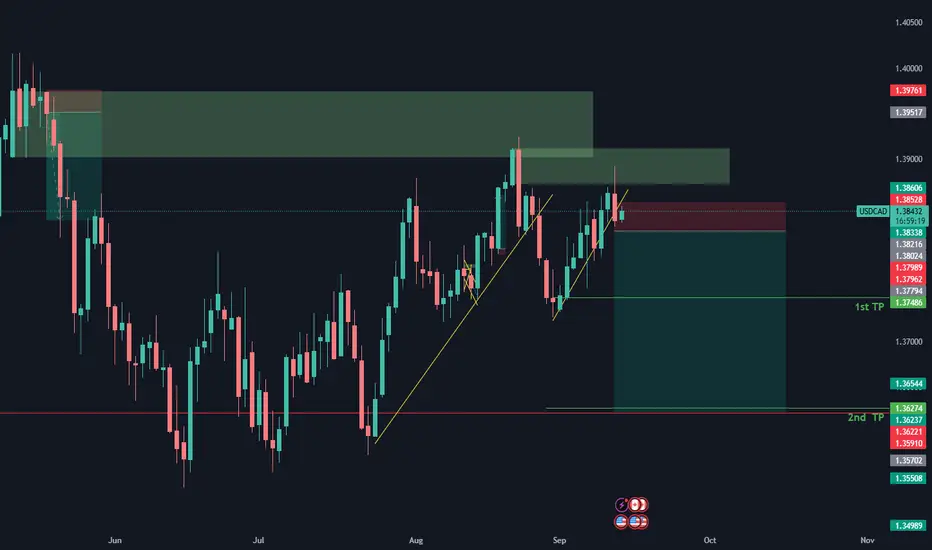
USD/CAD Buy Analysis (4H)USD/CAD Buy Analysis (4H)
1. Trend Context & Supply/Demand
Price recently rejected from the minor supply, but is now moving down towards the demand zone (1.36824–1.37051).
This demand aligns with the ascending channel structure, making it a strong potential support/reversal area.
If demand holds, price may push back up toward the upper supply zone (1.39166–1.39093).
2. Entry & Risk Management
Entry price: around 1.37050–1.37100 (inside the demand zone).
Stop loss: 1.36720 (just below the demand zone for invalidation).
Main target: 1.38571 (mid supply / channel resistance).
Secondary target: 1.39166 (major supply).
Risk/Reward Ratio: approx. 1:3 up to 1:5 depending on target chosen.
3. Strategy
Wait for QM / reversal patterns inside the demand zone (pin bar, engulfing, or liquidity sweep fakeout then reversal).
Monitor lower timeframes (5m–15m) for confirmation and more precise entry.
If demand breaks and stop loss is hit → cancel the buy setup, as bearish continuation may follow.
4. Additional Notes
This is a pro-trend setup (buying from demand in line with the ascending channel).
Confirmation on lower timeframes is crucial to filter out false breaks.
Stay cautious of high-impact USD and CAD news (CPI, interest rate decisions, employment data, etc.).
👉 Now you have two clear scenarios:
Sell setup from minor supply (counter-trend).
Buy setup from demand zone (pro-trend).

USD/CAD Sell Analysis (4H)USD/CAD Sell Analysis (4H)
1. Trend Context & Supply/Demand
Price is currently moving within a minor ascending channel.
A supply zone around 1.39166–1.39093 (resistance) could act as a potential reversal area.
The demand/POI area around 1.36824–1.37051 is the main take-profit target.
2. Entry & Risk Management
Entry price: 1.37929 (within the minor entry box).
Stop loss: 1.38229 → maintaining a reasonable risk/reward ratio.
Target: 1.37051 → key demand area.
Current Risk/Reward Ratio ≈ 2.93 (fairly attractive).
3. Strategy
Wait for a QM (Quasimodo) / reversal pattern within the minor supply zone before entering.
Monitor lower timeframes (5m–15m) for reversal confirmations (pin bar, engulfing, or rejection candle).
If price breaks above the stop, cancel the position since the minor trend is still bullish.
4. Additional Notes
This entry is from a minor supply zone within the channel → counter-trend sell setup.
If price reaches the lower demand zone, consider taking partial profits or cutting the trade based on risk management rules.
Be cautious of high-impact news that could affect CAD (e.g., Canadian or U.S. economic data).

USDCAD: Buy opportunity on H4H4 is still in a bullish trend; the price needs to break the support (buy area) if it truly wants to go down. I'm looking to buy at the trendline & look for confirmation in the lower timeframes.

Usdcad for short.Price retested a previous resistance zone,broke the bullish trend line. We ride to the last support zone.
USD/CAD SHORT FROM RESISTANCE
Hello, Friends!
Previous week’s green candle means that for us the USD/CAD pair is in the uptrend. And the current movement leg was also up but the resistance line will be hit soon and upper BB band proximity will signal an overbought condition so we will go for a counter-trend short trade with the target being at 1.371.
Disclosure: I am part of Trade Nation's Influencer program and receive a monthly fee for using their TradingView charts in my analysis.
✅LIKE AND COMMENT MY IDEAS✅

USDCAD H1 | Bullish bounce at key supportBased on the H1 chart analysis, we could see the price fall to the buy entry, which is an overlap support and could bounce from this level eot the take profit.
Buy entry is at 1.3828, which is an overlap support.
Stop loss is at 1.3809, which is a pullback support that aligns with the 138.2% Fibonacci extension and also slightly below the 78.6% Fibonacci retracement.
Take profit is at 1.3858, which is a pullback resistance.
High Risk Investment Warning
Trading Forex/CFDs on margin carries a high level of risk and may not be suitable for all investors. Leverage can work against you.
Stratos Markets Limited (tradu.com ):
CFDs are complex instruments and come with a high risk of losing money rapidly due to leverage. 65% of retail investor accounts lose money when trading CFDs with this provider. You should consider whether you understand how CFDs work and whether you can afford to take the high risk of losing your money.
Stratos Europe Ltd (tradu.com ):
CFDs are complex instruments and come with a high risk of losing money rapidly due to leverage. 66% of retail investor accounts lose money when trading CFDs with this provider. You should consider whether you understand how CFDs work and whether you can afford to take the high risk of losing your money.
Stratos Global LLC (tradu.com ):
Losses can exceed deposits.
Please be advised that the information presented on TradingView is provided to Tradu (‘Company’, ‘we’) by a third-party provider (‘TFA Global Pte Ltd’). Please be reminded that you are solely responsible for the trading decisions on your account. There is a very high degree of risk involved in trading. Any information and/or content is intended entirely for research, educational and informational purposes only and does not constitute investment or consultation advice or investment strategy. The information is not tailored to the investment needs of any specific person and therefore does not involve a consideration of any of the investment objectives, financial situation or needs of any viewer that may receive it. Kindly also note that past performance is not a reliable indicator of future results. Actual results may differ materially from those anticipated in forward-looking or past performance statements. We assume no liability as to the accuracy or completeness of any of the information and/or content provided herein and the Company cannot be held responsible for any omission, mistake nor for any loss or damage including without limitation to any loss of profit which may arise from reliance on any information supplied by TFA Global Pte Ltd.
The speaker(s) is neither an employee, agent nor representative of Tradu and is therefore acting independently. The opinions given are their own, constitute general market commentary, and do not constitute the opinion or advice of Tradu or any form of personal or investment advice. Tradu neither endorses nor guarantees offerings of third-party speakers, nor is Tradu responsible for the content, veracity or opinions of third-party speakers, presenters or participants.
