Rejection from Supply Zone1H chart shows us rejection from Supply Zone which is good oportunity for sellers.
Wait for confirmation on a lower time frame (I use 5 miutes chart) and enjoy your TP.
CADUSD trade ideas

Potential bearish drop off?USD/CAD has rejected the resistance level, which serves as a pullback resistance that aligns with the 50% Fibonacci retracement, and could potentially drop from this level to our take-profit target.
Entry: 1.3858
Why we like it:
There is a pullback resistance that aligns with the 50% Fibonacci retracement.
Stop loss: 1.3888
Why we like it:
There is a swing high resistance level.
Take profit: 1.3809
Why we like it:
There is a pullback support that aligns with the 78.6% Fibonacci projection.
Enjoying your TradingView experience? Review us!
Please be advised that the information presented on TradingView is provided to Vantage (‘Vantage Global Limited’, ‘we’) by a third-party provider (‘Everest Fortune Group’). Please be reminded that you are solely responsible for the trading decisions on your account. There is a very high degree of risk involved in trading. Any information and/or content is intended entirely for research, educational and informational purposes only and does not constitute investment or consultation advice or investment strategy. The information is not tailored to the investment needs of any specific person and therefore does not involve a consideration of any of the investment objectives, financial situation or needs of any viewer that may receive it. Kindly also note that past performance is not a reliable indicator of future results. Actual results may differ materially from those anticipated in forward-looking or past performance statements. We assume no liability as to the accuracy or completeness of any of the information and/or content provided herein and the Company cannot be held responsible for any omission, mistake nor for any loss or damage including without limitation to any loss of profit which may arise from reliance on any information supplied by Everest Fortune Group.

USDCAD Will Move Lower! Short!
Take a look at our analysis for USDCAD.
Time Frame: 1D
Current Trend: Bearish
Sentiment: Overbought (based on 7-period RSI)
Forecast: Bearish
The price is testing a key resistance 1.384.
Taking into consideration the current market trend & overbought RSI, chances will be high to see a bearish movement to the downside at least to 1.370 level.
P.S
We determine oversold/overbought condition with RSI indicator.
When it drops below 30 - the market is considered to be oversold.
When it bounces above 70 - the market is considered to be overbought.
Like and subscribe and comment my ideas if you enjoy them!

USD_CAD POTENTIAL SHORT|
✅USD_CAD failed to break
The resistance of 1.3860
As it is a strong key level
So we are seeing a bearish reaction
And we will likely see a
Further bearish move down
On Monday
SHORT🔥
✅Like and subscribe to never miss a new idea!✅

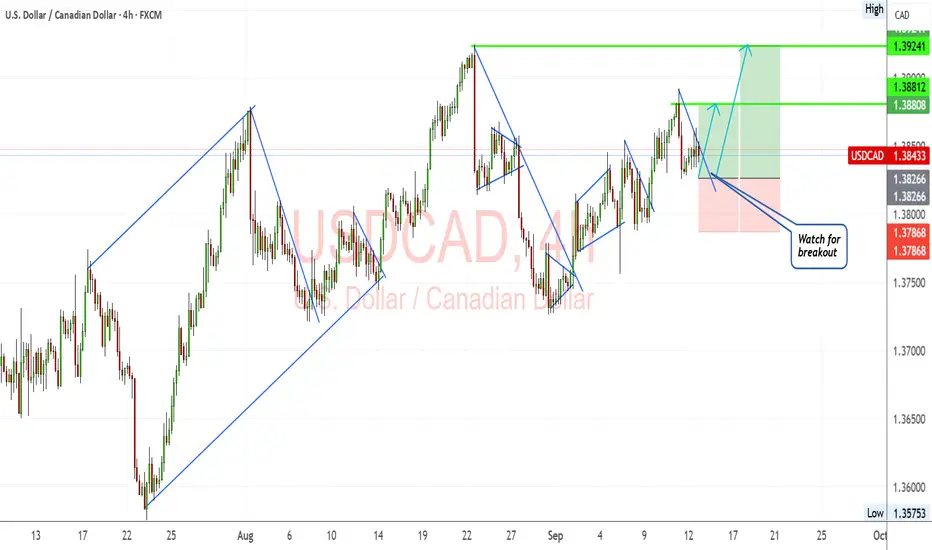
USDCAD Breakout Watch: Bulls Eye 1.3920 After Retesting SupportUSDCAD is coiling for a potential breakout, with buyers defending the 1.3820–1.3840 support zone and eyeing higher levels. The chart shows repeated higher lows, and fundamentals are aligning in favor of the dollar as the Canadian side faces pressure from weaker data and oil volatility. The setup is building momentum for a push toward 1.3920 if the breakout materializes.
Current Bias
Bullish – USD strength and Canadian headwinds support upside continuation.
Key Fundamental Drivers
Federal Reserve: Slower pace of cuts compared to expectations keeps USD attractive.
Bank of Canada: Market pricing leans heavily toward further easing after weak jobs data and slowing growth.
Oil Prices: WTI struggles below $65, weighing on CAD’s commodity-linked appeal.
Trade balance: Canada’s recent deficits add to pressure on CAD.
Macro Context
Interest rates: Fed cautious on cuts; BoC more dovish, widening policy divergence.
Economic growth: Canadian economy showing contraction in GDP and weaker labor data, while US growth remains firmer.
Commodity flows: Oil demand remains uncertain, keeping CAD on the defensive.
Geopolitical: Trade tensions and US tariffs add to USD safe-haven appeal, further denting CAD sentiment.
Primary Risk to the Trend
A strong oil rebound or a surprisingly hawkish BoC stance could support CAD and limit upside in USDCAD.
Most Critical Upcoming News/Event
Canada CPI and BoC decision – key for confirming further CAD weakness.
US CPI and Fed communication – will guide whether USD keeps its bid.
Leader/Lagger Dynamics
USDCAD often acts as a lagger to broad USD moves (particularly following EURUSD and DXY). However, it can lead CAD crosses like CADJPY and AUDCAD when oil-driven moves accelerate.
Key Levels
Support Levels: 1.3820, 1.3785
Resistance Levels: 1.3880, 1.3920
Stop Loss (SL): 1.3785 (below structural support)
Take Profit (TP): 1.3920 (major resistance zone)
Summary: Bias and Watchpoints
USDCAD is consolidating with buyers eyeing an upside breakout. The bias remains bullish, with SL at 1.3785 protecting against downside failure and TP at 1.3920 offering a clean upside target. The divergence between a cautious Fed and a dovish BoC, combined with oil weakness, tilts the balance in favor of USD strength. The key watchpoints are Canada’s CPI and BoC policy direction, which could either accelerate the breakout or disrupt the setup.
USD/CAD) Bullish trend analysis Read The captionSMC Trading point update
Technical analysis of USD/CAD in the 4H timeframe. Here’s the behind the analysis:
---
Key Technical Points:
1. FVG (Fair Value Gap):
The yellow box around 1.3820–1.3830 is a fair value gap where price is expected to retrace before continuing upward.
Acts as a short-term demand zone.
2. MSS (Market Structure Shift):
The chart marks a bullish MSS, meaning structure has flipped from bearish to bullish.
Confirms upside continuation bias.
3. EMA 200 (Dynamic Support):
EMA 200 sits around 1.3797, below current price.
Reinforces the bullish bias as long as price stays above it.
4. Target Point:
Upside target is 1.3925, which aligns with previous highs / liquidity zone.
Chart suggests accumulation → retrace → bullish expansion into that level.
---
Trade Idea Summary:
Bias: Bullish
Scenario:
1. Price may retrace into the FVG zone (1.3820–1.3830).
2. Find support there and bounce.
3. Continue higher toward 1.3925 target point.
Entry Idea: Buy near the FVG demand zone (with bullish confirmation).
Target: 1.3925
Stop-Loss: Below the EMA / FVG (~1.3790).
Mr SMC Trading point
---
Conclusion:
This setup favors buying dips into the FVG zone as long as price respects the EMA 200. The target is 1.3925, making this a bullish continuation play after the recent market structure shift.
---
Please support boost 🚀 this analysis

usdcad 4hTrading Outlooks for the Week Ahead
In this series of analyses, we review short-term trading outlooks and perspectives.
As can be seen, in each analysis there is a key support/resistance zone close to the current price of the asset. The market’s reaction to or breakout from these levels will determine the next price movement toward the specified targets.
Important Note: The purpose of these trading outlooks is to highlight critical price levels ahead and the market’s potential reactions to them. The analyses provided are by no means trading signals!
USDCAD Daily Head and ShouldersGoing into next week we have a nice head and shoulders pattern on the daily. This is also at a nice resistance level. We have recently broken out of a weekly channel so I think this will be the pattern we need to continue to the downside.

USD/CAD SHOWS BEARISHi call it, the pyramids of death, corny right. These pyramids show a pattern, a downtrend pattern i should say. Currently it should be aiming for another downtrend.

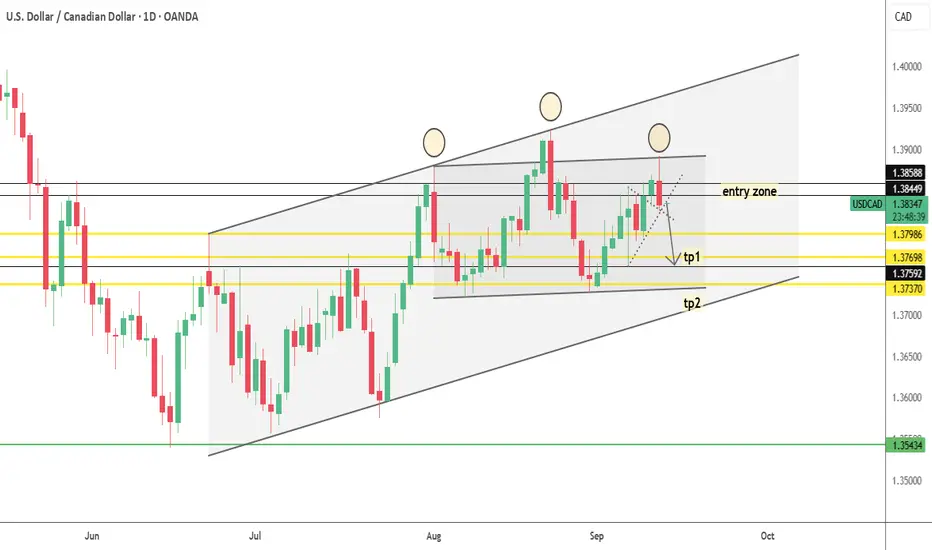
USD/CAD - Forecast 13/9🕰 Weekly
Price has been holding inside a swing range with support around 1.36 – 1.37 and resistance higher near 1.46. Structure hints at a bigger bullish leg if buyers step in.
📅 Daily
Market is pressing against a descending trendline and sitting in a parallel channel. Demand is building around 1.37 – 1.38, while upside targets point toward 1.41 – 1.42 if broken.
⏱ 8H
Price recently swept liquidity below (BSL) and is now coiling under resistance. If we hold 1.37 support, the path opens for a push into 1.40 – 1.41.
🎯 Outlook
Bullish Case: Hold above 1.37 → breakout toward 1.40 – 1.42.
Bearish Case: Lose 1.37 → deeper correction back toward 1.35 demand.
⚖️ Bias : Short-term consolidation → mid-term bullish toward 1.40+.
Thanks traders and like and follow if you agree

USDCAD Breakdown Ahead? Seasonality & COT Divergence1. Retail Sentiment
59% short vs. 41% long: retail traders are moderately short on USD/CAD.
This leaves room for a potential upside squeeze, but positioning is not extreme, so the contrarian signal remains only partial.
2. COT Report
US Dollar (COT):
Large Speculators net short USD (–5,558 contracts).
Commercials net long USD (+6,642 contracts).
→ Speculators are unloading USD, pointing to structural weakness.
Canadian Dollar (COT):
Large Speculators net short CAD (–108,917 contracts).
Commercials net long CAD (+115,041 contracts).
→ A classic pattern: commercials are buying CAD while speculators remain heavily short. Historically, such extreme divergence often precedes CAD appreciation phases.
COT Summary:
USD: weakness from speculators.
CAD: commercials strongly long, speculators extremely short.
→ Clear divergence: potential CAD strength, bearish bias for USD/CAD.
3. Seasonality
September has historically been bearish for USD/CAD:
–0.37% over the last 20 years.
Also negative on 10- and 2-year averages, more mixed on 5 years.
The second half of the month tends to favor CAD strength.
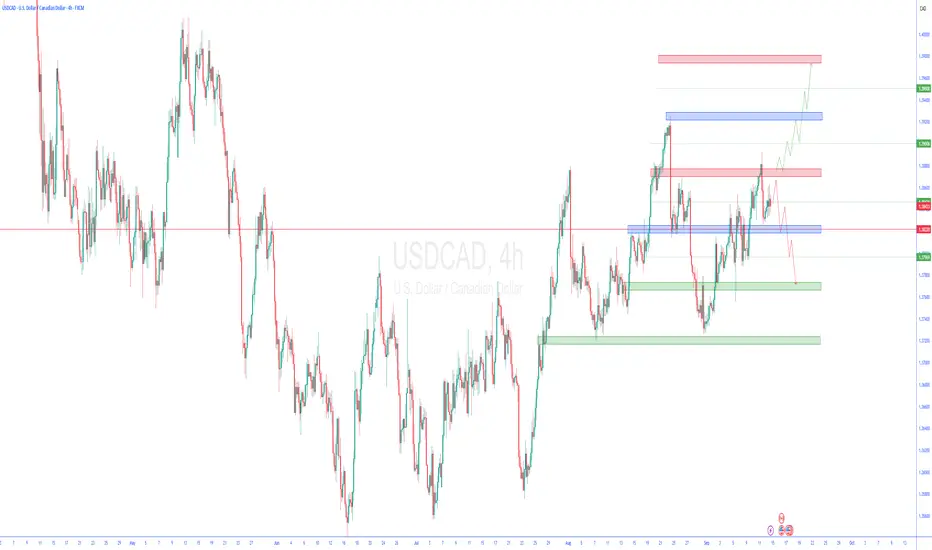
4. Technical Outlook
Supply Zone: 1.3850–1.3900 (key resistance repeatedly tested and rejected).
Demand Zone: 1.3700–1.3720 (first short target), followed by 1.3600–1.3650.
Structure:
Strong rejection from the 1.3890 area.
Lower highs forming.
50–100–200 MAs in bearish confluence.
Daily rejection candle, confirming downside continuation potential.
5. Trading Plan
Bias: Bearish (short USD/CAD).
Setup:
Short on pullbacks to 1.3840–1.3860.
Target 1: 1.3720.
Target 2: 1.3650.
Invalidation: daily close above 1.3900.
Confluences:
✔ Retail moderately short → room for squeeze, but not extreme.
✔ COT: weak USD + strong CAD commercials → bullish CAD signal.
✔ Seasonality: September historically bearish for USD/CAD.
✔ Technicals: rejection at supply + bearish structure.

Day TraderI’m a day trader — yesterday I went long on USDCAD. I saw the setup, knew there’d be some “long energy” building before the move, whether up or down. As day traders, we’re not trying to catch the whole trend — just 30–50 pips a day. All I need to spot is that moment when the market’s loading up with power. Who else feels me?

USD/CAD – Wave Analysis Outlook The current structure on USD/CAD shows price unfolding within a developing corrective sequence. The market has been progressing in overlapping swings, hinting at a temporary continuation higher before a potential reversal.
Based on wave analysis, price appears to be completing a smaller-degree upward leg that could stretch toward the 1.39 – 1.40 zone.
Once that phase matures, the larger context suggests the market may transition into the next downward leg, aligning with the broader corrective cycle.
A failure to sustain above the 1.40 handle would strengthen the bearish case, opening the path toward deeper downside projections.
This perspective highlights how wave formations often build in layers—smaller moves feeding into larger corrective patterns. The key is to observe whether the market respects the unfolding sequence or extends beyond it, which will reveal the true wave count in play.
⚠️ Disclaimer: This post reflects my personal wave analysis for educational purposes only. It is not financial advice. Trading carries risk, and you should always do your own research before making decisions.

USD-CAD Bearish Bias! Sell!
Hello,Traders!
USD-CAD is making a
Retest of the horizontal
Resistance of 1.3863
So as we are locally
Bearish biased we will
Be expecting a further
Bearish move down
Sell!
Comment and subscribe to help us grow!
Check out other forecasts below too!
Disclosure: I am part of Trade Nation's Influencer program and receive a monthly fee for using their TradingView charts in my analysis.

USDCAD BUY!!Sold off aggressively targeting the previous days high , expecting price to continue on an upward trend

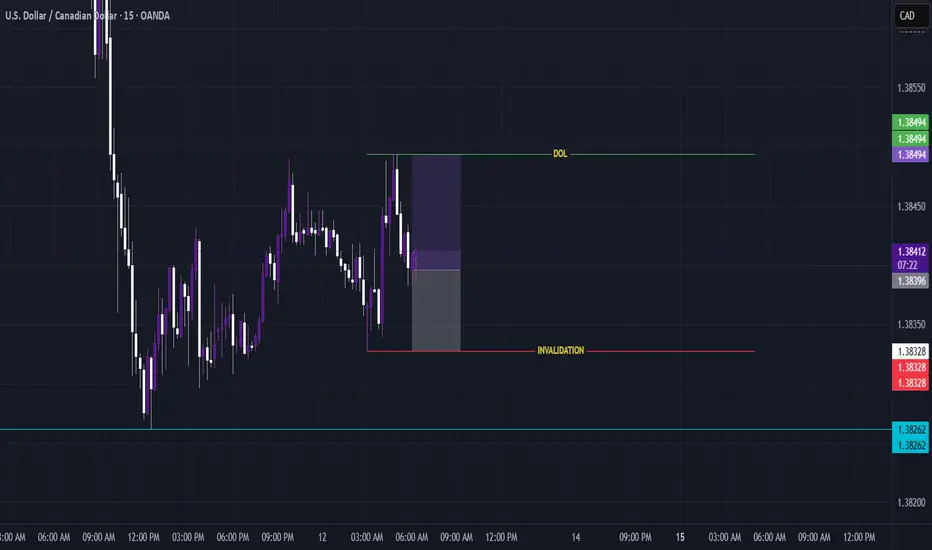
Applying the Nx BIAS indicator to USDCADAfter my latest thread about the 🛡️ Nx BIAS 🛡️ indicator for determining market bias, I decided to take a scalp trade as a backtesting exercise on the USDCAD pair.
Entry details:
Defined the DOL and Invalidation levels using the Nx Bias indicator on the 2Htimeframe.
Identified the area of interest and executed the entry on the 5m - 1m timeframe for the same pair.
Next steps and forward testing:
I will be testing this indicator more extensively. The main goal is to rely solely on it for bias determination under live market conditions to evaluate its real-time performance, moving beyond backtesting results.
Disclaimer: Do Your Own Research (DYOR).
Best regards,
Note: The indicator is not yet available and will be released soon under the name Nx Candle Bias.
USDCAD near breakdown zone; Bearish pressure buildsUSDCAD near breakdown zone; Bearish pressure builds
On Sept. 11, USDCAD tested resistance at 1.3891–1.3904 but failed to break higher, reversing lower after U.S. jobless claims and CPI data. The pair now hovers near 1.38350–1.3840, supported by the 100-hour MA at 1.3859. This zone is key: holding above favors dip-buyers, while a break below 1.3812 would tilt bias bearish.
By Sept. 12, the dollar edged higher after the prior day’s drop, as U.S. jobless claims jumped to a four-year high while inflation rose modestly. Markets remain focused on a Fed cut next week, with futures fully pricing a 25-bps move on Sept. 17 and reduced odds of a 50-bps cut.

USDCAD: Pullback Trade From Support 🇺🇸🇨🇦
USDCAD is going to bounce from a strong intraday horizontal support.
My confirmation signal is a formation of a double bottom pattern
on that and a breakout of its horizontal neckline.
I expect move up to 1.3855
❤️Please, support my work with like, thank you!❤️
I am part of Trade Nation's Influencer program and receive a monthly fee for using their TradingView charts in my analysis.

check the trendIf the price changes direction within the current support range, we are expected to see the beginning of the upward trend to the resistance levels. Otherwise, the continuation of the downward trend to the next support levels is possible.
USDCAD - LONG - Conviction: Medium | Chronex ( London • Sep 10 )Hello Guys!
🎯 90 % mechanical | Just your entry model
No trend-line art, no gut calls. Just a repeatable institutional process delivered every day at London Open
Context:
🧠 What Chronex does (bird’s-eye view)
- Scans all 28 major FX pairs every session.
- Ranks each currency’s relative strength / weakness from multi-TF data.
- Pairs strongest vs. weakest to create a tight outlook list.
- Adds built-in risk filters → posts one clean table: *Direction · Conviction · Entry zone · SL*.
📍 Today’s Playbook:
Risks
1. Do we have economic high impact news release?
2. Any higher-timeframe counter-trend zones?
3. Has better zone above/below?
Verdict:
💬 Drop questions, challenge the outlook, or share your own setups below!

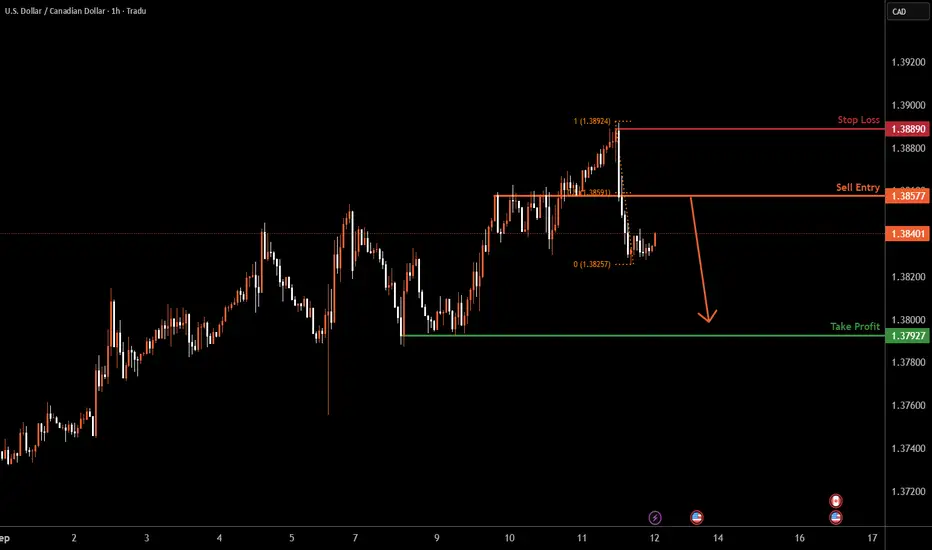
USDCAD H1 | 50% Fibonacci resistance signals bearish reversalLoonie (USD/CAD) is rising towards the sell entry, which is a pullback resistance that aligns with the 50% Fibonacci retracement and could reverse from this level to the downside.
Sell entry is at 1.3857, which is a pullback resistance that aligns with the 50% retracement.
Stop loss is at 1.3792, which is a swing high resistance.
Take profit is at 1.3792, which is a pullback support.
High Risk Investment Warning
Trading Forex/CFDs on margin carries a high level of risk and may not be suitable for all investors. Leverage can work against you.
Stratos Markets Limited (tradu.com ):
CFDs are complex instruments and come with a high risk of losing money rapidly due to leverage. 65% of retail investor accounts lose money when trading CFDs with this provider. You should consider whether you understand how CFDs work and whether you can afford to take the high risk of losing your money.
Stratos Europe Ltd (tradu.com ):
CFDs are complex instruments and come with a high risk of losing money rapidly due to leverage. 66% of retail investor accounts lose money when trading CFDs with this provider. You should consider whether you understand how CFDs work and whether you can afford to take the high risk of losing your money.
Stratos Global LLC (tradu.com ):
Losses can exceed deposits.
Please be advised that the information presented on TradingView is provided to Tradu (‘Company’, ‘we’) by a third-party provider (‘TFA Global Pte Ltd’). Please be reminded that you are solely responsible for the trading decisions on your account. There is a very high degree of risk involved in trading. Any information and/or content is intended entirely for research, educational and informational purposes only and does not constitute investment or consultation advice or investment strategy. The information is not tailored to the investment needs of any specific person and therefore does not involve a consideration of any of the investment objectives, financial situation or needs of any viewer that may receive it. Kindly also note that past performance is not a reliable indicator of future results. Actual results may differ materially from those anticipated in forward-looking or past performance statements. We assume no liability as to the accuracy or completeness of any of the information and/or content provided herein and the Company cannot be held responsible for any omission, mistake nor for any loss or damage including without limitation to any loss of profit which may arise from reliance on any information supplied by TFA Global Pte Ltd.
The speaker(s) is neither an employee, agent nor representative of Tradu and is therefore acting independently. The opinions given are their own, constitute general market commentary, and do not constitute the opinion or advice of Tradu or any form of personal or investment advice. Tradu neither endorses nor guarantees offerings of third-party speakers, nor is Tradu responsible for the content, veracity or opinions of third-party speakers, presenters or participants.
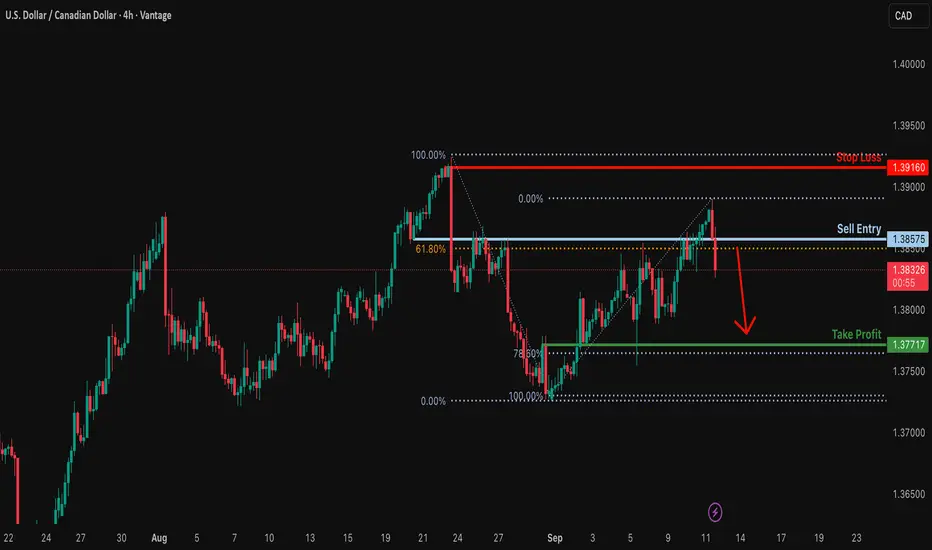
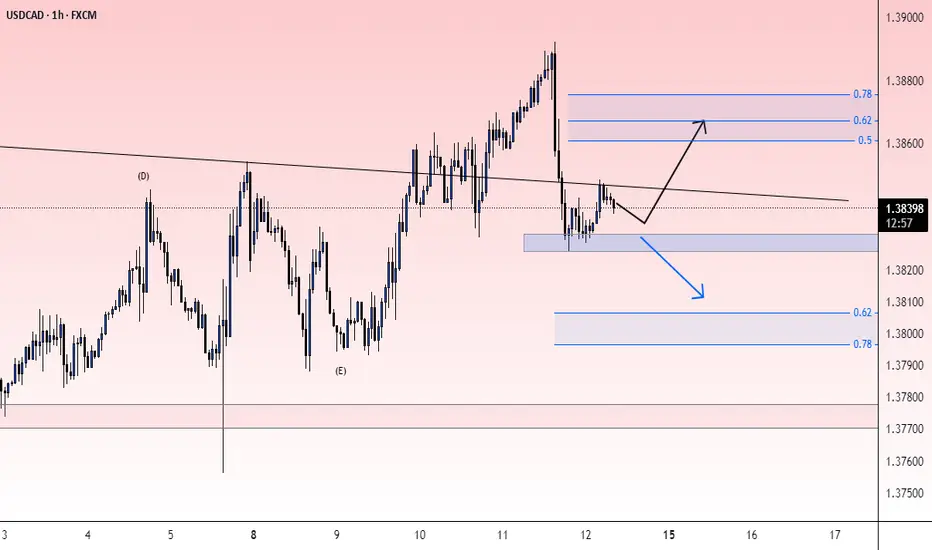
Potential bearish drop?USD/CAD is reacting off the resistance level which is a pullback resistance that aligns with the 61.8% Fibonacci retracement and could drop from this level to our take profit.
Entry: 1.3857
Why we like it:
There is a pullback resistance level that lines up with the 61.8% Fibonacci retracement.
Stop loss: 1.3916
Why we like it:
There is a swing high resistance level.
Take profit: 1.3771
Why we like it:
There is a pullback support that aligns with the 78.6% Fibonacci retracement.
Enjoying your TradingView experience? Review us!
Please be advised that the information presented on TradingView is provided to Vantage (‘Vantage Global Limited’, ‘we’) by a third-party provider (‘Everest Fortune Group’). Please be reminded that you are solely responsible for the trading decisions on your account. There is a very high degree of risk involved in trading. Any information and/or content is intended entirely for research, educational and informational purposes only and does not constitute investment or consultation advice or investment strategy. The information is not tailored to the investment needs of any specific person and therefore does not involve a consideration of any of the investment objectives, financial situation or needs of any viewer that may receive it. Kindly also note that past performance is not a reliable indicator of future results. Actual results may differ materially from those anticipated in forward-looking or past performance statements. We assume no liability as to the accuracy or completeness of any of the information and/or content provided herein and the Company cannot be held responsible for any omission, mistake nor for any loss or damage including without limitation to any loss of profit which may arise from reliance on any information supplied by Everest Fortune Group.