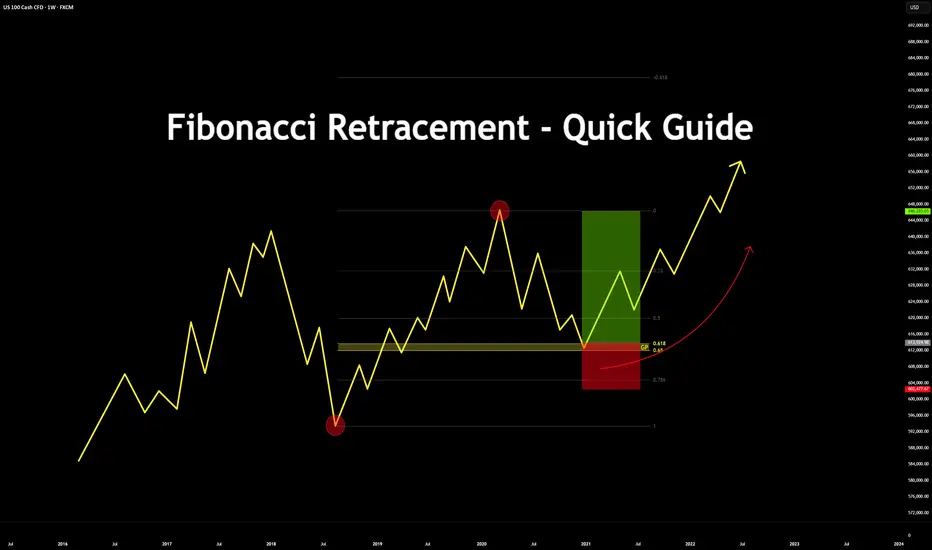
Fibonacci Retracement - Quick Guide in 5 StepsTrading the Fibonacci Retracement - Quick Guide in 5 Steps.
What is the Fibonacci tool?
The Fib Retracement Tool is a tool used widely across many charts. From crypto to stocks.
It assists in identifying the Golden Pocket, along with any potential Support and Resistance zones based on the sequence in Fibonacci.
Investors & Traders draw it from a previous high/low or low/high.
On a chart, each key level shows where price might pause or reverse during a pull back, before it continues the trend.
In this guide you will learn how to use the Fibonacci tool in 5 steps.
1. Configurations
Open up your Fib Retracement Tool's settings, apply the below configurations.
(You can change the color to your choice)
2. Identify High/Low's
Identify, recent highs and lows of your current chart/pair.
3. Applying Fib Retracement
Select your Fib Retracement tool. Place it on your chart starting from the swing low to the swing high.
4. Once completed
Highlight the Golden Pocket Field in the zone (0.65-0.618)
5. Review Entry
Price will eventually make it's way back down to the Golden Pocket to retest and reverse.
SL Placement would be on a previous low or key level, TP placement would be at a previous high or key level.
Bonus:
See the real time example below:
Please like, comment and follow if this guide was useful to you.
If you have any requests on analysis or tutorial requests, let me know and I'll be happy to make one!
Trade ideas
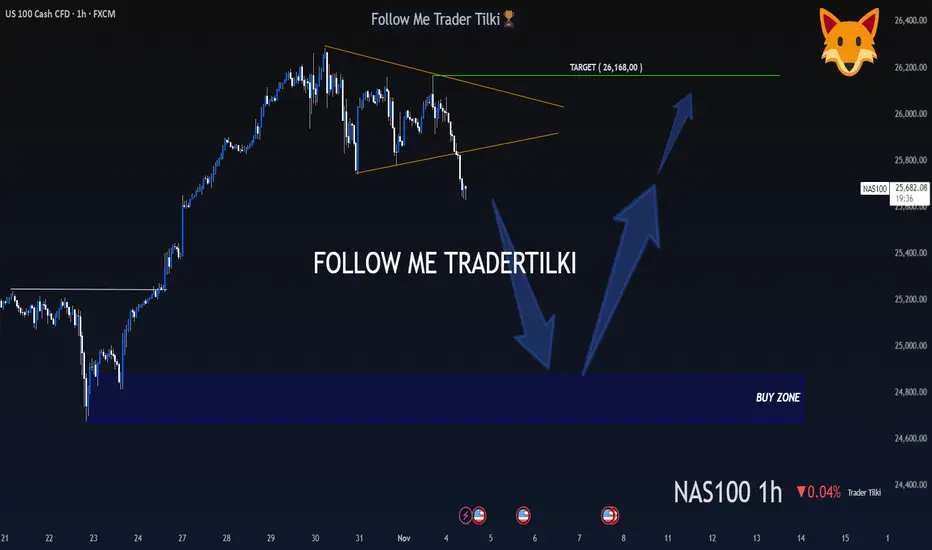
A Hunter Waits Patiently, Then Strikes Like a Lion - US100 - 1HMy dear friends, greetings,
My friends, I have set the buy levels for US100 at 24,872 and 24,677.
I will never enter a trade or put myself at unnecessary risk before these levels are reached.
My friends, in order to consistently win in this market and to become a successful trader, patience is essential.
If you act with patience and strategy, you will always be a winning trader, just like me.
I would also like you to know that my target is set at the 26,168 level.
My friends, every single like from you is my greatest motivation to share these analyses.
I sincerely thank everyone who supports me with their appreciation.
With my respect and love.
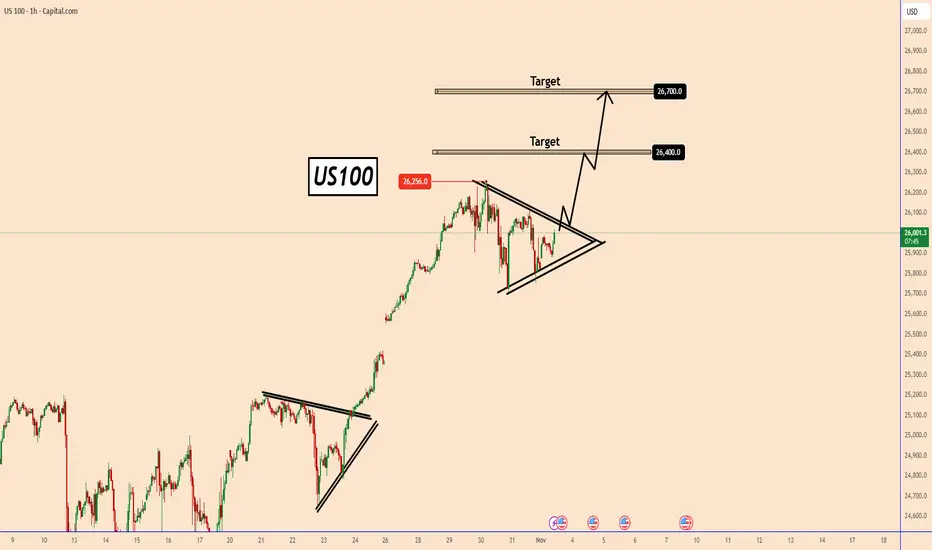
US100 is in a strong uptrend and continues to set new highsUS100 is in a strong uptrend and continues to set new highs.
An all-time high was set last week near 26256, and there is a good chance that US100 will continue to rise.
The price is rallying again and once it moves above the triangle, another uptrend could begin.
Comments from the FED that they may cut rates further in the coming months are supporting the indices by raising hopes and the upward momentum is linked to the booming economy
Key targets:
26400 and 26700
You may find more details in the chart!
Thank you and Good Luck!
❤️PS: Please support with a like or comment if you find this analysis useful for your trading day❤️
USNAS100 | Bearish Bias Holds Below 26,180 Ahead of Key DataUSNAS100 – MARKET OUTLOOK | Testing Pivot Zone, Awaiting Breakout 🇺🇸
The NASDAQ 100 is testing the pivot zone at 26,095–26,180, with momentum still bearish as long as it trades below this range.
🔽 Below 26,180: Bearish bias toward 25,890 → 25,700 → 25,340.
🔼 Above 26,180: Bullish reversal toward 26,500 → 26,850.
Pivot Zone: 26,095–26,180
Support: 25,890 · 25,700 · 25,350
Resistance: 26,320 · 26,500 · 26,850
USNAS100 remains bearish below 26,180, but a confirmed break above this level could signal the start of a new bullish leg.

US100 Technical Analysis! BUY!
My dear friends,
US100 looks like it will make a good move, and here are the details:
The market is trading on 25826 pivot level.
Bias - Bullish
Technical Indicators: Supper Trend generates a clear long signal while Pivot Point HL is currently determining the overall Bullish trend of the market.
Goal - 25982
Recommended Stop Loss - 25749
About Used Indicators:
Pivot points are a great way to identify areas of support and resistance, but they work best when combined with other kinds of technical analysis
Disclosure: I am part of Trade Nation's Influencer program and receive a monthly fee for using their TradingView charts in my analysis.
———————————
WISH YOU ALL LUCK

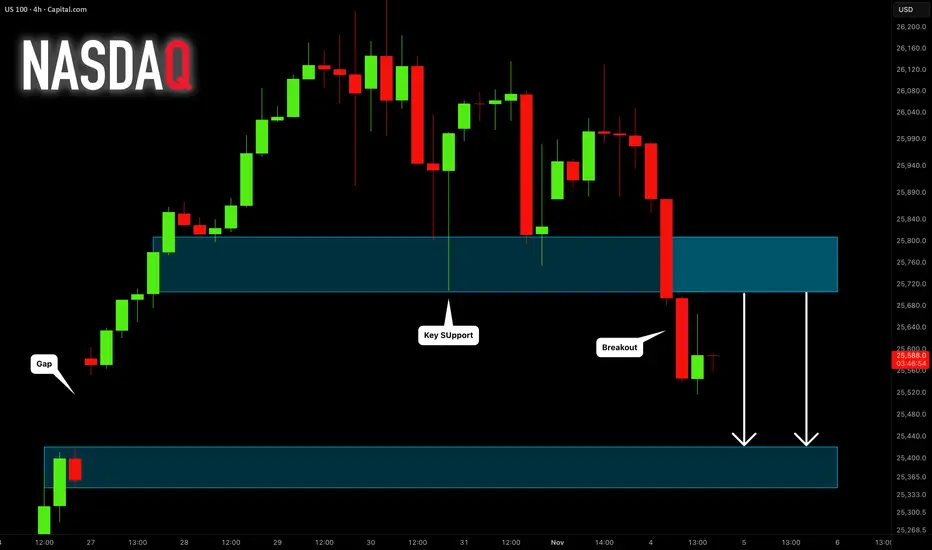
NASDAQ INDEX (US100): Forgotten Gap
A week ago, US100 formed a gap up opening.
It looks like the index is finally ready to fill it.
A breakout of a major horizontal support is a strong bearish signal.
Expect a bearish continuation to 25420.
❤️Please, support my work with like, thank you!❤️
I am part of Trade Nation's Influencer program and receive a monthly fee for using their TradingView charts in my analysis.
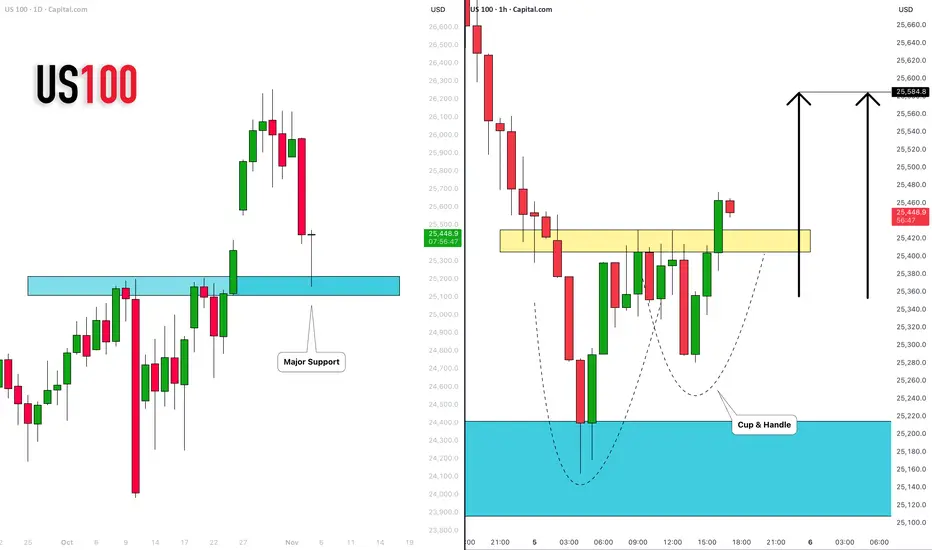
NASDAQ INDEX (US100): Time to Recover
US100 index dropped yesterday, as I predicted.
The market is recovering now, after a test of a major daily support cluster.
A formation of a cup & handle pattern on that and a breakout of its neckline
indicate a strong buying pressure.
With a high probability, the market will rise and reach 25580 level soon.
❤️Please, support my work with like, thank you!❤️
I am part of Trade Nation's Influencer program and receive a monthly fee for using their TradingView charts in my analysis.
NASDAQ BullishThe NASDAQ is currently reacting at a key daily market structure level.
Heading into the New York session, I’m anticipating a potential sweep of sell-side liquidity levels before price shifts upward, possibly targeting new all-time highs
#NASDAQ #US100 #Indices #TechnicalAnalysis #TradingView

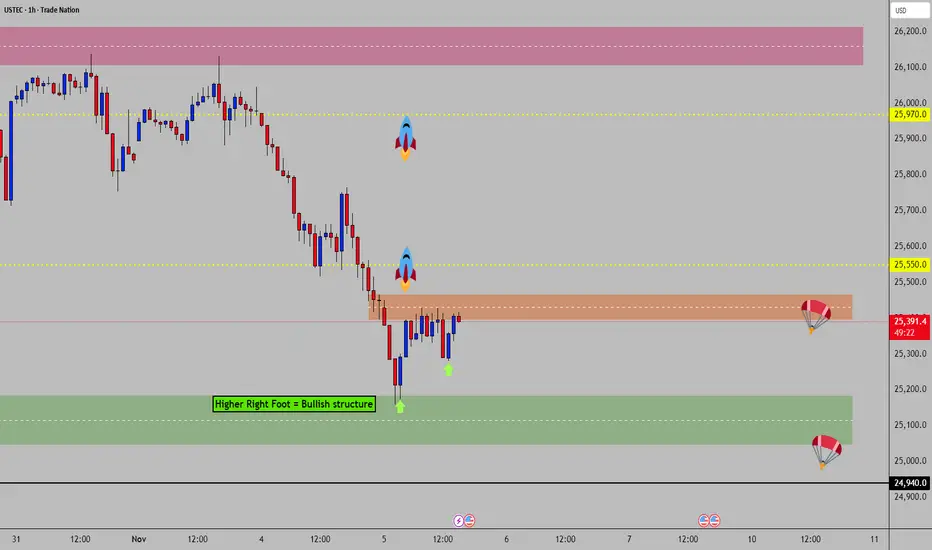
NAS100 - Bullish Structure in Progress @ Demand AreaDear friends in trading,
🎯Bullish structure in progress...
🎯If price breach and hold above 25470 it can potentially launch a rally to 25970.
❌ It can also fail and fall back to demand area - watch 25300 (2HR candle)
🔑Kindly see our profile for your exclusive weekly updates.⚜️⚜️
🙏🏻Thank you in advance for your continued support.
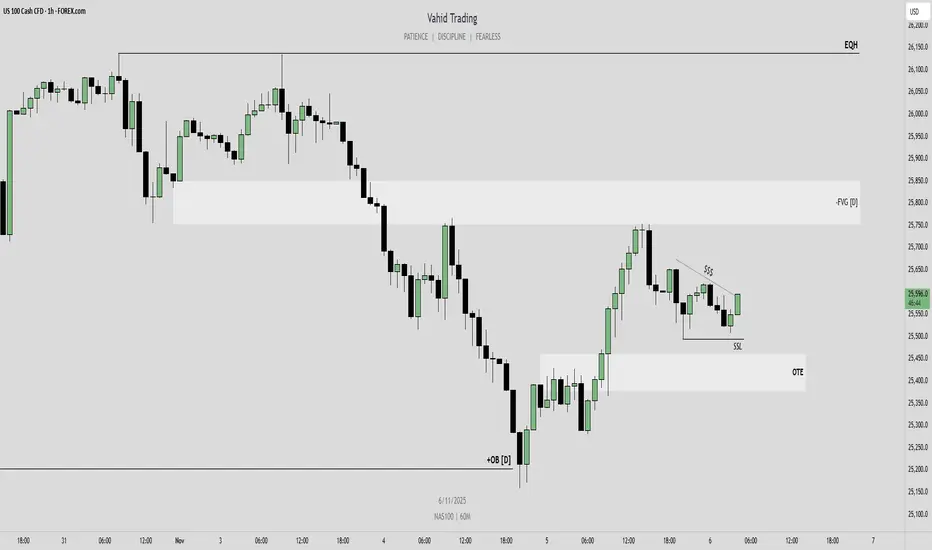
US100 – Bullish Continuation in Play After Daily OB ReactionHello traders,
On the 1-hour chart, NASDAQ (US100) has reacted strongly from the bullish Daily Order Block, showing clear signs of higher-timeframe strength. This reaction suggests that the bullish order flow is still intact.
With this structure in mind, I expect the upward move to continue toward the bearish Daily Fair Value Gap, which serves as my first target.
My final target for this bullish leg is the equal highs around 26,136, where a significant liquidity pool rests.
However, before the next expansion higher, I would prefer to see price move lower to sweep the liquidity below the recent lows and trade into an Optimal Trade Entry (OTE) zone. From there, I’ll look for lower-timeframe confirmation to catch the next leg up.
Staying bullish unless higher-timeframe invalidation occurs.
💌It is my honor to share your comments with me💌
🔎 DYOR
💡Wait for the update!
Nasdaq - The most important structure!💰Nasdaq ( TVC:NDQ ) perfectly respects structure:
🔎Analysis summary:
Over the course of the past couple of months, the Nasdaq has been rallying an expected +50%. Still, until the Nasdaq will retest the upper channel resistance trendline, this rally won't be over. Therefore, we can still see a rally of another +10% in the very near future.
📝Levels to watch:
$25,000 and $30,000
SwingTraderPhil
SwingTrading.Simplified. | Investing.Simplified. | #LONGTERMVISION

NAS100 Trade Set Up Nov 3 2025If price trades into PDH first i will wait for internal bearish structure to catch sells down to SSL/London Lows but if price comes to test 1h FVG first and respects it i will look for internal structure to catch buys to PDH

Nasdaq 100 Analysis: Early November Movements Raise ConcernsNasdaq 100 Analysis: Early November Movements Raise Concerns
As the chart shows, the Nasdaq 100 index gained around 6% in October, supported by several key factors:
→ The meeting between US President Donald Trump and Chinese leader Xi Jinping, which helped ease tensions in trade relations between the world’s two largest economies.
→ A 0.25% rate cut by the Federal Reserve.
→ Positive earnings from major tech companies, including a strong report from Alphabet (GOOGL).
However, the market’s behaviour in early November is cause for concern — on the morning of 4 November, the stock index fell to its lowest level in a week. Bearish sentiment is being fuelled by:
→ uncertainty over the timing of the end of the government shutdown;
→ a weaker-than-expected ISM Manufacturing PMI report, which may reflect the impact of Trump’s tariffs on US industry.
Technical Analysis of the Nasdaq 100 Chart
Analysing the hourly chart of the Nasdaq 100 on 30 October, we:
→ confirmed the relevance of the upward channel (shown in blue), noting that the upper boundary was showing signs of resistance;
→ drew a steeper trajectory consisting of three orange lines;
→ suggested a profit-taking scenario, in which bears would attempt to push the Nasdaq 100 index down towards the median line of the blue channel.
This scenario has since materialised, as:
→ the median line has repeatedly acted as support (highlighted in blue);
→ the breakout level of the orange lines at 26,120 has turned into a resistance zone.
At present, the Nasdaq 100 index is trading in the lower half of the channel, indicating that the bullish momentum from late October has faded. Bulls might find support near the gap area, reinforced by the lower boundary of the blue channel.
This article represents the opinion of the Companies operating under the FXOpen brand only. It is not to be construed as an offer, solicitation, or recommendation with respect to products and services provided by the Companies operating under the FXOpen brand, nor is it to be considered financial advice.

NasdaqNasdaq is showing a correction pattern after a previous upward movement. The price closed below the old support zone and was rejected, confirming a resistance zone at 25,923.4.
The loss of this support reinforces the continuation of the corrective movement, with a projected drop towards the next support zone at 25,569.8, a point where there is convergence with the previous low and a potential area for absorbing buy orders.

NAS100 Trade Set Up Nov 4 2025Price is bearish making LH/LL on the 1h and 15m, has already swept BSL/London highs and inverted 15m FVG so i will be looking for sells down to SSL/London lows


Nasdaq long then short: Expecting one last wave upIn this analysis, I talk about the wave structure for Nasdaq and highlighted that wave 1 is currently the longest wave and that means wave 5 cannot be longer than wave 3. This gives us a maximum target of 26300 that is already hit on 30th Oct. So while I do expect another up wave for Nasdaq, this will likely be a double top with the same high as 30th Oct before we start on a longer-term move down.

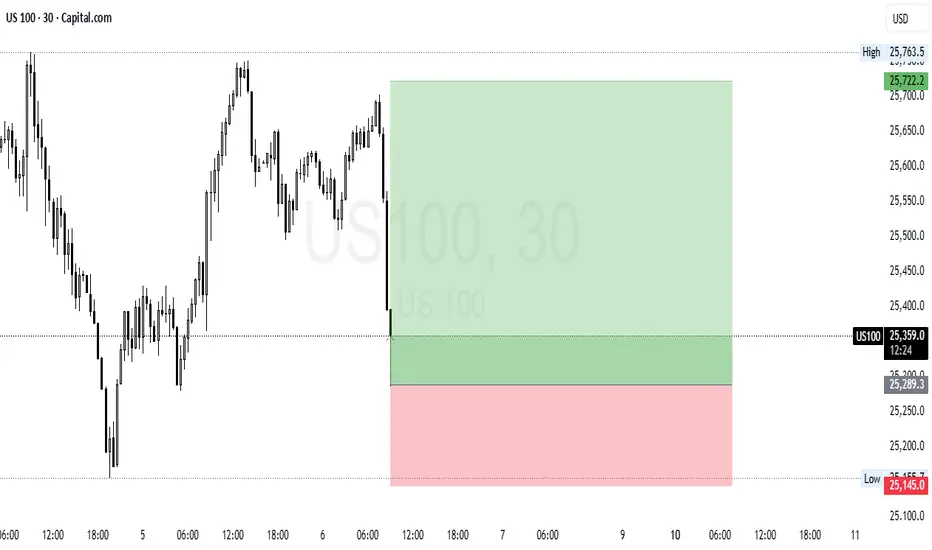
US100 (NASDAQ 100) Long SetupAnalysis:
The market formed a strong bullish leg earlier and is now pulling back to retest a key support zone around 25,300. If price holds this level and shows bullish confirmation (e.g., bullish engulfing or structure break), we could see continuation to the upside.
Bias: Bullish above 25,300
Invalidation: Break below 25,145
Setup Type: Long Position
Entry: Around 25,300 (support retest)
Stop Loss: 25,145
Target: 25,720+
#US100 #NASDAQ100 #PriceAction #TradingSetup #TechnicalAnalysis #ChartAnalysis #BuySetup #TradingView #SmartMoney #Forex #Indices
NASDAQ Channel Up still stands buy needs a pull-back.Nasdaq (NDX) reached the top of its 5-month Channel Up and got rejected. It completed a +9.59% rise from the last 1D MA50 (red trend-line) bottom (Higher Low for the pattern), similar to the previous Bullish Leg.
The maximum a Bullish Leg has increased by inside this pattern is +10.87%. As a result, either now or just above it, the pattern would require a technical pull-back. The most usual buy signal is on its 4H MA200 (orange trend-line) and the most effective when the 4H RSI breaks below its oversold (30.00) barrier.
Our next Buy Zone is within the 0.382 - 0.5 Fibonacci retracement range.
-------------------------------------------------------------------------------
** Please LIKE 👍, FOLLOW ✅, SHARE 🙌 and COMMENT ✍ if you enjoy this idea! Also share your ideas and charts in the comments section below! This is best way to keep it relevant, support us, keep the content here free and allow the idea to reach as many people as possible. **
-------------------------------------------------------------------------------
💸💸💸💸💸💸
👇 👇 👇 👇 👇 👇

US100 (NAS100) The Tech Sector's Next Breakout📊 Technical Context: The Range-Bound Reality
The 4-hour chart reveals that the NAS100 is currently entrenched in a narrow consolidation channel, forming a high-probability decision zone. The recent price action has tested a pivotal support region following a downward correction from the peak.
Key Structural Levels (Based on 4H Chart):
• Current Pivot: The index is trading near 25,866.9, which sits just above the primary consolidation floor.
• Immediate Resistance (Ceiling): The first significant barrier is the zone around 26,167.3.
• A definitive 4H candle close above this level would signal a short-term bullish breakout.
• Critical Support (Floor): The key technical floor is the consolidation range low near 25,560.0. This level must hold to maintain the current neutral to bullish structural bias.
Upside Targets:
• A break above 26,167.3 unlocks the path to the first swing high target at 26,566.8 (a +278.0 point move from the ceiling).
• The major continuation target sits at the recent swing high of 27,004.0 (a total upside potential of approximately +719.6 points).
Downside Targets:
• A decisive 4H candle close below 25,560.0 would invalidate the immediate range.
• The next major support and downside target is exposed at 25,217.4 (a downside target of approximately -519.2 points).
Technical Verdict: The market is poised for a volatility expansion move once a clear breakout occurs from the 25,560.0 - 26,167.3 range. The longer the consolidation persists, the more forceful the eventual move is likely to be.
📰 Fundamental Headwinds & Tailwinds
To achieve an Editor's Pick, this technical setup must be grounded in the macroeconomic forces driving the technology sector (NASDAQ's primary composition).
The Fed & Interest Rates (High Volatility Risk):
• The price action is highly sensitive to signals regarding interest rate cuts.
• Hawkish Commentary (Headwind): Any shift to a tighter monetary stance by the Federal Reserve (Fed) could quickly lead to a break of the 25,560.0 support, as higher rates reduce the present value of future earnings for growth stocks.
• Dovish Commentary (Tailwind): Signals indicating a pause or potential for future cuts will act as a strong fundamental catalyst, likely fueling a breakout toward 27,004.0.
Corporate Earnings and GDP Data (Directional Catalysts):
• Positive Earnings: Strong quarterly reports from the 'Magnificent Seven' (the largest NASDAQ components) are essential. Positive surprises can provide the fundamental fuel needed for a break above 26,167.3.
• Inflation/Employment Data: Upcoming releases of major economic indicators (such as the Consumer Price Index or Non Farm Payroll) will dictate market sentiment. Reports suggesting persistent inflation are a risk factor, while softening data supports a relief rally.
💡 Potential Trading Strategy
Traders should adopt a reactive, breakout-based strategy rather than anticipating the direction within the current range.
1. Bullish Breakout (Long Setup):
• Entry Confirmation: Wait for a clean 4H close above the resistance zone of 26,167.3 on increased volume, ideally coinciding with a positive fundamental catalyst.
• Initial Target: 26,566.8.
• Secondary Target: 27,004.0.
• Risk Management: Place a stop loss just below the consolidation ceiling (e.g., 26,000.0).
2. Bearish Breakout (Short Setup):
• Entry Confirmation: Wait for a decisive 4H close below the critical support of 25,560.0, triggered by adverse fundamental news or technical momentum.
• Initial Target: 25,217.4.
• Risk Management: Place a stop loss just above the broken support (e.g., 25,750.0).
FINAL SUMMARY
The NAS100 is presenting a high conviction "wait and confirm" setup. The technical structure provides clear boundaries, while the fundamental landscape (Fed policy and earnings) is poised to deliver the catalyst. Do not trade the range; trade the break.

NAS100 Head and Shoulders on M15 still at PlayThe plan for Nas100 is still the same as my analysis on Friday.
Now we just need a break of those lower highs that formed on Friday so we can continue to short it to the gap as planned.

NAS100 Berish FlagThere is a double top rejection currently at play on H1 and a bearish flag on M15.
A break out and retest of this flag will provide safer and a higher probability setup.

USNAS100 | Buyers Hold Control Above 25440USNAS100 | Overview
The price reached the resistance zone after stabilizing above 25440.
Currently, it appears to be retesting 25440 before attempting another push higher toward 25700 – 25820.
A 1H close above 25820 would confirm further bullish momentum toward the all-time high (ATH) at 26170.
However, a move below 25440 would indicate renewed bearish pressure toward 25220, with a confirmed break below 25220 activating a broader downward trend.
Pivot Line: 25700
Resistance: 25820 · 25960 · 26170
Support: 25440 · 25230 · 25010
Outlook:
Bullish while above 25440, targeting 25700–25820.
Bearish scenario activates only below 25220.
