US30 Technical Breakdown – 10/30/2025
📍 US30 Technical Breakdown – 10/30/2025
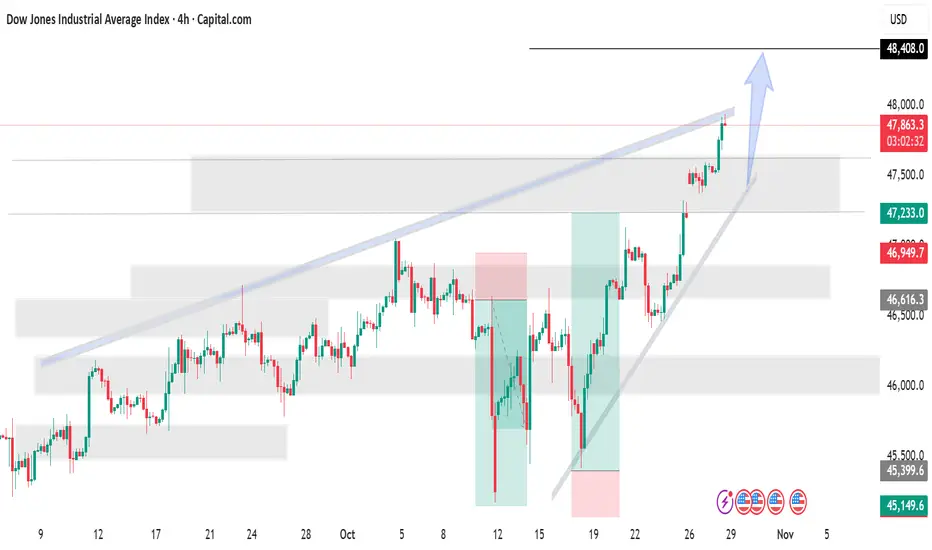
US30 cooled off after a strong rally last week 🔥 Price printed a local high around 47,800, then started retracing as momentum slowed. The index is now testing the 47,500–47,400 support zone, sitting right around the EMAs — a crucial spot for bulls to defend 👀
📊 Market Behavior:
🔹 Higher highs and higher lows still intact (bullish structure)
🔹 EMAs starting to flatten → possible short-term pullback
🔹 Buyers defending 47.4K area so far
📌 Key Levels:
🔹 Resistance Zones:
47,790 → recent high / intraday resistance
48,000 → major breakout level
48,200 → continuation target
🔹 Support Zones:
47,400 → EMA & structure support
47,100 → previous breakout zone
46,520 → demand base
🧠 Bias:
Bullish overall ⚡
➡️ Above 47,800 → breakout continuation toward 48,200+
⬅️ Below 47,400 → short-term correction back toward 47,100
Trade ideas

DJIShift prediction to the right.
Global market cooler anticipated. Crypto should be hit the hardest and fastest.
Most anticipating rally continuation like post-COVID...
I think that will cause a surprise.


DOW JONES approaching the end of its Bull Cycle?Dow Jones (DJI) has been trading within a 16-year Channel Up ever sine the March 02 2009 market bottom of the U.S. Housing Crisis. As this chart shows, we have divided this pattern into three different phases.
Since the March 2020 COVID crash, it appears that the Cycle got restarted as the index broke below its 1W MA200 (orange trend-line) again after 10 years. Technically that was the only time that multi-year Support trend-line broke in 15 years.
In any case, following that Cycle 'restart', it appears that the index is currently inside the Megaphone pattern that in 2015 concluded Phase 2. The conclusion came with a second test on the 1W MA200 (Double Bottom). The first test was the April 07 2025 Low.
With their 1W RSI sequences also identical, having the first 1W MA200 forcing a 30.00 (oversold) RSI rebound, we expect the index to start a new Bearish Leg that might potentially test the 1W MA200 around 39000. For long-term investors, that is the market's next Buy Entry.
-------------------------------------------------------------------------------
** Please LIKE 👍, FOLLOW ✅, SHARE 🙌 and COMMENT ✍ if you enjoy this idea! Also share your ideas and charts in the comments section below! This is best way to keep it relevant, support us, keep the content here free and allow the idea to reach as many people as possible. **
-------------------------------------------------------------------------------
💸💸💸💸💸💸
👇 👇 👇 👇 👇 👇

US30 Bullish Breakout!
HI,Traders !
#US30 is trading in a strong
Uptrend and the price made a
Bullish breakout of the key
Horizontal level of 46718.2
So we are bullish biased
And we will be expecting a
Further bullish move up !
Comment and subscribe to help us grow !

US30 Longs Longs loading as PDH was swept pre-FOMC , price trading down toward discounted price of current Trading range
Looking for longs off of the the IFVG , targeting the new range high .

US30The Dow Jones index is at the end of its upward movement. The maximum level of increase is 48150, and then the price will decrease and correct, and we will definitely have sharp spikes to the downside with the release of economic news. This weekend and the week ahead will be exciting days for the indices. The price reduction levels are indicated in the analysis. The risk of short positions is very low.
This was a personal opinion and the trading responsibility lies with each person.

Before DOW 50K Happens (DJI long call for holders)Remember the future. Beware of the past. This time it's different. That's all.
I recommend studying Richard Wyckoff Stock Trading Technique, but not Tape Reading because that information is past its prime, in my opinion ;)
There's nothing left but upward ascent for humanity in my view. This is to do with spiritual reasons that many of us traders are privy to in our inner circles.
This chart is directed guidance towards the g20 group and the G7 group of Countries we call Home on Earth protectors.
We use capitalization as necessary to achieve the desired effect, affect, or required attribute enrichment in order to AVOID City 17, and not have to go back to the old ways of fearing totalitarian rule.
I posit that Donald Trump, The President of the United States of America, will eventually reply to my Christmas letter from 1993 and finish Home Alone 3, but I degress.
Some of us write letters. This is one such letter to the public; I used to write letters to Bill Gates on an IBM PS2, if you know your stuff.
This is my final chart, at least for a while. I always say something like that when I post a grand prediction like this one.
I bid you all well, and hope you find fruitfulness in your future life endeavors.
BLUEDOG OUT

DowJones (DJI) IntraSwing Levels for 29th OCT 2025🚀 "Future Levels ( Ticker:MYM1! -CBOT )" mentioned in BOX format.
🌡️Plot Levels Using 3 Min, 5 Min Time frame in your Chart for Better Analysis
L#1: If the candle crossed & stays above the “Buy Gen”, it is treated / considered as Bullish bias.
L#2: Possibility / Probability of REVERSAL near RLB#1 & UBTgt
L#3: If the candle stays above “Sell Gen” but below “Buy Gen”, it is treated / considered as Sidewise. Aggressive Traders can take Long position near “Sell Gen” either retesting or crossed from Below & vice-versa i.e. can take Short position near “Buy Gen” either retesting or crossed downward from Above.
L#4: If the candle crossed & stays below the “Sell Gen”, it is treated / considered a Bearish bias.
L#5: Possibility / Probability of REVERSAL near RLS#1 & USTgt
HZB (Buy side) & HZS (Sell side) => Hurdle Zone,
*** Specialty of “HZB#1, HZB#2 HZS#1 & HZS#2” is Sidewise (behaviour in Nature)
Rest Plotted and Mentioned on Chart
Color code Used:
Green =. Positive bias.
Red =. Negative bias.
RED in Between Green means Trend Finder / Momentum Change
/ CYCLE Change and Vice Versa.
Notice One thing: HOW LEVELS are Working.
Use any Momentum Indicator / Oscillator or as you "USED to" to Take entry.
⚠️ DISCLAIMER:
The information, views, and ideas shared here are purely for educational and informational purposes only. They are not intended as investment advice or a recommendation to buy, sell, or hold any financial instruments. I am not a SEBI-registered financial adviser.
Trading and investing in the stock market involves risk, and you should do your own research and analysis. You are solely responsible for any decisions made based on this research.
"As HARD EARNED MONEY IS YOUR's, So DECISION SHOULD HAVE TO BE YOUR's".
Do comment if Helpful .
In depth Analysis will be added later (If time Permits)

DowJones key support at 47260Key Support and Resistance Levels
Resistance Level 1: 48085
Resistance Level 2: 48255
Resistance Level 3: 48500
Support Level 1: 47260
Support Level 2: 47040
Support Level 3: 46880
This communication is for informational purposes only and should not be viewed as any form of recommendation as to a particular course of action or as investment advice. It is not intended as an offer or solicitation for the purchase or sale of any financial instrument or as an official confirmation of any transaction. Opinions, estimates and assumptions expressed herein are made as of the date of this communication and are subject to change without notice. This communication has been prepared based upon information, including market prices, data and other information, believed to be reliable; however, Trade Nation does not warrant its completeness or accuracy. All market prices and market data contained in or attached to this communication are indicative and subject to change without notice.

US30 Trade Set Up Oct 29 2025Overall im still bullish but if PDH gets swept first, i will look for internal 1m/5m IFVG/CISD to target SSL/London lows before looking for buys back up

DOW JONES 30 HIGH PROBABILITY SETUP SOON!!!🚨 DJ30 HIGH PROBABILITY SELL SETUP 🚨
* Here We Can See Clearly The Next Potential Moves For US30 Coming Hours/Days.
* Keep Your Eyes Close On Your Trading Positions.
* Happy PIP Hunting Traders.
FXKILLA.

Possibility of uptrend It is expected that the upward trend will continue and the index will advance to the specified resistance levels. Otherwise, a correction to the support area will be possible, and then a change in the trend scenario will be likely.

US30 ForecastThe Dow Jones Industrial Average Index is showing strong bullish momentum breaking above the ascending channel resistance. Price is holding above the 47,800 support zone and aiming toward the next key resistance near 48,400. The clear uptrend structure and breakout projection suggest further upside continuation, with buyers maintaining firm control.
"Thank you for your support! If you found this idea valuable or learned something new, please consider liking and leaving a comment. I’d really appreciate hearing your feedback and thoughts."
US30 Ready for shorts?Momentum on US30 is finally slowing. Character of price action is indicating short term shorts for a continuation of longs. Price is very overextended currently. I would have preferred a few pips in longs to major key level before sells, but current price action is hinting at shorts, and you do not want to miss it if that is the case. Waiting for my entry criteria to enter sells. Best of luck. Manage Risk!

DowJoned bullish breakout supported at 47260Key Support and Resistance Levels
Resistance Level 1: 48085
Resistance Level 2: 48255
Resistance Level 3: 48500
Support Level 1: 47260
Support Level 2: 47040
Support Level 3: 46880
This communication is for informational purposes only and should not be viewed as any form of recommendation as to a particular course of action or as investment advice. It is not intended as an offer or solicitation for the purchase or sale of any financial instrument or as an official confirmation of any transaction. Opinions, estimates and assumptions expressed herein are made as of the date of this communication and are subject to change without notice. This communication has been prepared based upon information, including market prices, data and other information, believed to be reliable; however, Trade Nation does not warrant its completeness or accuracy. All market prices and market data contained in or attached to this communication are indicative and subject to change without notice.

US30 Intraday Plan – Bullish Bias Above 47,700 - 28/10/2025US30 has been maintaining strong bullish structure with a series of higher highs and higher lows on the lower timeframes. After breaking through the 47,700 zone, price is now retesting that area — which may act as intraday support going into the U.S. session.
📊 Scenarios:
Bullish Scenario (Primary Bias)
Watch for a pullback into the 47,730–47,700 zone — this area may serve as a liquidity grab / confirmation zone before continuation.
If support holds, potential upside targets are:
TP1 → 47,850
TP2 → 47,950
TP3 → 48,000 (psychological level & round number target)
Bearish Scenario (Alternative)
If price rejects near 47,780 and fails to hold above 47,700, we could see a deeper retracement.
Downside targets in that case:
TP1 → 47,500
TP2 → 47,350–47,300
📈 Bias: Bullish above 47,700
📉 Invalidation: Sustained break below 47,600
This plan focuses on waiting for confirmation at key levels rather than chasing momentum. Watch the first 15–30 minutes after NY open for direction confirmation — expect volatility and potential fakeouts.

US30 Trade Set Up Oct 28Price is trading above PDH and made ATH so i will wait for a pullback into 1h FVG before looking for internal structure on the 1m-5m forming IFVG/CISD to take buys back up

DOWJONES Strong Gains Continue on Solid Earnings and Trade HopesUS30 – MARKET OVERVIEW | Strong Bullish Momentum Continues 🇺🇸
The Dow Jones continues to extend its strong gains, adding more than +400 points since yesterday, supported by optimism surrounding tariff developments and solid corporate earnings.
The index maintains a bullish structure, and as long as it trades above 47,570, the trend is expected to continue toward 48,220.
A short-term retest toward 47,570 would be considered normal within the ongoing bullish momentum.
However, a confirmed 15-minute candle close below 47,370 would shift sentiment to bearish, targeting 47,090 as the next key support.
Key Technical Levels
Pivot Line: 47,570
Resistance: 48,210 · 48,550
Support: 47,090 · 46,900
Outlook:
US30 remains bullish while above 47,570, targeting 48,220 and possibly higher.
Only a 15-minute close below 47,370 would signal a short-term correction toward 47,090.

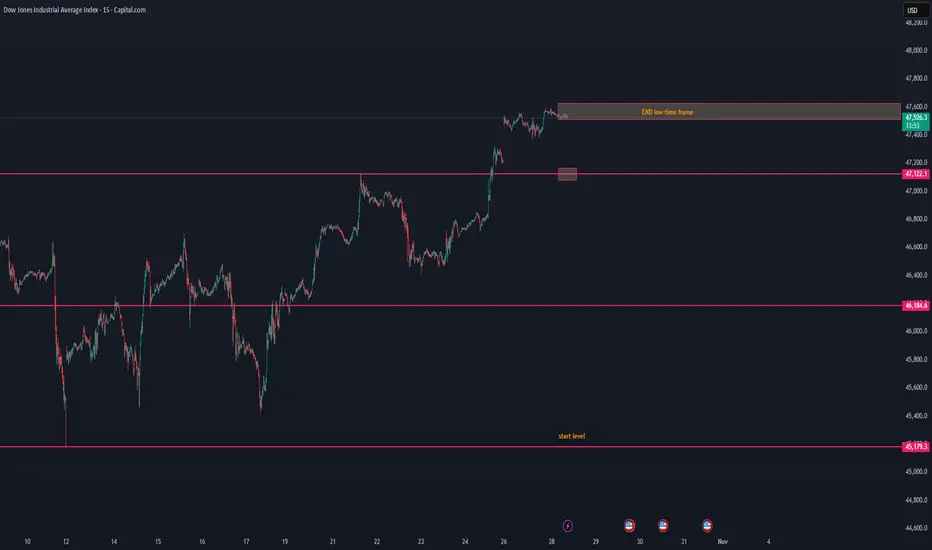
US30 lost its low time frame — possible breakdown aheadUS30 lost its low time frame — possible breakdown ahead ⚠️
US30 has lost its low time frame structure, showing early signs of weakness after the recent push to 47.5K.
The current price action suggests that momentum is fading, and sellers may start to take control.
📉 Short-term view:
Structure break below 47.5K zone confirms loss of bullish control.
The next visible support area sits around 47.1K, followed by 46.1K.
With time, price could continue to drift down toward the start level near 45.1K if buyers fail to defend.
📊 Observation:
Volume has started to cool off, and price is trading below the short-term EMA range — a typical setup before a gradual downward retrace.
💬 Summary:
US30 lost its low time frame momentum and looks to break down step by step toward the start level zone. We’ll monitor if buyers can react near 47.1K or if this becomes a broader correction phase.
US30 Looking bearish trend a short-term ForecastThe US30 index has retested its recent highs, and a short-term pullback appears likely as the new trading week begins.
Technically, price action suggests that after reaching the top once again, the index may retrace to recover lost ground. Local investors are closely watching the midweek release of September economic data, which will provide further insight into the Federal Reserve’s potential interest rate path. Market participants largely anticipate a rate cut later this week, which could inject renewed volatility into equities.
The market opened with a gap, indicating possible short-term indecision If the gap is filled, a rejection from resistance could trigger a decline toward the support zone between 46,800 and 46,000 Sustained buying pressure above resistance would invalidate the bearish setup and could signal further upside momentum.
You may find more details in the chart.
Trade wisely best of Luck buddies.
Ps; Support with like and comments for better analysis Thanks for Supporting.

US30 H4 | Bearish ReversalDow Jones (US30) is reacting off the sell entry, which aligns with hte 161.8% Fibonacci extension and the 61.8% Fibonacci projection, and could drop from this level to the downside.
Sell entry is at 47,651.31, which lines up with the 161.8% Fibonacci extension and the 61.8% Fibonacci projection.
Stop loss is at 48,228.80, whic lines up with the 100% Fibonacci projection.
Take profit is at 46,892.33, which is an overlap support that lines u;p with hte 38.2% Fibonacci retracement.
Stratos Markets Limited (tradu.com ):
CFDs are complex instruments and come with a high risk of losing money rapidly due to leverage. 68% of retail investor accounts lose money when trading CFDs with this provider. You should consider whether you understand how CFDs work and whether you can afford to take the high risk of losing your money.
Stratos Europe Ltd (tradu.com ):
CFDs are complex instruments and come with a high risk of losing money rapidly due to leverage. 70% of retail investor accounts lose money when trading CFDs with this provider. You should consider whether you understand how CFDs work and whether you can afford to take the high risk of losing your money.

Dow Gains on Earnings Optimism and Shutdown Resolution Hopes.Fundamental approach:
- The Dow Jones index advanced this week, supported by strong corporate earnings optimism and hopes for a government shutdown resolution.
- Major earnings reports from technology companies may lead the gains, with IBM scheduled to report Q3 earnings on Wed, 22 Oct, with expectations for AI-driven growth. Additionally, 3M (MMM) is scheduled to report Q3 earnings on Tue, 21 Oct, before market open.
- Fed Governor Christopher Waller provided a dovish signal, noting inflation was "not a barrier to rate cuts."
- This sentiment pushed US Treasury yields lower, with the 10-year note falling below 4.00%, offering support to equities amid the data uncertainty.
- Investors also focused on the potential end to the federal government shutdown, which has created data blackouts for key economic releases, with National Economic Council Director Kevin Hassett indicating the shutdown could end this week.
Technical approach:
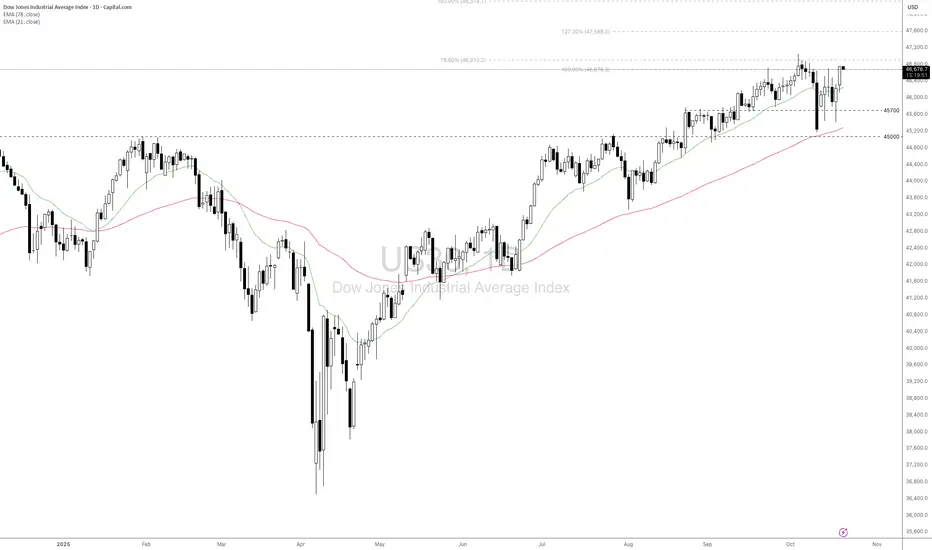
- US30 is testing the previous all-time high at around 47000. The index is above both EMAs, indicating a strong bullish movement.
- If US30 breaches above 47000, the index may advance to test 127.20% Fibonacci Extension at 47590.
- On the contrary, staying below EMA21 may prompt US30 to retest the support at 45700.
Analysis by: Dat Tong, Senior Financial Markets Strategist at Exness