Long therm Nixonian Gold TopExpansion and Rotation Top of Gold from 1980 at its peak, aligns with timing pivots and could be a strong possibility. Will be likely updated as it goes along. Real Estate top by 2028-'29 ?
Market insights

US30 Trade Secured 1500 Pipsperfect trade, sweeping London lows then IFVG on the 2m to target 1h FVG

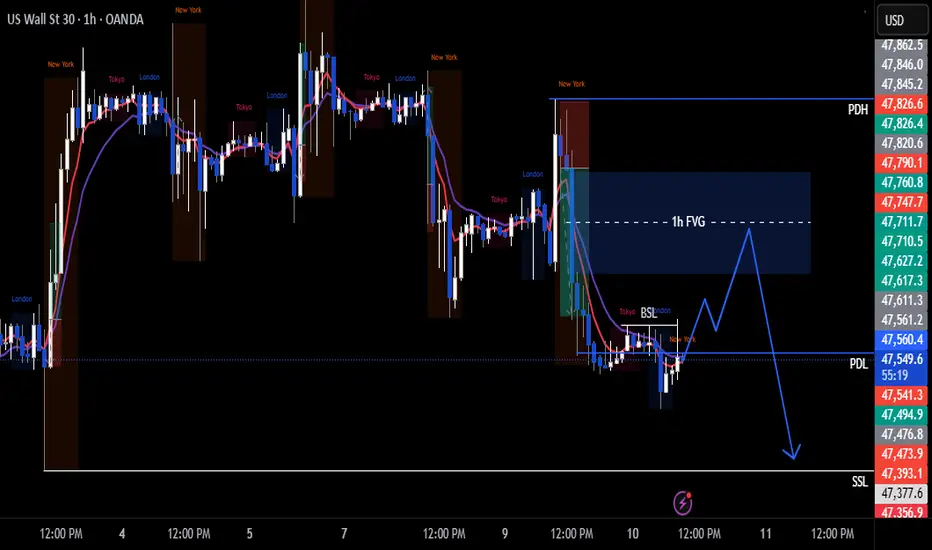
US30 Trade Set Up Dec 20 2025Price is overall bearish making LH/LL but has left a wide 1h FVG i will expect price to fill before continuing its bearish trend to lower SSL
GET READY FOR DOW30 HIGH PROBABILITY BUY SETUP SOON!!!🚨US30 HIGH PROBABILITY BUY SETUP 🚨
* Here We Can See Clearly The Next Potential Moves For DJ30 Coming Hours/Days.
* Keep Your Eyes Close On Your Trading Positions.
* Happy PIP Hunting Traders.
FXKILLA.

$DJIPrices are elevated, and buyers may not be willing to keep absorbing at these high levels.
To attract fresh liquidity, the market might need to pull back or offer cheaper entry points, otherwise sellers could step in to rebalance the price.
This type of setup usually means volatility is coming as the market searches for fair value.

Going Long on US30I'm waiting for the price to come to my entry, but I will wait for price action for confirmation.

I'm going long on US30I'm waiting for the price to come to my entry, and wait for confirmation. That means price action.

US30 WatchFor those who see this I am a London/NY session intraday trader. So currently I'm watching Us30 I like to wait for a move and a obvious pull back and then continuation. I try not to have a predetermined bias because US30 tends go anywhere at anytime more times than it's not, it's more in my favor to react than to predict. Since 5AM its touched one of my quarter levels. I'm looking for some sort of higher time frame retracement and then looking for entries.
I try to keep my strategy simple. My charts are simple. I follow my own version of price action, which I'll look to explain as I continue to post my charts throughout the week. As of right now this is what I see and I'm still waiting.

US30 Trade Set Up Dec 9 2025Price remains bearish making LH/LL on the 1h so i will wait for a reaction from London lows being swept before looking for internal 1m-5m internal bearish structure to continue lower to demand and SSL

DowJones Key support at 47530 Key Support and Resistance Levels
Resistance Level 1: 48132
Resistance Level 2: 48276
Resistance Level 3: 48420
Support Level 1: 47530
Support Level 2: 47366
Support Level 3: 47185
This communication is for informational purposes only and should not be viewed as any form of recommendation as to a particular course of action or as investment advice. It is not intended as an offer or solicitation for the purchase or sale of any financial instrument or as an official confirmation of any transaction. Opinions, estimates and assumptions expressed herein are made as of the date of this communication and are subject to change without notice. This communication has been prepared based upon information, including market prices, data and other information, believed to be reliable; however, Trade Nation does not warrant its completeness or accuracy. All market prices and market data contained in or attached to this communication are indicative and subject to change without notice.

DJ30_Sell Analyses4h swing is Bearish and Price is in Premium gives Bearish Choch
15m swing is Bullish but
15m internal POI is align with 4h
may get some shorts opportunity a after 15m fractal Choch

US30 SellsWe're on track folks! I'm on a prop firm you can check the link. I use Tradingview as a POV and I place trades on TradeLocker! Target hit my first TP as we speak!
Potential area for longsJust a potential area to expect longs. Wait for price to retrace to that area and buy with confirmation

Massive WALL STREET Short At All Time High Price is testing the all time high while a head and shoulders formation is visible on the Daily, indicating potential distribution at resistance
On H4, momentum is overbought and price has remained range bound for approximately four sessions, signaling reduced follow through on the upside
Sentiment appears fragile amid discussion of an AI driven excess, and risk appetite is moderating into strength
Harmonic confluence is present, with a deep crab on H1 and a crab on H4 aligning near current levels to define a potential reversal zone
Multi-timeframe momentum is stretched up to H4; bearish RSI divergence is present on H1 and H4, with H4 showing roughly a 15-point divergence while price holds flat
Repeated failures at the all-time high confirm supply; this level continues to cap advances and strengthens the resistance profile
The H1 trend has transitioned from flat to lower, shifting near-term bias to the downside within the broader range
Cross-market context is consistent, as major US indices are also near record highs and failing to extend, which adds intermarket confirmation
Risk parameters are defined with a stop above 48,250 or above the all-time high at 48,425, which would invalidate the reversal thesis
Initial downside objective is 47,300, corresponding to the next significant support and consistent with an H4 scale pullback
Position management should consider partial profit taking at interim supports and a reduction in risk if RSI resets higher without corresponding price weakness

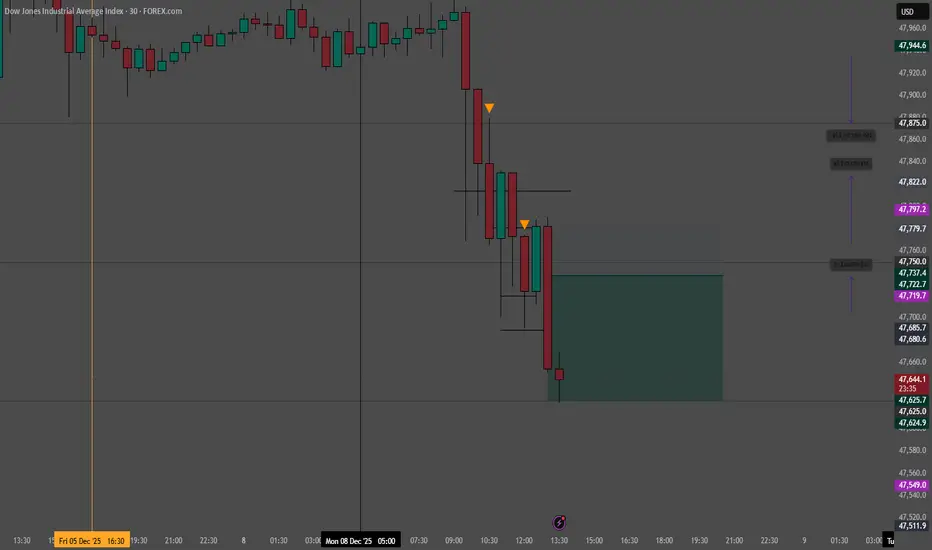
US30 Trade Set Up Dec 8 2025Price is currently in a 1h range so first i want to see either a sweep of SSL/Asia and London lows to then look for 1m-5m IFVG/CISD to target BSL and supply

US30 Long
I'm watching a potential buy opportunity on US30. The supply zone looks like it's failing to hold, so my bias is shifting toward a long position.

US30 15M Analysis Market structure is currently bullish. I would only be interested in shorts if price closes strong below the 15M swing low. I will be monitoring lower time frame price action for confirmation if price sweeps the liquidity or tags the demand.
Trade Safe -Remzy

Can the Dow Jones Continue Its Bullish Momentum This Week?🚀 US30/DJI Dow Jones - Bullish Pullback Opportunity 📈
Professional Market Blueprint | Swing Trade Setup
📊 TRADE OVERVIEW
Asset: US30/DJI - Dow Jones Industrial Average Index
Timeframe: Swing Trade (4H-Daily)
Bias: 🟢 BULLISH - Hull MA Pullback Strategy
Confirmation: Heikin Ashi Reversal Candle Pattern
🎯 ENTRY STRATEGY - "LAYERING METHOD" 🎯
Approach: Multiple limit orders (Professional Risk Distribution)
Layer Entry Points:
Layer 1: 46,600 🔵
Layer 2: 46,800 🔵
Layer 3: 47,000 🔵
Layer 4: 47,200 🔵
💡 Tip: Adjust additional layers based on your risk tolerance and account size
🛑 RISK MANAGEMENT
Stop Loss: 46,400
⚠️ DISCLAIMER: This is a reference level only. You manage your own risk. Adjust SL according to your strategy and risk profile.
Take Profit Target: 48,800
📌 Rationale: Moving Average resistance + Overbought zone + Trap detection
⚠️ DISCLAIMER: This is a reference level only. You manage your own risk. Take profits at your own discretion.
📈 TECHNICAL CONFLUENCE
✅ Hull Moving Average - Bullish alignment & pullback structure
✅ Heikin Ashi Reversal - Confirmation candle pattern at entry zones
✅ Moving Average Resistance - Strong rejection level near TP
✅ Overbought Divergence - Potential trap for trap traders
✅ Risk/Reward Ratio - Favorable 1:3+ setup potential
🔗 RELATED PAIRS TO WATCH - CORRELATION ANALYSIS
📍 AMEX:SPY - S&P 500 ETF (Positive Correlation - 0.92)
US30 follows broad market sentiment. SPY strength = DJI bullish momentum.
📍 NASDAQ:QQQ - Nasdaq-100 ETF (Positive Correlation - 0.85)
Tech sector performance impacts overall market. Monitor for divergence signals.
📍 AMEX:IWM - Russell 2000 (Small Cap) (Positive Correlation - 0.88)
Small-cap rotations precede index moves. Early trend confirmation signal.
📍 AMEX:GLD - Gold Spot Price (Inverse Correlation - -0.45)
Risk-on sentiment (bullish DJI) = weaker gold. Inverse hedge setup.
📍 TVC:VIX - Volatility Index (Inverse Correlation - -0.70)
Rising VIX = market fear = DJI pullback risk. Monitor at entry zones.
📍 TVC:US10Y Yield (Negative Correlation - -0.55)
Rising yields pressure equities. Check yield strength before entries.
📍 TVC:DXY - US Dollar Index (Weak Negative - -0.30)
Stronger dollar = export headwinds. Minor impact, secondary indicator.
⚡ KEY TRADING RULES
🔴 BEFORE ENTRY:
Confirm Hull MA slope is positive
Wait for Heikin Ashi reversal candle close
Check VIX & SPY alignment
Ensure no major economic events
🟢 AT ENTRY:
Use layering strategy (don't chase)
Build position gradually across 4 layers
Scale risk based on account size
Document entry price & time
🟡 DURING TRADE:
Trail stop loss after +1% profit
Monitor related pairs for divergence
Close 50% at +2% for risk-free trade
Let remainder run to target
🔵 EXIT PLAN:
Target: 48,800 (reference level)
Or: Exit on Heikin Ashi reversal signal
Or: Close on MA resistance rejection
Never hold into major news events

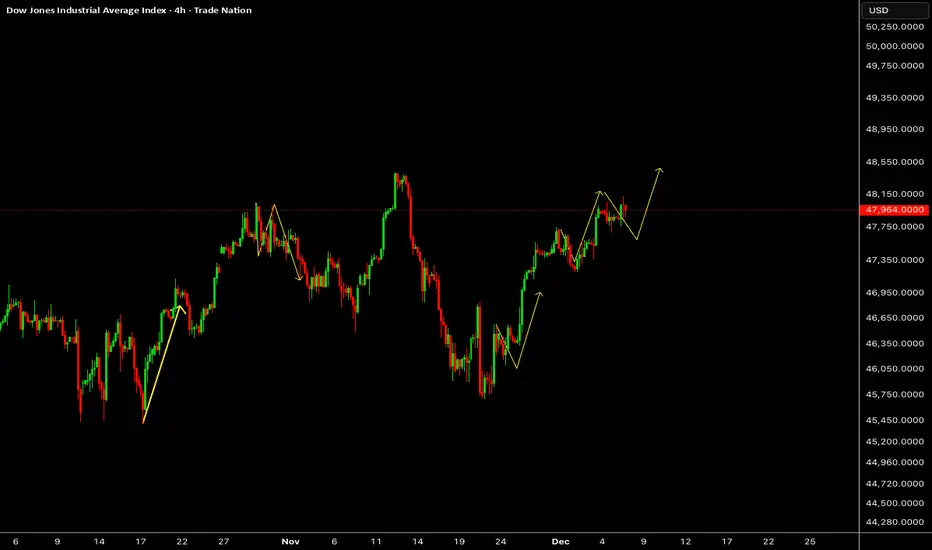
US30: What’s Forming?US30 has extended its upward move, but the latest slowdown suggests a developing consolidation phase rather than a completed trend. The structure is shaping into a potential corrective pattern, indicating that the market may still be preparing for another push once this pause finalizes. With momentum moderating, the next decisive move could unfold soon, making this an interesting setup to monitor closely.
**Disclosure:** We are part of Trade Nation's Influencer program and receive a monthly fee for using their TradingView charts in our analysis.
US30 Will Move Lower! Sell!
Here is our detailed technical review for US30.
Time Frame: 9h
Current Trend: Bearish
Sentiment: Overbought (based on 7-period RSI)
Forecast: Bearish
The market is trading around a solid horizontal structure 47,967.2.
The above observations make me that the market will inevitably achieve 46,950.2 level.
P.S
We determine oversold/overbought condition with RSI indicator.
When it drops below 30 - the market is considered to be oversold.
When it bounces above 70 - the market is considered to be overbought.
Like and subscribe and comment my ideas if you enjoy them!

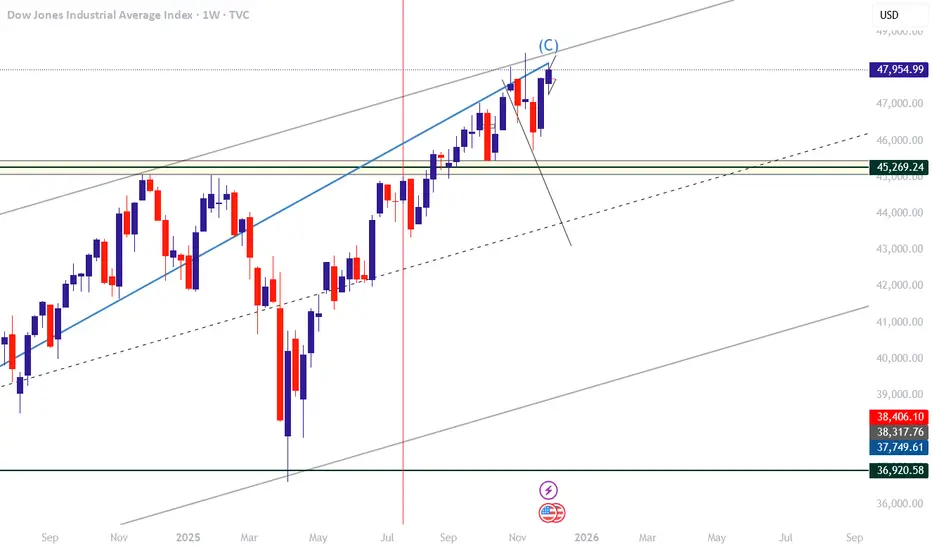
dji possible shortDow Jones appears to be completing a major corrective structure (A-B-C) and is currently testing the upper boundary of a long-term ascending channel.
The index has reached a confluence of technical exhaustion:
• Completion of wave C
• Touching the channel’s upper resistance
• Repeating the timing cycle of “impulse → correction → impulse”
• Similar time symmetry conditions seen at previous cycle tops
This alignment suggests that the current bullish cycle may be nearing its end, with the market entering a potential distribution zone.
From here, the probability of a medium-term correction — or even a deeper decline — increases significantly.
If price fails to break convincingly above the channel, the market may begin a larger bearish phase offering potential short opportunities.
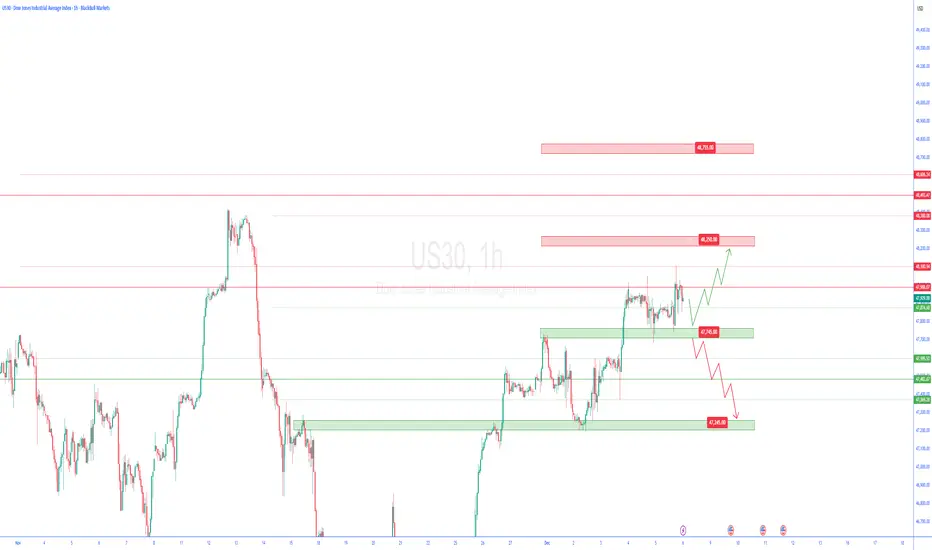
us30 1h🔹 Overall Outlook and Potential Price Movements
In the charts above, we have outlined the overall outlook and possible price movement paths.
As shown, each analysis highlights a key support or resistance zone near the current market price. The market’s reaction to these zones — whether a breakout or rejection — will likely determine the next direction of the price toward the specified levels.
⚠️ Important Note:
The purpose of these trading perspectives is to identify key upcoming price levels and assess potential market reactions. The provided analyses are not trading signals in any way.
✅ Recommendation for Use:
To make effective use of these analyses, it is advised to manually draw the marked zones on your chart. Then, on the 5-minute time frame, monitor the candlestick behavior and look for valid entry triggers before making any trading decisions.