10 Year T-Note Futures Hello Friends - welcome to another analysis
------
As we see that the ZN1 market is in a downward trend then we notice a larger green volume with the wick candle low
it is the start of an impulse that means that the market will increase
so you can buy ZN1 stocks and earn money
and as I always say " you should not trade at any time you have to trade at the right time possible "
Thank you
Trade ideas

10Y T NOTE FUTURES (ZN1!) SwingWe have a Sell Signal
Stop loss and Take profit Mentioned on the chart

10 YEAR T-NOTE FUTURE - the market will go down Hello Friends - thank you for your support with like and comment .
-------------
So, as you can see in the graph the market was in a more or less stable situation = trending rang
after we see a high volume at the bottom followed by a low wick candle this means that the start of an impulse and that the seller attacks the buyer , so therefore the market will go down
=> and as I always say " you should not trade at any time you have to trade at the right time possible "
Thank you

10Y T NOTE FUTURES (ZN1!) SwingThe market will keep going down.
Stop-loss and Take profit Mentioned on the chart.


ZN1! 10 YEAR T-NOTE FUTURESZN1! 10 YEAR T-NOTE FUTURES .
A GOOD SIGNAL TO SELL THE MARKET WILL GO DOWN BY 95% .
DO NOT FORGET TO FOLLOW ME TO BRING YOU ALL NEW.
LIKE FOLLOW THANKS YOU

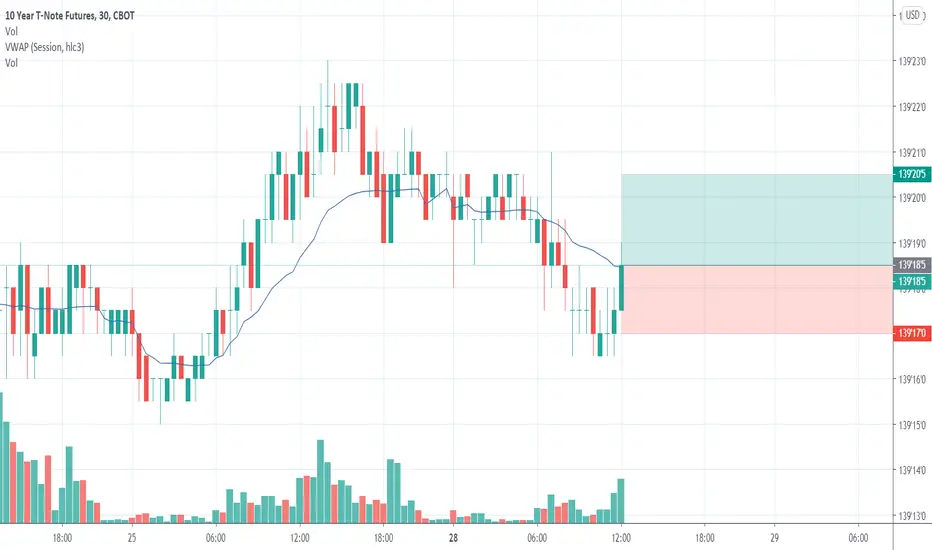
10Y T NOTE FUTURES (ZN1!) SwingWe have a Buy Signal
Risk/Reward Ratio: 1.14
Take profit: 139'26'0
Stop loss: 139'18'5


10Y T NOTE FUTURES (ZN1!) SwingThe market may keep going down and achieve our target
Probability: 65%
Take profit and Stop loss Mentioned on the chart


10Y T NOTE FUTURES (ZN1!) Swingthe market may keep going up
Stop loss and Take profit in the Chart with a Ratio Risk/reward=1.33
Good opportunity

time tp get some ticks from the ZN treasuryWe see a break for the trading range before going up
nice manipulation from the trading algos and big institution ....
algo trades you're too fast but don't forget that we created
you can't hide your path :))


10 yIf you belive -ve rates are a thing then this trade is not for you. If rates have hit all-time lows then this Wyckoff topping pattern on the 10 year T-note weekly chart makes fundamental sense. Technically it has a lot of work to do to the downside to confirm. Typically Wyckoff tops with Upthrust after distribution (UTAD) resolve swiftly to the downside. Noting that the holding costs are significant for large trade size.

10Y T NOTE FUTURES (ZN1!) SwingRATIO Risk/Reward : 1.5 with a probability equal: 65%
We have a Buy Signal
SL and TP on the Chart


10Y T NOTE FUTURES (ZN1!) 30MINWe have a Buy Signal
Take Profit and Stop Loss Mentioned On The Chart in my Prediction


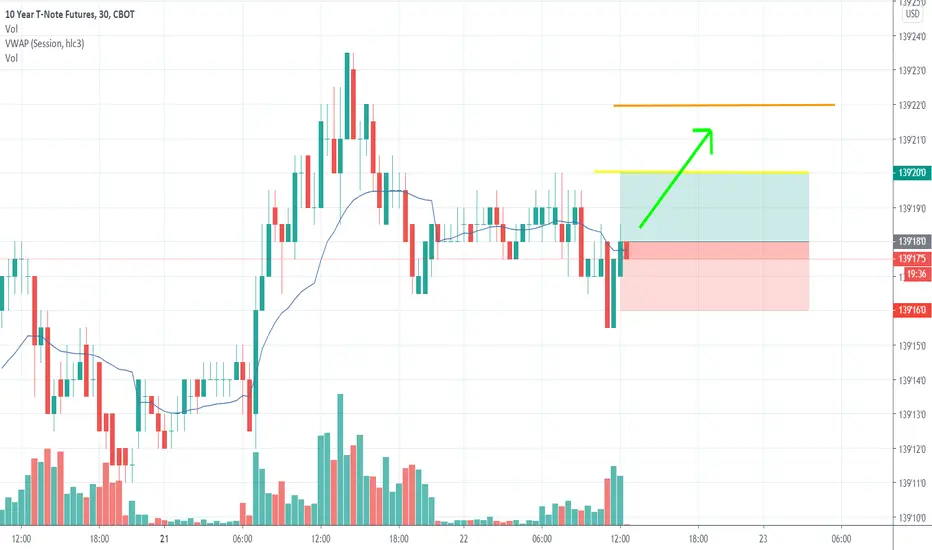
BUY 10 YEAR T-NOTE FUTURES AT 139'18'0I recommended to buy ZN1 Future
My target is 139'22'0
Good Luck Champions !!!

10Y T NOTE FUTURES (ZN1!) SwingProbability: 65%
We have a Buy Signal
Take Profit and Stop Loss Mentioned On The Chart in my Prediction
If we achieve our TP, and the green candle cut with force the yellow line , then use it as a support and the Orange line as a Resistance and our second Target TP2