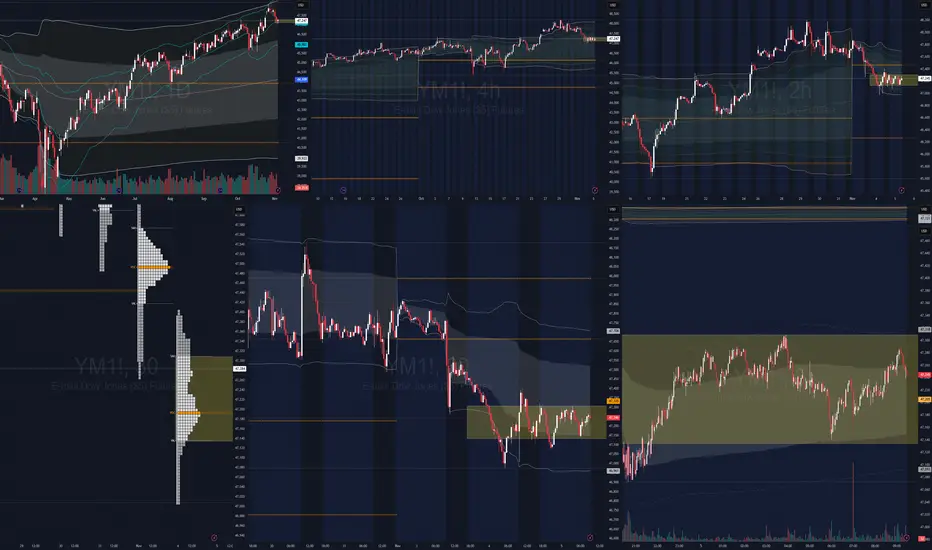
YM (Dow), Short idea (30-minute+3-minute TF)See the bottom two charts for the red bear zone I have for today. While it's entirely possible (due to TFs above 30 minutes) for the market travel up past this bear zone, it's a great risk/reward opportunity to take a shot short this morning.
Look for an interaction with the red zone, and momentum
About E-mini Dow Jones ($5) Futures
E-mini Dow Jones ($5) futures are derivative contracts with the Dow Jones Industrial Average (DJIA) Index as an underlying asset. These mini futures are electronically traded and give investors exposure to the US stock market through 30 US blue-chip companies, but they represent only a portion ($5) of standard Dow Jones futures, which makes them more accessible. Since these are still futures, traders use them to hedge their stock portfolios against risks that are inevitable in markets.
Related futures

dow futureswait for liquidity area to be swept then go long to target area. trade is void if target area hit before it has swept liquidity.

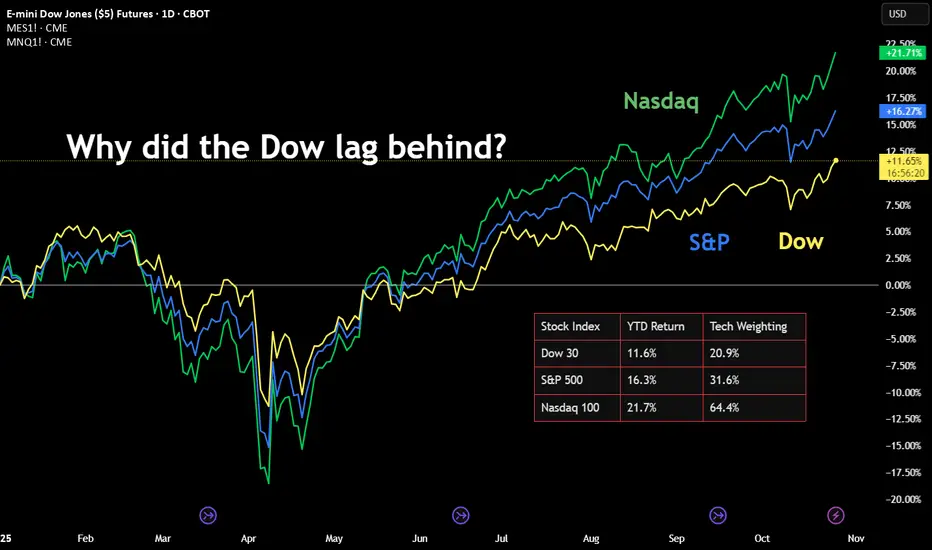
US Stock Indexes Broke New RecordsCBOT: Micro E-Mini Dow Jones Futures ( CBOT_MINI:MYM1! )
After a 9-day delay due to the U.S. government shutdown, the Bureau of Labor Statistics (BLS) released the September CPI data on October 24th. Here are the highlights:
• The Consumer Price Index for All Urban Consumers (CPI-U) increased 0.3%
$YM | Premarket Prep and Analysis | Higher Timeframe LISWalks through plans today for YM traders. Primary focus on shorts, but our clear line in the sand allows us to be flexible based on interaction with our levels.

$YM | Mean reversion scalper's delightHeading into the open, we're still inside TPO prior value (see yellow area). Scalpers may be able to fade (short) from the top of VAH - particularly after a stop run of prior swing high.
If you're bullish, either wait for a breakout of the yellow area and pullback or wait to fade from the lower par
Dow Jones Intra-day IdeaDJ after fridays consolidation and sweeping liquidity of Current Week and mittigating 4H demand. Doing "V" shape reaction and creating 15min Demand that makes our POI for this Intra-day idea.
My stoploss will be under 15min Demand and TP1+BE point will be at 1:2RR.
T2 will be on 15min supply (Only

Long Trade Limit Order 47,859 Stop 47,709 Target 48,259I am placing an order for OCO at 47,859.
Stop loss 150 ticks at 47,709
Target 400 ticks at 48,259
Thesis is pullback to the 50% mark and targeting the 0.5 range expansion

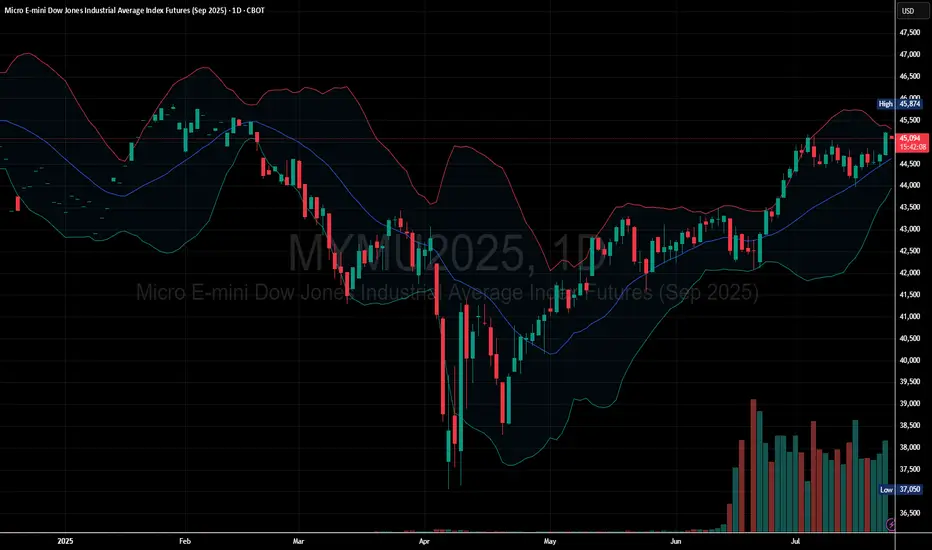
Buyers Dominate as Dow Micro Futures Push Higher
Price Above Moving Average: The current price is trading above the midline of the Bollinger Bands, showing bullish momentum.
Bands Expanding Upward: The Bollinger Bands are sloping upward, indicating increasing volatility in the direction of the trend.
Price near Upper Band: Price is near or hug
FOMC Higher High Bull Trend Still In Progress Return to 43k SoonAnalyzing the long-term view of Dow Jones using my FOMC levels I have come to a conclusion that the bull move higher that started in April, is still in progress. I will explain my reasonings below why I am expecting a return to 43,000 as the next Major low.
I firmly believe that the June FOMC of 20

Live Day Trading Losing $1097Failed breakout to the upside.
Revenge traded by reentering several times.
Could of avoided if I quickly set my stop-loss at breakeven.
CBOT_MINI:YM1!

See all ideas
Summarizing what the indicators are suggesting.
Neutral
SellBuy
Strong sellStrong buy
Strong sellSellNeutralBuyStrong buy
Neutral
SellBuy
Strong sellStrong buy
Strong sellSellNeutralBuyStrong buy
Neutral
SellBuy
Strong sellStrong buy
Strong sellSellNeutralBuyStrong buy
A representation of what an asset is worth today and what the market thinks it will be worth in the future.
Displays a symbol's price movements over previous years to identify recurring trends.
Frequently Asked Questions
The current price of E-mini Dow Jones ($5) Futures is 47,114 USD — it has risen 0.04% in the past 24 hours. Watch E-mini Dow Jones ($5) Futures price in more detail on the chart.
The volume of E-mini Dow Jones ($5) Futures is 9.30 K. Track more important stats on the E-mini Dow Jones ($5) Futures chart.
Open interest is the number of contracts held by traders in active positions — they're not closed or expired. For E-mini Dow Jones ($5) Futures this number is 84.97 K. You can use it to track a prevailing market trend and adjust your own strategy: declining open interest for E-mini Dow Jones ($5) Futures shows that traders are closing their positions, which means a weakening trend.
Buying or selling futures contracts depends on many factors: season, underlying commodity, your own trading strategy. So mostly it's up to you, but if you look for some certain calculations to take into account, you can study technical analysis for E-mini Dow Jones ($5) Futures. Today its technical rating is buy, but remember that market conditions change all the time, so it's always crucial to do your own research. See more of E-mini Dow Jones ($5) Futures technicals for a more comprehensive analysis.