YM 9/4 1hrMonthly timeframe Pink
Weekly = Grey
Daily = Red
4hr = Orange
1hr = Yellow
15min = Blue
5min = Green
4 candles, 6 Levels, & MarketMeta
Range = 2 or consecutive candles of the same color.
Distribution Range - When price is above a distribution range it will act as support. When price is below, the SwingLow will be the boundary/entrance/exit of the range.
Distribution ranges consist of the 1st candle called the BackSide and last candle called the Frontside. Each has expectations.
BackSide candle (BS): expectation=strong reaction to price, support price. Hold price above it. Mark this level with a horizontal ray tool on the topside wick or topside body.
FrontSide candle (FS)
expectation = support price until trend reversal. Protects the SwingLow, exit of range.
To mark this level, place the horizontal ray tool on the topside wick or topside body.
SwingLow = the bottom side wick of the FrontSide Candle. Boundary of the range.
The Accumulation Range - When price is BELOW an accumulation range then these levels will act as resistance to price.
Inverse Backside (Inv.BS)= the first candle in the accumulation range. Its marked on the bottom side wick or body of the candle.
Its usually next to a Frontside candle. Traders like to see Inverse BackSide candles engulf Frontside candles and create an impulsive Fair Value Gap.
These f.V.G's next to FrontSide levels have higher probability than those that don't have the engulfing, F.V.G..
the last candle in the accumulation range is the Inverse FrontSide (Inv.FS)
marking the topside wick with the horizontal ray tool is to mark the SwingHigh Level. Mark the bottom side wick or body to display the Inv.FS level.
YMZ2013 trade ideas


YM 9/4 4hrMonthly timeframe Pink
Weekly = Grey
Daily = Red
4hr = Orange
1hr = Yellow
15min = Blue
5min = Green

selling pressure or lack or buying pressure presents breakout ?* looking at this pattern and pivot points we see a reduction of power from buyers, unable to push the market higher, while sellers then are logically stronger.
* buyers are currently holding the price point in the purple line marked, but they are less able to defend it with every attempt to break
what do I think will happen next?
* a break of the purple line and
a push downward by sellers seems likely simply by looking at the narrative shown by price.
* we have hidden bear divergence and we have a break of obv uprend showing sellers power increasing

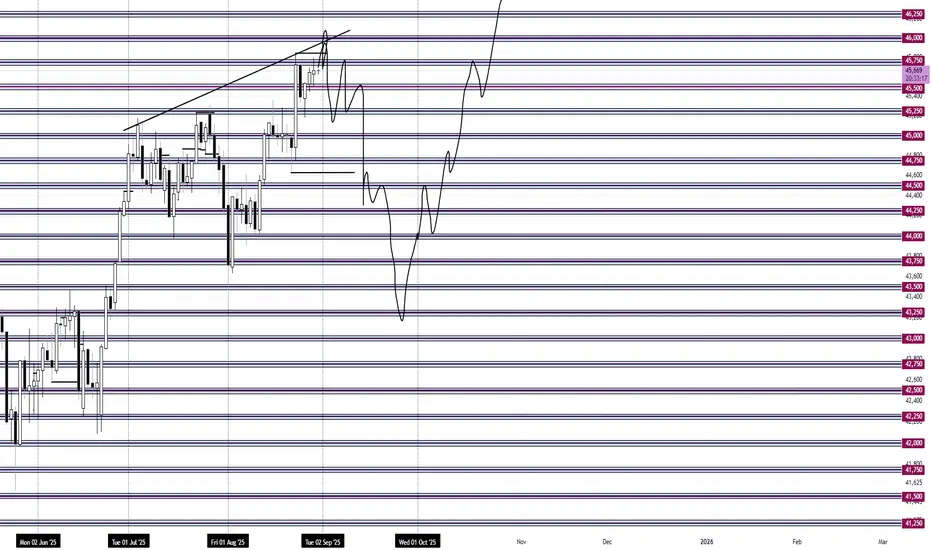
September Gameplan Down Month To Sweep Lows B/O ATHsSeptember I am going to look for bearish trades in line with these three peak wedge formations.
I am looking for 46,000 to possibly be the high of month
What I am seeing is a build up before the break out of all time highs. I believe the market will make one more dip down to the 43,000 area before the breakout.
The biggest clue was August 22nd's exhaustion bar.
Another huge clue is the start of September is a holiday at the top of the wedge and the start of a new month. New Month, New Timing Cycle.
How I will be playing September:
I will limit myself up to only 10 trades
One trade per Daily Candle when Initiating a trade
120 tick stops
480 tick targets
4 to 1
Hold overnight until stop or target is hit
Aim for a 40% win rate
4 wins 4*4=16
6 losses 6*1=-6
Net +10R
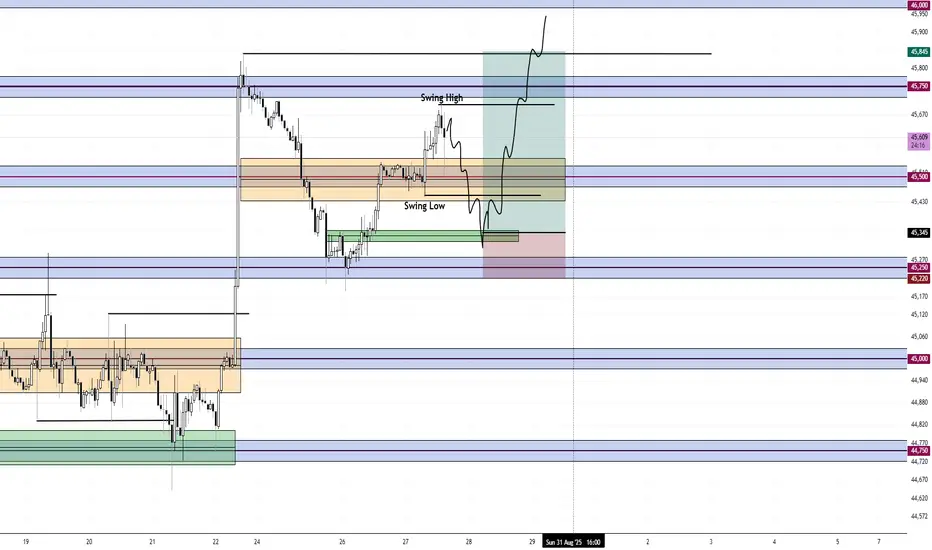
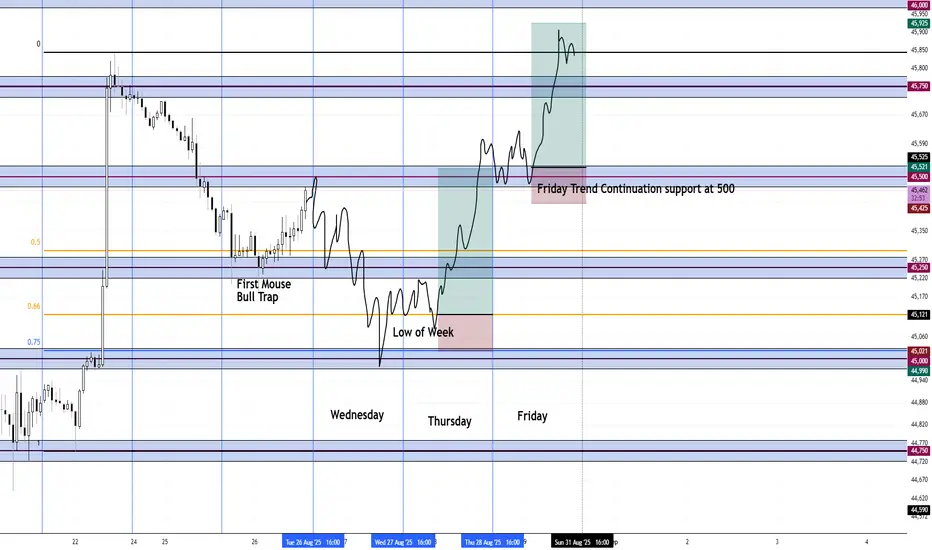
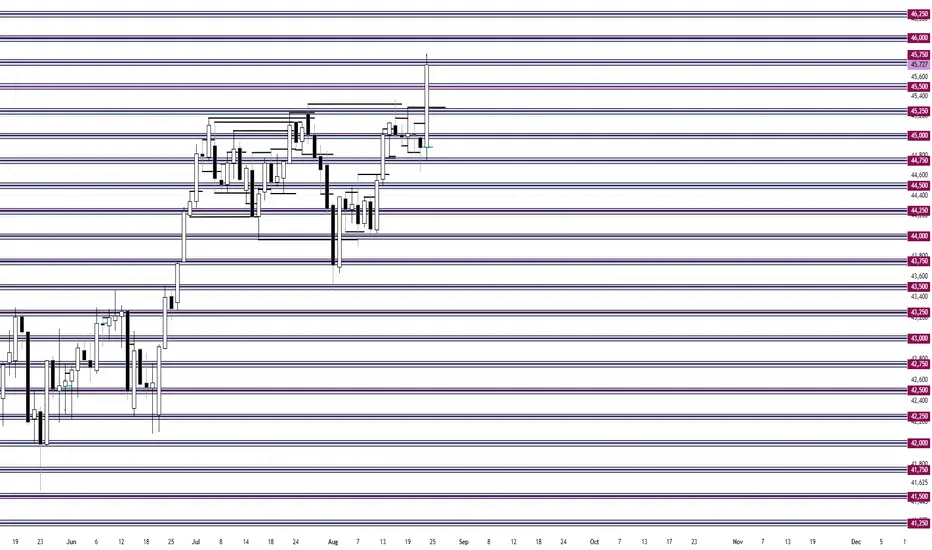
Mean Reversion Support at 250. Long 4 to 1Price is mean reverting around 500, this much is plain obvious. I will look for a support entry near 250 area.
125 tick stop
500 tick target
4 to 1 Risk Reward
The orange box is the middle of the range. I.E. the slaughterhouse.
Swing highs and lows formed near the middle get taken
I am expecting the break of the highs and for price to hit 46,000
Pullback into 45,000 Long 3 bars down plus gaps
I am looking for a pullback into the 75% retracement area that also coincides with 45,000. Round numbers being double zeros.
I am expecting Wednesday to also be a down day.
The trade Long, I am expecting it to be on Thursday with Friday being another Long continuation day to finish the month out strong.
These are my two trade Ideas for both 4 to 1 opportunities.
Thursday low of week
Friday trend continuation
I am looking for the following price action circled in green to be the order flow needed to fuel the move back up. Creep lower into 45,000 getting shorts chasing down low for the reversal.
Big moves take time to setup and so I will be waiting.
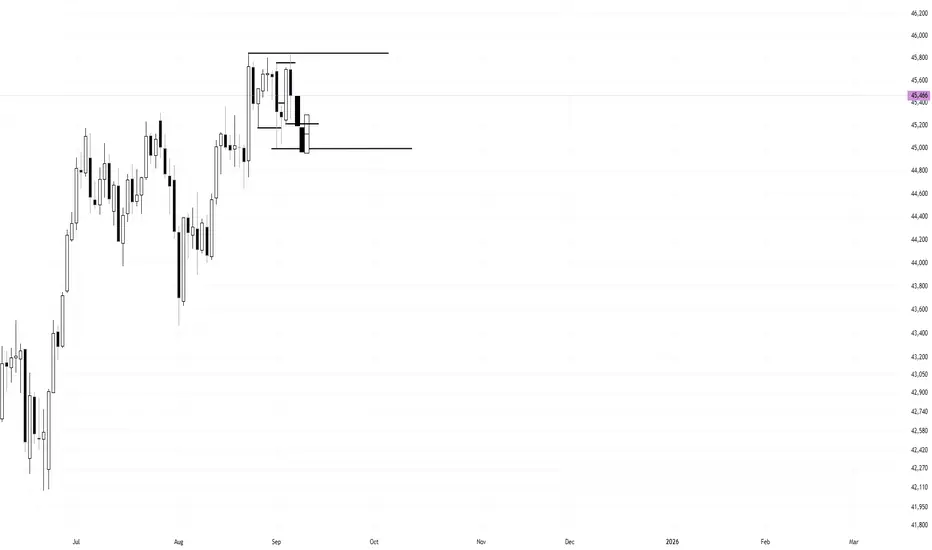
Market In Range. Low of Week Buying Using the Daily timeframe signals, price is in a range. Nothing is setup yet. I will wait for Monday to close down. I want to see a bearish closing day down near the lows for the Low of Week reversal.
This is what I am waiting for and will have to see IF price will setup this way.
1. Creeping trend into the low
2. Daily closing bar into the low
If trade triggered, trade management will be 120 tick stop, 480 tick target for a 4 to 1.
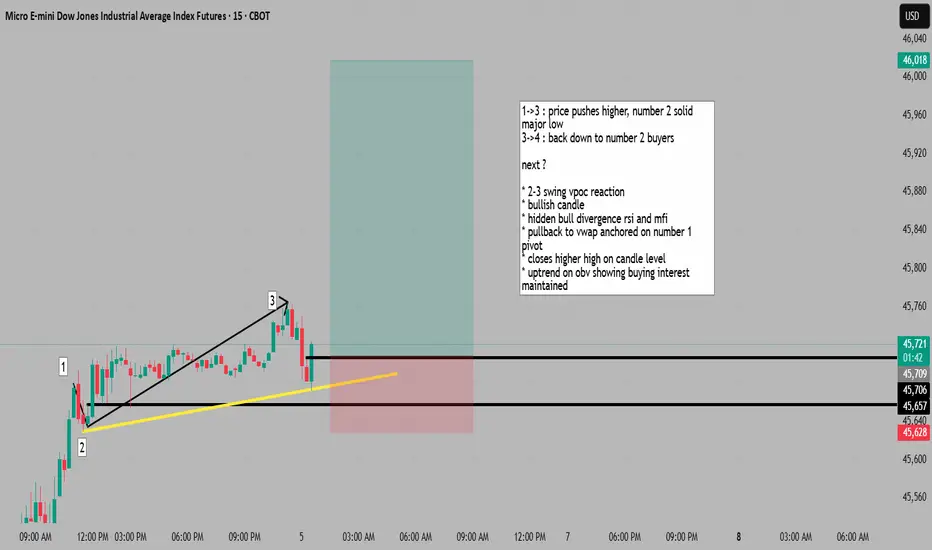
return to support with multiple confluence in uptrend idea1->3 : price pushes higher, number 2 solid major low
3->4 : back down to number 2 buyers
next ?
* 2-3 swing vpoc reaction
* bullish candle
* hidden bull divergence rsi and mfi
* pullback to vwap anchored on number 1 pivot
* closes higher high on candle level
* uptrend on obv showing buying interest maintained
long dow futrures tradeactive trading on dow futures. 150 pips collected. long from blue weeklyn levels. winning trade

current dow futures trade bull caseWe are lock in a futures trade with the us30 in a bull scenario for the day. we are hoping the day is strong leading into a 2 day trend long to end the week from current week lows. we could see a further down candle to retest so stos are below the current peak lows. Lets go Bulls

ontrend return to solid sellers provides logical sell1->4 : number 3 solid sellers
4->5 : return to proven sellers
next?
*bearish divergence rsi and mfi
* ontrend
* reverse pitchfork touch

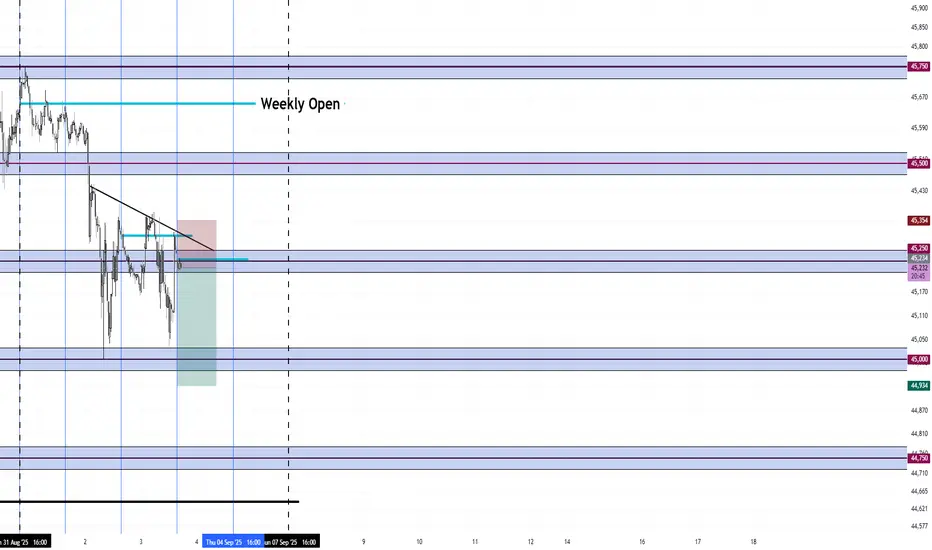
Bearish Weekly Trending Cycle To me, this week is looking like a weekly candle that is going to be a bearish trending cycle.
Sunday, Monday formed the high of the week and immediately sold off. Tuesday and Wednesday was mean reverting around 250 forming a falling wedge consolidation for Thursday/Friday to continue the bearish trend.
I am currently short inside the consolidation.
To me, this wedge consolidation is the middle pause in the trend week and it seems like the goal is to take out August's level.
If bearish trending cycle, then Non Farm Payrolls will be bearish and sell off, closing near the lows.
I am only going for a 2.5 risk to reward. I have been burned too many times swinging for the fences holding on to big trades only to lose money. My system is 2.5 to 1.
Another clue is the consecutive lower openings each day. Sunday opened at the extreme high at 650. Wednesday opened at 320 and now Thursday opened at 250
ym Septemberjust some quick levels monthly timeframes in pink
daily in red
4hr timeframe in orange
1hr in yellow

downtrend resumption opportunity presents itself * price returns to vwap and previous support, which might be support turned resistance
* what do I think will happen next ?
* if it pulls back from the vwap which price does like to do alot and pushes below the micro downtrend, we could see a continuation to the downside from here
* vpoc behind us if price pushes below
with those orders then being sell orders
logically

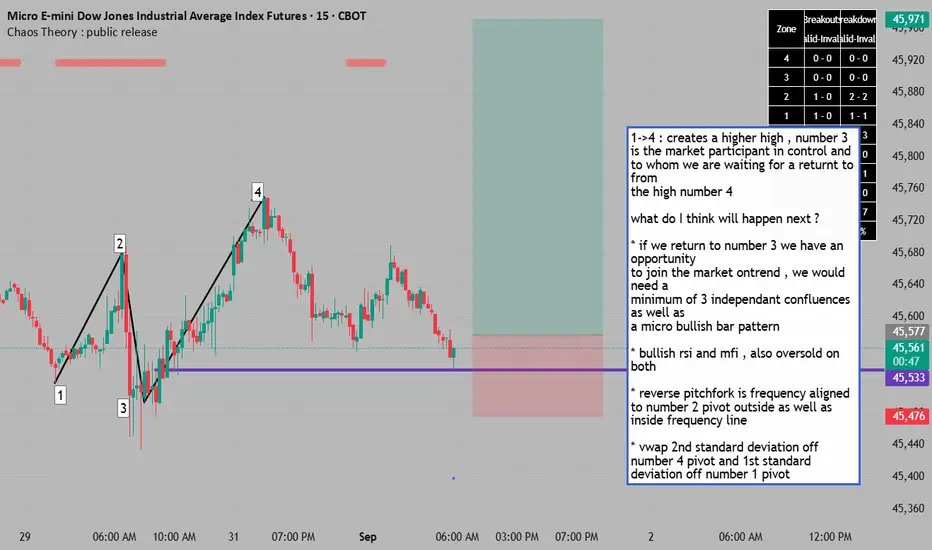
return to major buyers presents an on trend continuation entry1->4 : creates a higher high , number 3
is the market participant in control and
to whom we are waiting for a returnt to from
the high number 4
what do I think will happen next ?
* if we return to number 3 we have an opportunity
to join the market ontrend , we would need a
minimum of 3 independant confluences as well as
a micro bullish bar pattern
* bullish rsi and mfi , also oversold on both
* reverse pitchfork is frequency aligned to number 2 pivot outside as well as inside frequency line
* vwap 2nd standard deviation off number 4 pivot and 1st standard deviation off number 1 pivot
DOW JONES-MARKET PREDICTION-Sept 1st-LONGSThe month of August created a new high, looking for Sept to continue the Trend, a new resistance level may be created and the market trades to the sellside.

US30/Dow Jones Dow Jones (US30) showing signs of exhaustion. Defensive sectors can’t hold the weight of rising yields, softening industrials, and fading consumer strength. Lower highs + weak momentum = cracks forming. This isn’t just noise — it’s a warning.

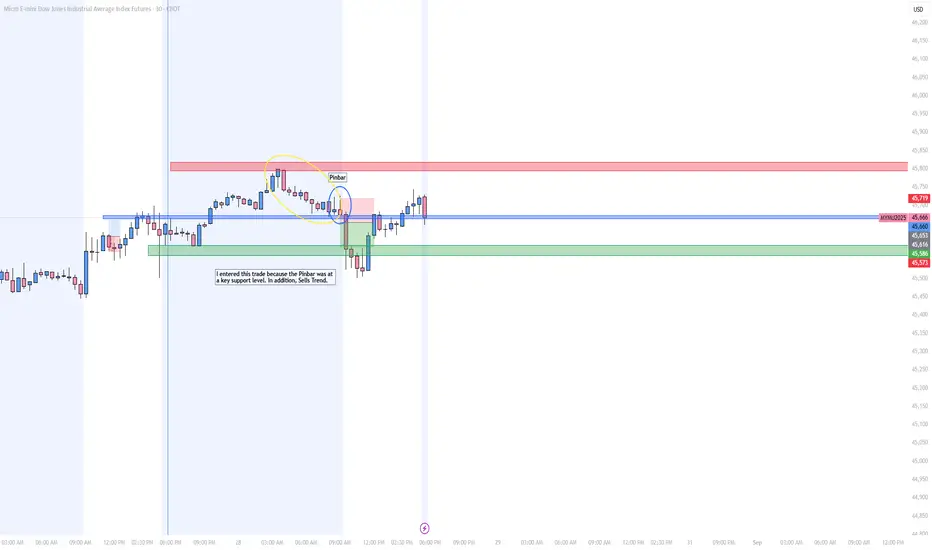
08/28 Sell How to Use Pin Bars.Well as you can see the trend was bearish so
I was looking for sells. In addition, the pin bar formed at a key level and I entered after it broke the support level.
1. Variation: Yellow ( Trend): The trend is bearish so look for sells
2. Wick Rejecting the Upside: Pin Bar in Blue. I needed this wick to put my SL and confirm the upside is being rejected
3. I entered after it broke with a lot of power.
Key Notes: Pay attention to demand and supply levels and specific set ups in those areas.
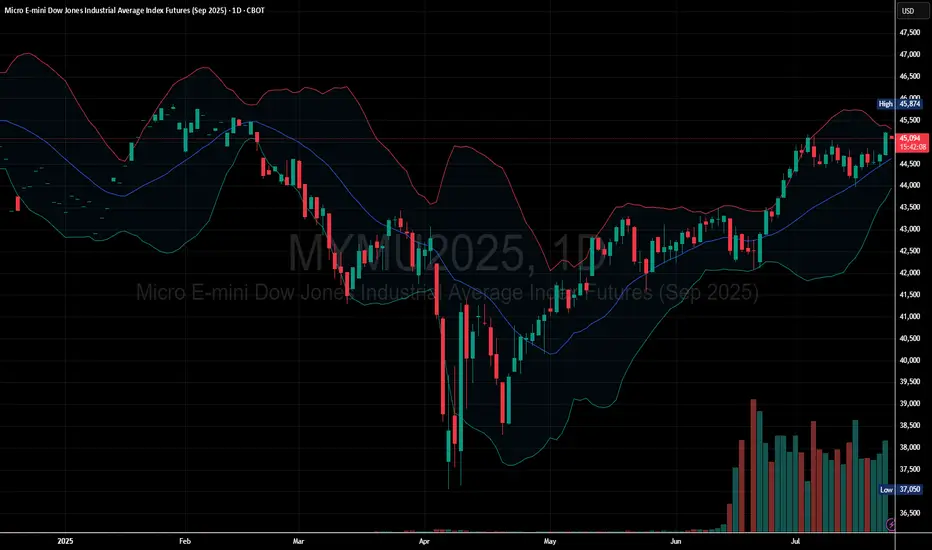
Buyers Dominate as Dow Micro Futures Push Higher
Price Above Moving Average: The current price is trading above the midline of the Bollinger Bands, showing bullish momentum.
Bands Expanding Upward: The Bollinger Bands are sloping upward, indicating increasing volatility in the direction of the trend.
Price near Upper Band: Price is near or hugging the upper band, which often signals strong bullish continuation.
Immediate Support: Around the middle Bollinger Band (~44,500 zone).
Next Resistance: Near recent highs around 45,100 – 45,200 area. If broken, this could trigger a breakout continuation.
Daytrading Risk Management Strategy Hold Until CloseAfter reviewing my past 500 trades, the absolute most profitable trade management is to hold until market close. If you study the daily chart, most days will close near the highs/lows of the bar.
By only using just a stop loss and no profit target, one can capture monster moves.
One trade per day, win or loss.
Wins will be small 1-2R wins or giant 3-8R wins
Losses will be small half R losses or simple 1R losses
5-10% of the trades should make up 90% of profits.
Most trading months offer around 8-10 really great setups on Dow Jones. The other 10-12 days should be on the sidelines in cash, waiting.
To really stay in the game, simple 1 or 2R wins WILL NOT cut it.
One has to pay for:
Small Losses
Commissions
Fees
Taxes
Spreads
End of Day Hold Until Close Trade Management maximizes profits and routinely produces 30-40R gains per month.
Go through your own past trades and see if holding until 4pm EST would have yielded substantially more profits vs what you have achieved with your current management. I know I did and I am floored.
Some Examples:
These are all trades that could have been taken. My point is if just using a simple 2 to 1, the profit would have been SUBSTANTIALLY LESS than Hold till Close.
Creeping Trend Into 750. Thursday Long Opportunity. My gameplan Thursday is to see how this creeping trend plays out. I am looking for the creeping trend to layer down into 750 near the lows of these 8 Hour candles.
Price is mean reverting around the 1000 level
Creeping trends resolve themselves in one of two ways. They capitulate and blow off in the direction of the trend or they reverse
Below I have outlined my entry criteria and I will see how price behaves at my level. If Long, I am targeting that swing high for roughly 380 ticks.
I will give an example of a creeping trend:
Another example:

DJIA – U.S. Stock Market Corrects UpwardTrend: Upward correction after rejection from 45,220.0.
Current price: 44,794.0.
⸻
Bullish scenario
• Entry: BUY STOP 45,280.0
• Target: 46,480.0
• Stop: 44,800.0
Bearish scenario
• Entry: SELL STOP 44,190.0
• Target: 42,880.0
• Stop: 44,800.0
⸻
Key levels
Support: 44,190.0, 42,880.0
Resistance: 45,280.0, 46,480.0
Indicators
• EMA (Alligator): still pointing upward, but narrow range.
• AO histogram: correctional bars just below zero.
⸻
📌 Breakout above 45,280.0 → continuation to 46,480.0. Failure and close below 44,190.0 → decline toward 42,880.0.
