DJ30Bears failed to take out an intraweek swing low, creating a lower high, eventually taking out a lower low creating a higher high, which confirms the beginning of a bull move to the equal highs.
YM1! trade ideas


dowjones : buystop on 3angel strongly advice NEVER sell on gold ,nasdaq ,dow ,sp500( love go up , 90% they go up ) main trend on daily chart is very very +++
US GDP comes good better than pervious month report = buy pressure (if big bad news not come)
dow upper target is fibo 161% 37000 (dow love fibo 61% and 161% too) , if you open sell 100% put sl= high or 80(never remove)

buy pinbar comes on dow daily despite today some down move (comes from germany dax) we dont advice sell , looking for buy and hold 7-8 day to new high
if you have sells, 100% put SL on today high , break 1 hour last high mean start of + trend to 37000
good luck ,never remove SL= week trader , eat SL show pro trader

Short YM 35580I was asked to give more meaningful descriptions. You know I am just an engineer and usually in my mailing lists I just write ‘long 100’ and at exit ‘flat 120’ without any explanation at all. Most signals are time critical so writing explanations would cost the costumers money. But I will try to give you a better understanding. My signals are generated by automated trading systems. So I often have to go into the source code to figure out what was the deciding factor for the signal. The systems generate about 10 to 20 signals a day so debugging can easily become a full time job. But in this case it was pretty simple to sort out what overruled the rivaling factors. It was a chart pattern that my colleagues and I named in german “hängender Schwanz”. I don’t know the exact translation but it means that the candlesticks show a period of preludium, followed by calmness with small candles in a clear trend, followed by a climax with high volume , a calm eye of the storm, followed by uncertainty, a reversion to a gradually falling slope and then an inversion into the opposite direction while repeating the whole move with reversed signs but some important differences. YM 35000+ was the eye of the storm. YM 34000 to 35000 was the uncertainty and now we flow into the inversion. FDAX is dominated by YM, so the same applies here adjusted by local factors like currency, time zone, monetary policy etc. The next few days into autumn will let us know if this is just a minor correction or a move over some month. During the first days of October we saw small rebounds. In November until today we saw a decoupling between Europe and the U.S. due to exchange rates and central bank policy. In the last couple of days this delta shrank again. Short YM 35580

Are you ready for dow=37000 ??? as predict 1week ago , dow touch 35000 area , now going to fly up to 37000
STRONGLY WE (me and my friend,big bank traders) ADVICE =until 37000 dont pick sell signals,,ok???? only ooking for buy in deep and hold it 7-8 day to new high
if you have buy,dont fear , daily trend will ++++ be patient
if you have sell , close now or pick hedge buy in deep size=2*total sell
good luck

Dow Jones and the apparent imbalance of market forces.The money has been made, a rally from mid October has pushed the market quite high at a steep slope.
However at this fever pitch, there are many indications that regardless of market fundamentals or traditional technical indicators and sentiments, history paints a particular picture of the present market. There is a notable parity between the CBOE put and call volume which shows that in previous instances, the outcome is quite clear. The current level depicted on the left (main chart above), shows an imbalance of these figures, and the actions which typically follow are all too clear. It is expected that the reader understands that this relates to standardized options and is familiar with put and call options.
In the highlighted sections, we see that these levels are pushed well outside of an average, or normal range. This means that there is an imbalance, as this chart is the put volume, minus the call volume. The image below shows the Dow at the second highlighted section on left pane. Notice their similarity to the current market
It would not be sufficient to say that simply because the Dows look similar on two charts, that the outcomes of will be equal, however it is clear that the market conditions show an underlying similarity based on the put and call volumes. We can say that in theory, that these extreme values had a significant impact on market activity.
Similarly we also see a marked decrease in interest from the bull, who has made his money and his power is clearly diminishing, and the balance of power may well violently shift. We don't know, but the odds are good enough.
These situations show that it is reasonable to take the position shown, and at least unreasonable to assume it is time to enter a long position, and that it would be apt to exit one. If we are incorrect, we take a minimal risk and protect our capital, but if we are correct, the target price will result in significant profits.

Short YM 35950The last signal wasn’t good. Happens. Even after this big drawdown the trade can end as a plus. Here at YM 35950 I got a new signal.

YM (dow) love move closedthe long entry on friday provided a low risk opportunity to trade the DOW with the same pattern as we saw on BNBUSDT last week.
go long on a monthly swing high, exit at last daily swing low.

YM - 1 Hour / Throw-Over of Momentum CloudAfter 3/3 Completed Friday, the Retracement was to be Anticipated.
What comes next will be Instructive as the AM Session was used
to shove the ES/NQ into the stratosphere.
This is WHEN we SELL and we did, 3X.
_____________________________________________________________
Cajones are required - IF you are re-arranging your Deck Chairs...
Huge Mistake.
I'll repeat our Manta - Patience.
Most traders blink at highs and move over to the Shuffle Board Court.
Why did you enter, to begin with, IF you are giving up?
Out over your Skis again?
Ladder in using Inverse strategies.
Same Strata, Different Day.
NO ONE is going to TIME this Perfectly...
______________________________________________________________
We closed out NQ x 16/64 from ~ 17632 after 16 Keepers 16610 were
Pressed hard. 48/48 remains with a Stop at .618.
Gaps to Fill... lots of them Below - 7 at present, they will Fill, the issue
is how you Position for it.
Short Dated options are just Silly. Gamma Squeeze after Gamma Squeeze...
We Pay for Time, as the Operators do.
Always.
______________________________________________________________
PATIENCE - Ask your Local "Dirty Monkey" - They'll agree.
UVXY is fast becoming a solid Position for those who are looking for the
entries.
VX Complex is being Bid, period, fill stop.
______________________________________________________________
The EU Sell was an easy trade today, hopefully you didn't miss it.

dowjones must see 35000 area in coming week if + big news not come , dow will see 35000 in green arrow we must put buylimit with sl=80 ok?
after open,we must dont close buy soon with little profit , we must wait 10-15 day until fibo 161%( new high minimum 36800 area )
if you have old sells , must close around 35000 and pick buy and wait 15 day until near 37000( dow in way to 40.000)
if you have buys(not for hedge buys),you can close around red arrow (support , EMA200 1hour) and wait until 35000
good luck , want you success

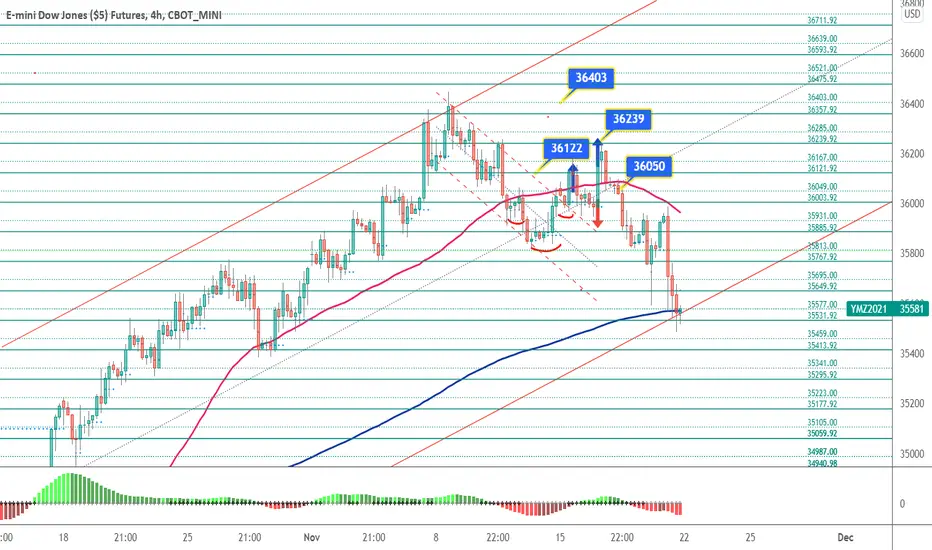
Dow Futures is down to a critical level around 35532
Dow Futures is down to a critical level around 35532
The recent bounce at 35885 was short-lived after it was rejected at 36239 estimates, as indicated in my previous analysis chart. The index fell from 36239, made attempts to hold at 35767 but failed and continued down to 35532, closing Friday's session around the 200 MA line.
Dow will face some challenges around the 200 MA line in blue and the support line at around 35532, and this will be an important level to watch in next week's session. Dow will need to hold at these critical levels to avoid further decline.
www.tradingview.com
YM - Daily / Weakening StructureLower Price Objective Front Run on Friday's Close.
Pinned to Expiry.
Lower 35100 Price Objective in Trade.
______________________________________________
DOW leading is never a good sign.
It is now in a 13/13 Count with a great many Gaps
below all the way down to 28.212.
34,200
33,700
33,100
31,013
The Larger Weekly TF POs.
______________________________________________
Traders find this difficult to Fathom.
It will depend on ob the Larger Count Structure we indicated
a few weeks back with respect to 4/4 complete or 3/3 Completing.
______________________________________________

Dow long got stopped out so I am only long nasdaq and ES nowClose below 18 moving avery line trigged my exit on YM long.

US30USD YM1! Dow 2021 Nov 22 Week
US30USD YM1! Dow 2021 Nov 22 Week
H4 chart shows market tracked the downtrend channel and met with
temporary support at 35550, a demand line of a larger uptrend channel.
1) If 35550 is broken and resisted, it may try 35250 // 35000
2) If market pushes downward of 35550 and returns to close above it,
there'll be long opportunity as the larger uptrend resumes.
Weekly: Average volume Average volume down bar = Weakness.
Daily = High volume down bar into previous resistance = weakness
H4 = Narrowing of spread bars and closing off low. There's buying into
the down move as market test a previous breakout area = Strength
will be confirmed if 35500 is supported.
Strategy for Long (Test and Accept)
Strategy for Short (Test and Reject)
Entry based on price reaction to the levels on YM1!:
37524 37100
36784 36446
36238 35988
35550 34948
34121 33718
33383 32906
Remember to like and follow if you find this useful.
Have a profitable trading week ahead. YM1!

