[AUDCHF] Trade ideaAdding more on this long position, the first one already payed off so let's see if we can have a swing position on the long side.
Great Trade !
CHFAUD trade ideas
AUDCHFThe market is currently at a valid order block will just triggered a buy position, buyers are active now.

AUDCHFAUDCHF price is in the key support zone. If the price can hold above 0.51716, it is expected that the price will rebound. Consider buying in the red zone.
🔥Trading futures, forex, CFDs and stocks carries a risk of loss.
Please consider carefully whether such trading is suitable for you.
>>GooD Luck 😊
❤️ Like and subscribe to never miss a new idea!

AUDCHF — WatchlistPrice is making a possible pullback into a mapped structure zone. The location looks good, but under VMS this is a “not yet”—Momentum and Volume still have a long way to go.
What I need to see (4H):
A clean engulfing candle at the level
Volume improving toward ~80+ (participation)
Momentum turning/aligning with the idea and holding
If/Then:
If we get engulfing + improving V/M and acceptance beyond the engulfing mid, I’ll treat it as a valid structure play to study.
If price breaks and closes through the zone against the idea, it’s invalid (off the table).
Education only—not financial advice or a trade recommendation.
🎥 More VMS breakdowns — link in bio.
#Forex #AUDCHF #VMS #PriceAction #Pullback #TradingEducation

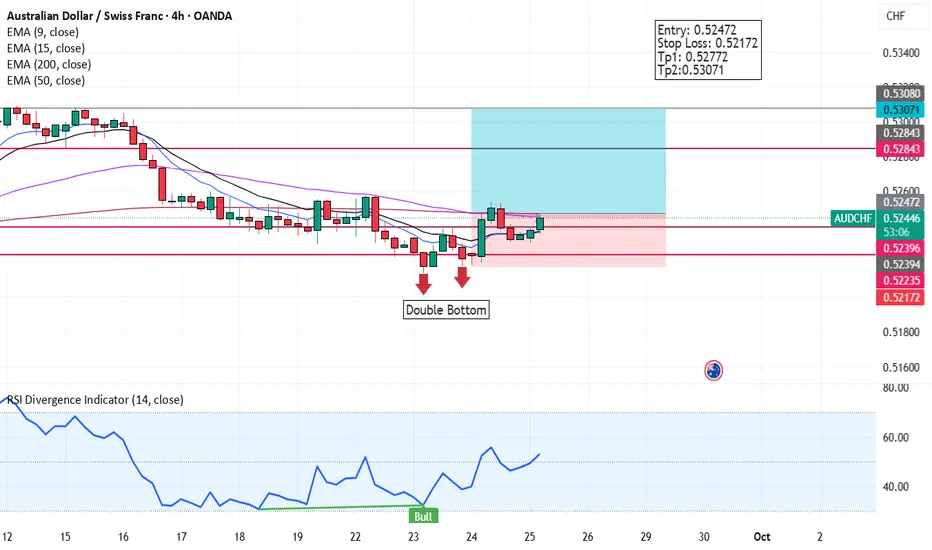
AUDCHF 4H Double Bottom|Breakout above 0.52537 in Focus AUDCHF has formed a potential Double Bottom reversal pattern on the 4-hour timeframe. Price tested the support zone twice near 0.52172 and rejected strongly, building a bullish structure.
🔹 Pattern: Double Bottom
🔹 Key Support Zone: Around 0.52172
🔹 Neckline Resistance: Around 0.52537
🔹 Current Entry: 0.52472
🔹 Bias: Bullish above support
Price is now trading just under the neckline. If buyers can secure a breakout and close above 0.52537, this would confirm the pattern and open the door for higher targets.
📈 Trading Plan (for educational purposes only):
#AUDCHF #Forex #DoubleBottom #ReversalPattern #PriceAction #4HChart #TechnicalAnalysis #BullishSetup #SupportResistance #ForexTrading
Entry: Taken at 0.52472
Stop Loss: Below 0.52172
Targets: First target near mid resistance, extended target toward full measured move of the pattern
⚠️ Risk management is crucial — this is an analysis, not financial advice.
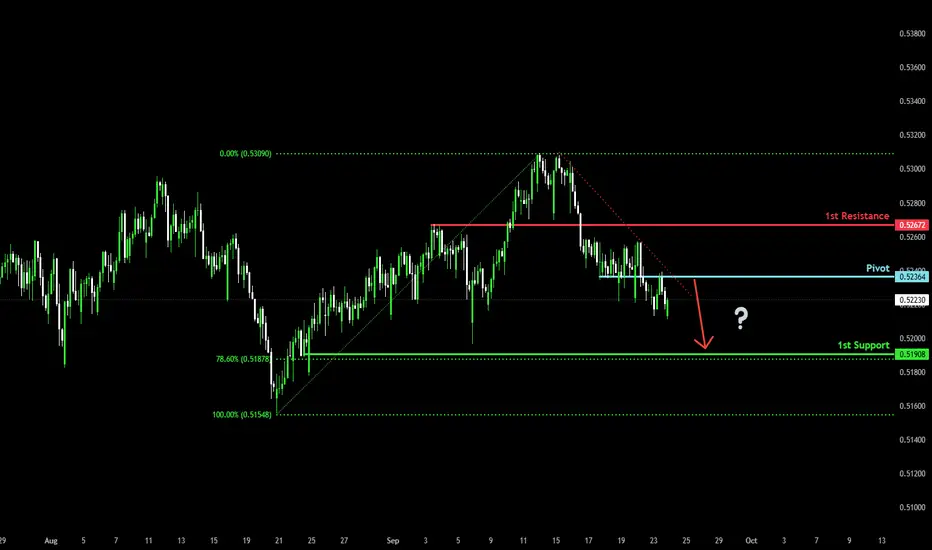
Bearish drop off?AUD/CHF has rejected off the pivot and oculd drop to the 1st support which aligns with the 78.6% Fibonacci retracement.
Pivot: 0.52364
1st Support: 0.51908
1st Resistance: 0.52672
Disclaimer:
The above opinions given constitute general market commentary, and do not constitute the opinion or advice of IC Markets or any form of personal or investment advice.
Any opinions, news, research, analyses, prices, other information, or links to third-party sites contained on this website are provided on an "as-is" basis, are intended only to be informative, is not an advice nor a recommendation, nor research, or a record of our trading prices, or an offer of, or solicitation for a transaction in any financial instrument and thus should not be treated as such. The information provided does not involve any specific investment objectives, financial situation and needs of any specific person who may receive it. Please be aware, that past performance is not a reliable indicator of future performance and/or results. Past Performance or Forward-looking scenarios based upon the reasonable beliefs of the third-party provider are not a guarantee of future performance. Actual results may differ materially from those anticipated in forward-looking or past performance statements. IC Markets makes no representation or warranty and assumes no liability as to the accuracy or completeness of the information provided, nor any loss arising from any investment based on a recommendation, forecast or any information supplied by any third-party.
Audchf ready to sky rocket buy Its like a cauldron ready to blow its top , only time from here will tell , big upwards moves in coming , be patient and thou shalt reap rewards 😀

AUDCHF 4 HOUR Potential Double TopAUDCHF Potential Double Top Wait for Confirmation
Bias
Double Top
Reversal
RSI Continuation
Entry and Stop Loss are given.
Trade Craefully.

AUDCHF BUY?Market is overall bullish on daily and weekly. Based on 4HR TF, the market seems to be forming a possible reversal pattern which could lead to a possible reversal.
We could see BUYERS coming in strong should the current level hold.
Disclaimer:
Please be advised that the information presented on TradingView is solely intended for educational and informational purposes only.The analysis provided is based on my own view of the market. Please be reminded that you are solely responsible for the trading decisions on your account.
High-Risk Warning
Trading in foreign exchange on margin entails high risk and is not suitable for all investors. Past performance does not guarantee future results. In this case, the high degree of leverage can act both against you and in your favor

AUD/CHF Bearish continuation after retracementI am still new to trading. However, based on my analysis, I see structure has been broken with HH and LL. This pair just broke structure and made a LL. So now I'm waiting for the pullback to that zone, then will be waiting for an entry on the 15min charts.
I'm also keeping in mind that it can break through that zone and continue going long!
Thank you and God Bless!

The trend is your friend… Oh hello friend… Can we take a bull ride?
As you can see. Levels have been broken. Trend is Headed north on all 3 timeframes 4h, D and 1W
Why fight it? Better to float with it. But also, as most (not all) experienced traders will say, “literally anything can happen” so we sit back and wait, Let’s see what happens….

AUD/CHF BULLS ARE GAINING STRENGTH|LONG
Hello, Friends!
The BB lower band is nearby so AUD-CHF is in the oversold territory. Thus, despite the downtrend on the 1W timeframe I think that we will see a bullish reaction from the support line below and a move up towards the target at around 0.525.
Disclosure: I am part of Trade Nation's Influencer program and receive a monthly fee for using their TradingView charts in my analysis.
✅LIKE AND COMMENT MY IDEAS✅

AUDCHF: Weak TrendMomentum is beginning to pick up on the AUDCHF pair. This is based on the EMA behavior along with price's behavior around the ATLs plotted. Here are my observations across two key timeframes.
Daily Timeframe:
Price crosses below ATL > first indication of momentum picking up
EMA20 is beginning to move away from EMA60 > second indication of momentum
H1 Timeframe:
EMA20 diverges away from EMA60 > indication of momentum
Price crosses below intraday HTL > confluence with overall downtrend if there isn't a liquidity trap

AUD/CHF (2H) SetupAnalysis:
After a strong downtrend, price is consolidating near support. A breakout above 0.5250 could trigger a bullish continuation toward 0.5287.
Re-entry if price comes back but bullish momentum is on pick
📈 Trade Plan:
Entry: 0.5250
Stop Loss: 0.5232
Take Profit: 0.5287
Bias: Bullish

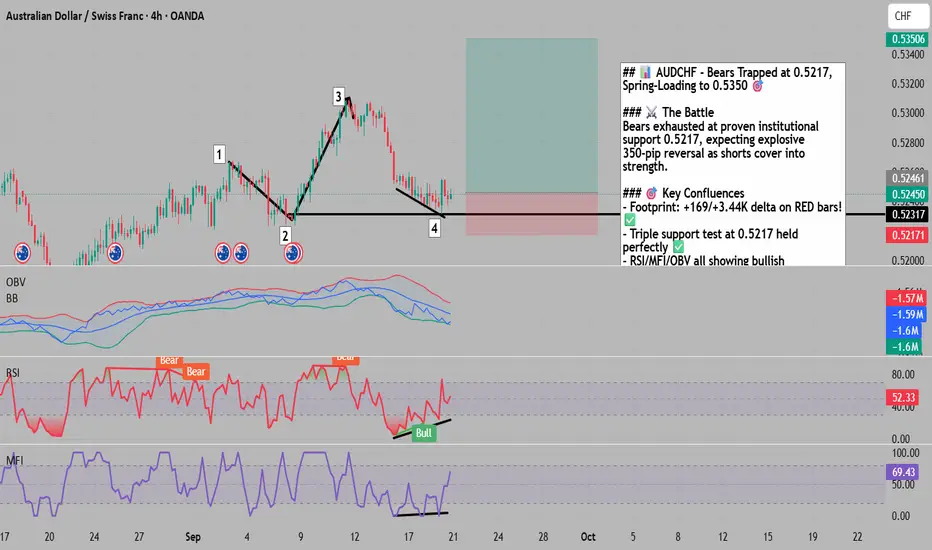
Bears Exhausted at 0.5217 - Bulls Spring-Loading for 350 Pips📌 To see my confluences and/or linework, step 1: grab chart, step 2: unhide Group 1 in object tree, step 3: hide and unhide specific confluences. 😊
The Market Participant Battle:
Bears have completely exhausted themselves pushing AUDCHF down to 0.5217, where proven institutional buyers from the initial accumulation zone (point 2) are aggressively defending their territory. The validation came when point 3 decisively closed above point 1 at 0.5280, proving these buyers have serious firepower. Now at point 4 (0.5217), we're witnessing a textbook spring setup where trapped bears are about to fuel a 350-pip explosion to our target at 0.5350. The Risk/Reward of 3.6:1 makes this a no-brainer institutional-grade setup! 🚀
Confluences:
Confluence 1: Volume Footprint & Delta Divergences 💪
The footprint chart reveals the hidden truth: massive bullish delta divergences with +169 delta at the lows! Those final red bars show Delta Total of 3.44K and 3.03K POSITIVE on DOWN bars - this is textbook accumulation disguised as selling. The large green reversal bar with 4.39K delta confirms aggressive institutional buying has begun. This isn't retail buying - this is smart money loading the boat while bears celebrate too early.
Confluence 2: Perfect Horizontal Support & VWAP Reclaim 📊
Multiple technical factors converge at exactly 0.5217:
- Historical horizontal support from multiple touches (visible across the 4H timeframe)
- VWAP from point 1 shows price dipped below but immediately reclaimed - classic bear trap
- The 0.5217 level has acted as a magnet 3 times previously, each time generating violent reversals
- Current bounce shows immediate rejection of lower prices with strong buying pressure
Confluence 3: Oscillator Divergences & Extreme Oversold 📈
- RSI: Clear bullish divergence - price made lower low at point 4, but RSI shows higher low (52.33 vs previous)
- MFI: Matching bullish divergence at 69.43, showing money flow increasing despite lower prices
- OBV: Touching lower Bollinger Band at -1.6M level, historically a powerful reversal signal
- All three indicators screaming the same message: selling is exhausted, reversal imminent!
Trade Setup Details:
- Entry: 0.52450 (current market)
- Stop Loss: 0.52090 (36 pips below, protected under demand zone)
- Take Profit: 0.53506 (106 pips above, 1.99% move)
- Risk/Reward: 3.6:1 (Exceptional!)
- Risk Amount: $750
- Potential Profit: $1900.86
Web Research Findings:
- Technical Analysis: AUDCHF trading at critical 0.5234 support, with next resistance at 0.5270-0.5285. ADX at 61.86 confirms strong trend potential ahead.
- Recent News/Earnings: Swiss franc weakening on U.S. tariff threats (39% potential tariffs mentioned). AUD supported by RBA's measured approach after 75bp of cuts in 2025.
- Analyst Sentiment: Mixed near-term, but technical traders noting oversold bounce potential from 0.5210-0.5220 zone.
- Data Releases: RBA at 3.60% with inflation at 2.7% (within target). SNB stuck at 0% with limited ammunition.
- Interest Rate Impact: Rate differential stabilizing as both central banks near their limits, reducing further downside pressure.
Layman's Summary:
Imagine a spring being compressed to its absolute limit - that's AUDCHF at 0.5217. The sellers pushed and pushed, but hit a concrete wall where big money defended successfully before. The smoking gun? Those red candles showing positive buying volume - it's like seeing buyers secretly loading up while pretending to sell. With a 3.6:1 reward/risk and multiple confirmations, this is the kind of setup institutions dream about. The bears are trapped, and when they realize it, the rush to cover will catapult price toward 0.5350! 🎯
Machine Derived Information:
- Footprint Analysis: Positive delta on red bars (+169, +3.44K, +3.03K) - Significance: Institutional accumulation under cover of selling pressure - AGREES ✔
- Support Structure: Triple test of 0.5217 with immediate rejections - Significance: Proven demand zone with high probability of reversal - AGREES ✔
- Risk/Reward Calculation: 3.6:1 ratio with clear invalidation - Significance: Professional-grade setup with asymmetric profit potential - AGREES ✔
- Oscillator Configuration: Triple divergence across RSI/MFI/OBV - Significance: Maximum oversold confluence rarely seen - AGREES ✔
Actionable Machine Summary:
Every technical system is flashing green! The footprint data shows institutions accumulating aggressively, the support level has proven itself multiple times, and momentum indicators are all diverging bullishly. With your stop protected below proven support and target at logical resistance, this setup offers institutional-grade risk/reward. The 3.6:1 ratio means you only need to be right 28% of the time to profit long-term - and this setup has much higher probability than that!
Conclusion:
Trade Prediction: SUCCESS ✅
Confidence: Very High
This is a textbook "bears trapped at support" setup with exceptional risk/reward. The combination of footprint divergences, proven support, momentum divergences, and a 3.6:1 R/R ratio makes this an A+ institutional setup. Your entry at 0.52450 is well-positioned, stop at 0.52090 is perfectly placed under support, and target at 0.53506 is realistic given the technical structure. This is the kind of trade that builds accounts!
AUDCHF: Heading To Support Zone!?AUDCHF have been on lower highs and lower lows, in regards to the yesterday daily candle the pair observed the resistance area and as expected it is moving down to the next partial support at a target of 0.5163.
meanwhile a confirmed breakout would trigger a move below the next support area.
Key Points;
To my fellow intraday traders this is an opportunity to short with target at 0.5225 as first Tp.
Like and follow up
Thanks for reading

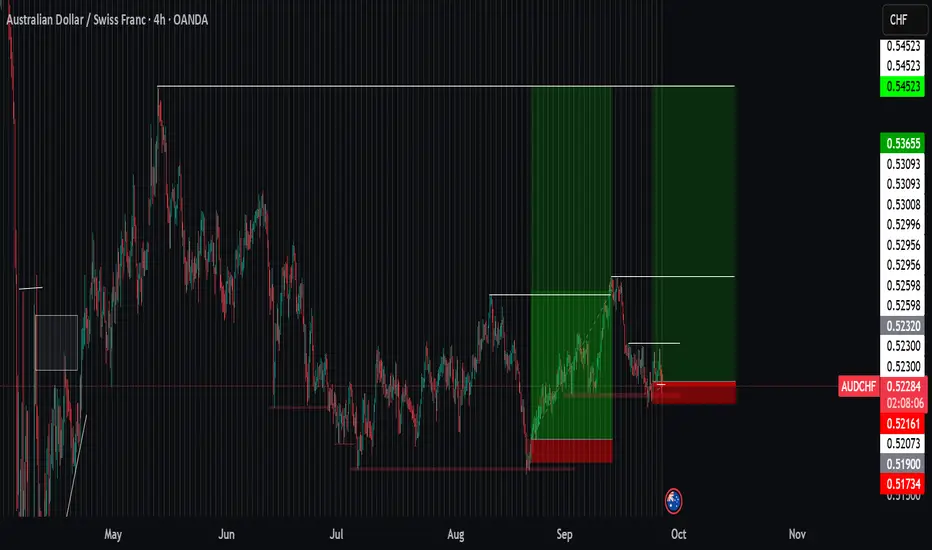
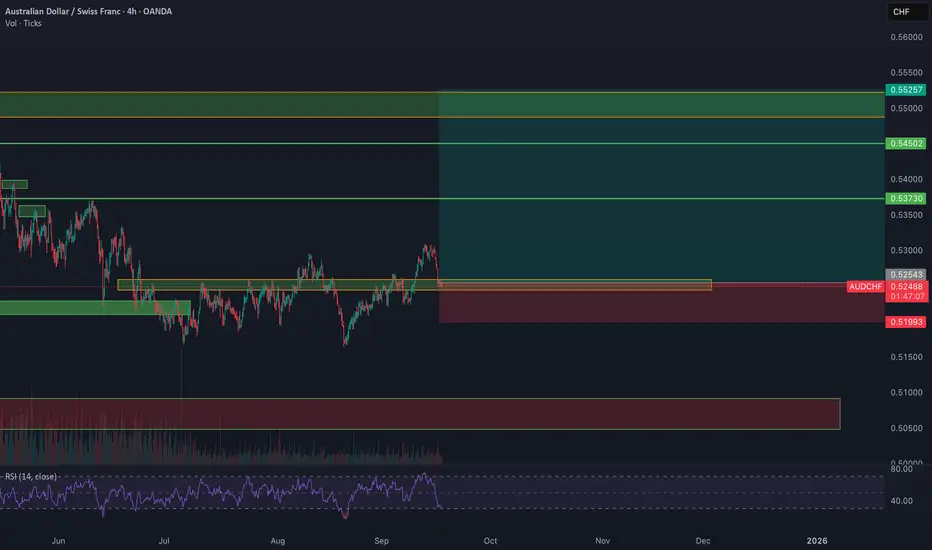
AUDCHF Swing Buys LoadingBeen eyeing this for a few days and it’s pulled back into this decent fib zone. Fundamentally gold is strong & commodity strength = AUD strength, and chf being a safe haven tends to follow the dollar & since we have dollar rate cuts coming (dollar bearish) it’s safe to assume some moderate chf easing to go with it. There is plenty of room for this to run up but if this area fails and fundamental conditions stay the same, lower entries can be entertained. Trade Safe, Trade Smart & Trade with Precision!

AUDCHF BUY ForecastAUDCHF New forecast👨💻👨💻
Note:
Follow proper risk management rules. Never risk more then 2% of your total capital. Money management is the key of success in this business...... Set your own SL & TP.
Please support this idea with a Like and COMMENT if you find it useful click "follow" on our profile if you will like these type of trading ideas delivered straight to your email in the future.
Thanks for your continued support!! lemme know your thoughts in the comment sec...

aud/chf making bullish breakthroughsAUD/CHF has passed many resistances and is making new supports. The pair appears to be on a downtrend on the weekly timeline however it has shown to be recovering from a more recent downtrend. I predict it could stay bullish until it hits the reaches 0.53320, which is the resistance area.


Buy AUDCHFAUDCHF Bullish Idea. Bullish flag on AUDCHF this Friday. Price broke upwards during the Australian Session but has given up the gains since the. As the week ends, price presents a bullish flag to end the already bullish week

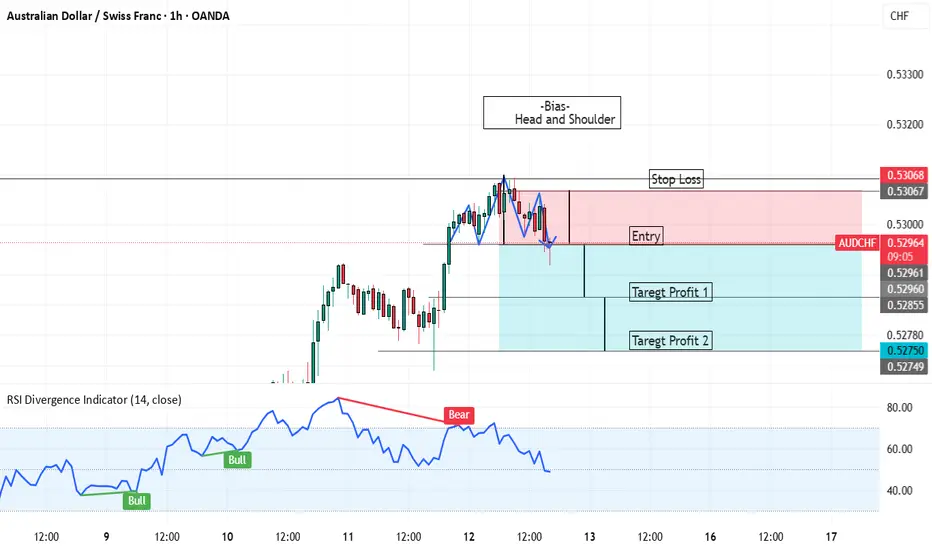
AUDCHF 1 HTF Short AUDCHF Short Making Head and Shoulder at top means reverse pattern entry and tps are mentioned trade with care.
Follow Risk Management
No Capital No Trade