CAD/CHF: One More Wave Ahead?!📈CADCHF is poised to continue its upward trajectory, reaching new highs.
A bullish breakout from the neckline of the ascending triangle pattern on the 4-hour timeframe indicates a strong trend-following bullish signal.
We anticipate with high probability that the price will soon reach the 0.5763 level.
Trade ideas

CAD/CHF SELLERS WILL DOMINATE THE MARKET|SHORT
CAD/CHF SIGNAL
Trade Direction: short
Entry Level: 0.573
Target Level: 0.570
Stop Loss: 0.575
RISK PROFILE
Risk level: medium
Suggested risk: 1%
Timeframe: 6h
Disclosure: I am part of Trade Nation's Influencer program and receive a monthly fee for using their TradingView charts in my analysis.
✅LIKE AND COMMENT MY IDEAS✅

Cadchf long!Since 2003 cad chf have been falling, trading in a channel. Now, we are at the lower boundary of that channel. I expect cadchf to buy towards 0.70000

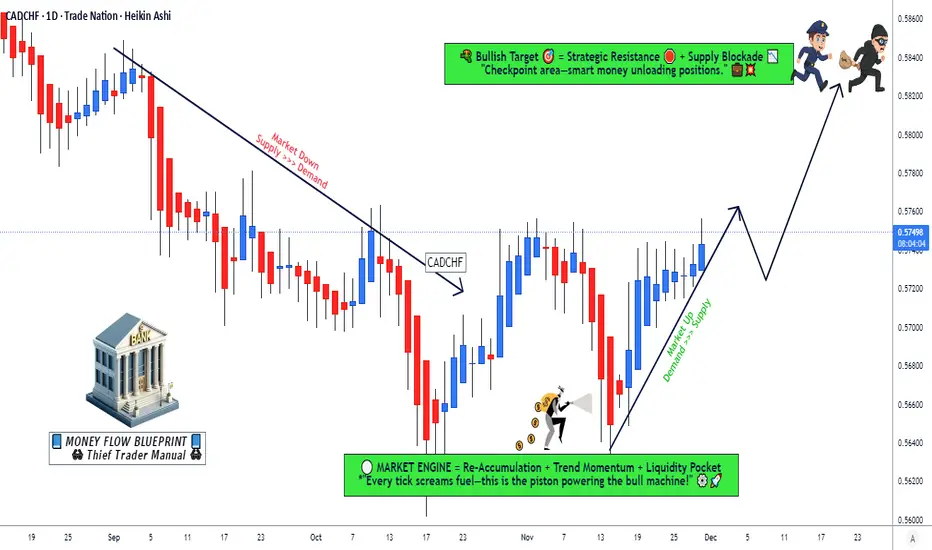
CAD/CHF Technical Roadmap for a Potential Upside Push📌 CAD/CHF Swing Trade — Thief Layer Strategy | Bullish Opportunity 🚀🇨🇦🇨🇭
Asset: CAD/CHF — “CANADIAN DOLLAR VS SWISS FRANC”
Market Type: Forex Swing Trade Setup
📈 Trade Plan (Bullish Bias)
This setup is based on Thief Strategy Layer Entries, a method that scales into the market using multiple limit orders to capture value zones and reduce average entry cost.
✅ Entry Plan — “Thief Layer Style”
Using multiple buy-limit layers, entering at:
0.56800
0.57000
0.57200
(You can increase or modify layers depending on your own market confidence and capital rotation.)
🛡️ Stop Loss (Manage With Discipline)
Thief SL: 0.56600
Dear Ladies & Gentlemen (Thief OG’s), adjust your SL according to your personal risk tolerance and strategy.
I am NOT recommending you to use my SL as your fixed level — protect your capital the way you see fit.
🎯 Take Profit (Escape With Profits)
Price faces moving-average resistance, overbought signals, and potential bull traps, so take profits without hesitation.
Primary TP: 0.58400
Again — this is NOT a fixed TP for you.
Make money and take money based on your own risk and your own timing.
📚 Market Logic & Why Bullish?
CAD is gaining momentum due to improved risk sentiment.
CHF weakness appears in correlated safe-haven flows.
Technical structure shows bullish demand zones aligning with MA support.
Layered buys allow high flexibility during any intraday volatility.
🔍 Related Pairs to Watch (Correlations & Key Notes)
💵 USD/CHF
When USD strengthens and CHF weakens, it often pushes CAD/CHF upward as well.
Watch for risk-on sentiment and U.S. macro prints — they indirectly drive CHF’s safe-haven behavior.
💵 CAD/JPY
A strong CAD here often confirms broad Canadian Dollar strength.
If CAD/JPY is bullish, it reinforces confidence in CAD/CHF longs.
💵 USD/CAD
If USD/CAD is falling, that means CAD is strengthening — supportive for CAD/CHF upside.
Oil prices also influence CAD heavily; rising oil generally lifts CAD.
💵 EUR/CHF
Good for tracking CHF strength/weakness cycles.
If EUR/CHF is climbing, that shows CHF weakening — positive for CAD/CHF bulls.
🔥 Final Words (Thief OG Style)
Stay patient. Let the layers fill.
Protect your capital. Book profits smart.
Trade your plan — not someone else’s emotions.
Update CADCHFThis currency pair has an interesting history on the weekly timeframe. If you check, you’ll see that from 2004 until now it has been in a downtrend, which is quite fascinating. Right now, these two touches you see represent the lowest price of CAD against CHF, and this area has no past data on the chart. That in itself is challenging because you have neither history nor future—it's just you and the market. Honestly, the only idea that comes to my mind for this chart is to apply a range strategy within the range that has formed. What would you do if you were in this situation?
Thank you for your support — boosting the post helps more traders see the analysis, grow our community, and learn from each other. 🙏📉

Update CADCHFA very strong and important resistance is located at **0.57400**, and the price is still reacting to it.
**Plan A**:
Rejection from the resistance level, similar to previous behavior on the chart.
Our target in this scenario would be the **0.56565** price area.
**Plan B**:
A breakout above the resistance.
Why is this our secondary plan? Because it goes **against the current trend**, and entering a long position requires **both candlestick confirmation and momentum confirmation**.
For now, the price is still struggling with the resistance, so we need to wait and see how it plays out.

CAD/CHF BEARS ARE STRONG HERE|SHORT
Hello, Friends!
CAD-CHF uptrend evident from the last 1W green candle makes short trades more risky, but the current set-up targeting 0.571 area still presents a good opportunity for us to sell the pair because the resistance line is nearby and the BB upper band is close which indicates the overbought state of the CAD/CHF pair.
Disclosure: I am part of Trade Nation's Influencer program and receive a monthly fee for using their TradingView charts in my analysis.
✅LIKE AND COMMENT MY IDEAS✅


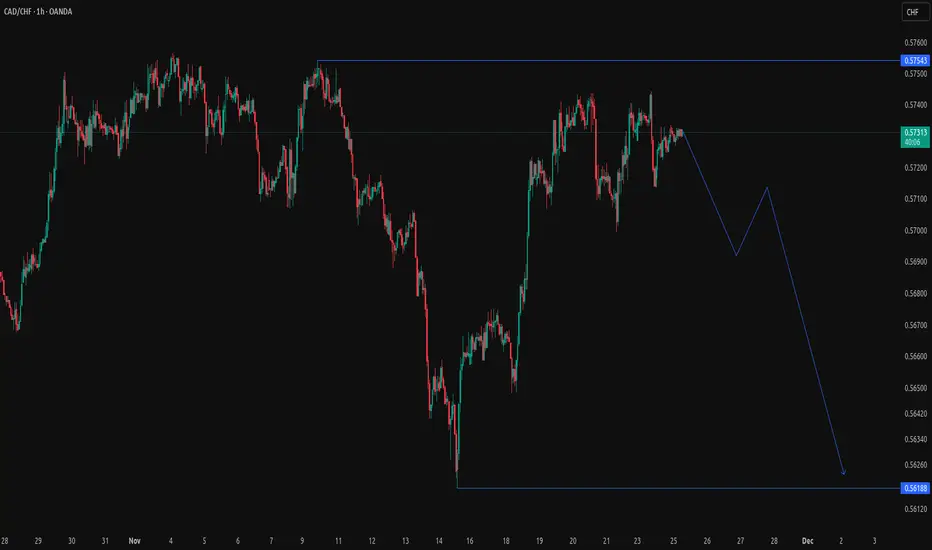
Update on CADCHFIn our weekly watchlist, the plan was to trade within the range — taking positions from the top of the channel down to the bottom.
If you’re already in a position, you should hold it toward the channel’s lower boundary.
If you’re still waiting for a trigger, a trendline break can provide a solid entry signal.
For now, the price is heavily interacting with the channel’s upper boundary, and as long as this level hasn’t been broken and confirmed above, we remain sellers.
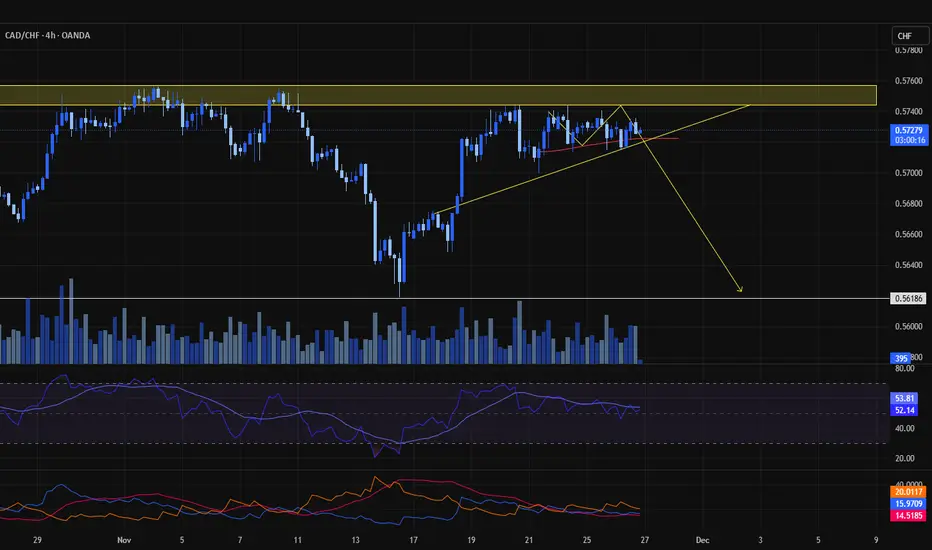
Update on the watchlist analysis CADCHFAccording to our watchlist, the price that has been trapped within the range has now reached the top of the range. Looking back, you can see the price tried several times to break the range resistance but failed.
Plan A (preferred): Wait for the price to move back to the bottom of the range and trigger our short entry, as the overall trend behind this range is bearish.
Plan B: If the range top breaks and is confirmed on the 4H timeframe (not lower), we can enter a long position.
Currently, the price has pulled back to the zone we identified, but the trigger has not yet fired.
You can either:
Place a sell stop so that if news causes a sudden big candle down, we don’t miss the trend.
Or set an alert and monitor closely.
Sell cadchfMedium news is coming out for the canadian dollar at 1.30gmt . Im hoping cadchf will sell and i have set my entry as i feel that its bearish
RSI is neutral at moment but could flip . Proceed with caution

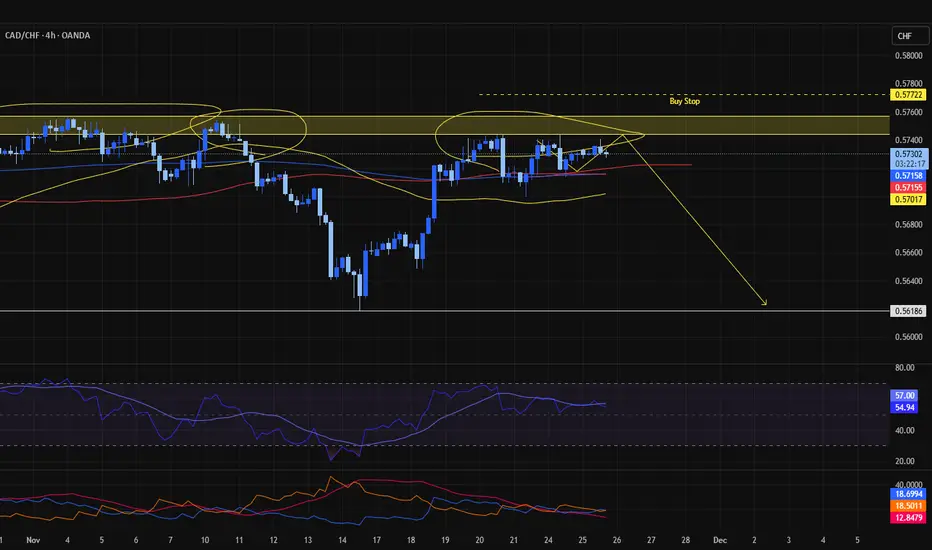
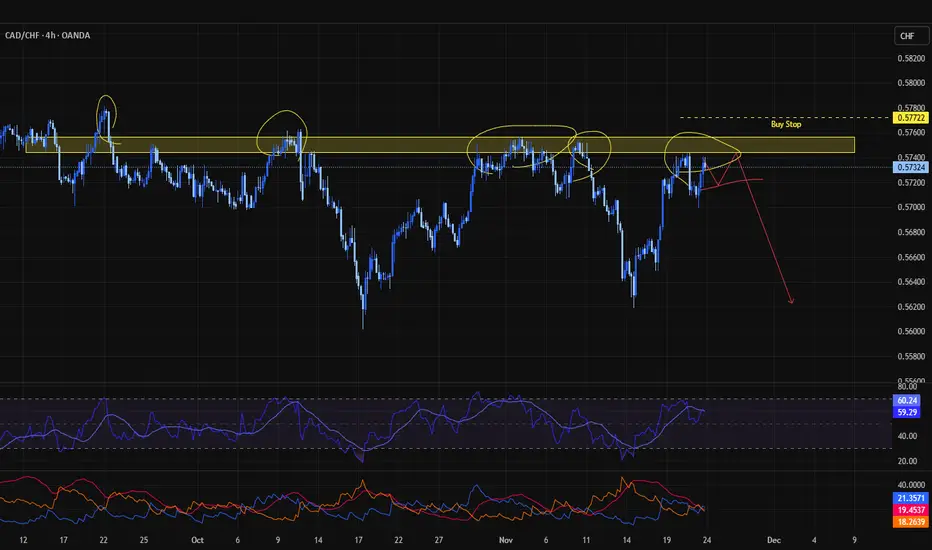
Weekly watchlist – Reviewing the setup on CADCHFAs you can see, we have a very strong resistance level that price has touched five times, and each time it has been rejected.
Our job now is to look at the higher-timeframe trend and make decisions based on the market’s past behavior.
📌 Plan A:
We expect another rejection from this resistance area.
If price reacts from this level and our trigger confirmation appears, we will consider taking a short position from the zone we marked.
📌 Plan B:
We place a Buy Stop above the resistance, because when price hits a level five times, that level gradually loses its strength.
I mentioned the Buy Stop because there is a chance price may break the level with a strong impulsive candle and not give us a pullback, leaving no opportunity to enter the market.
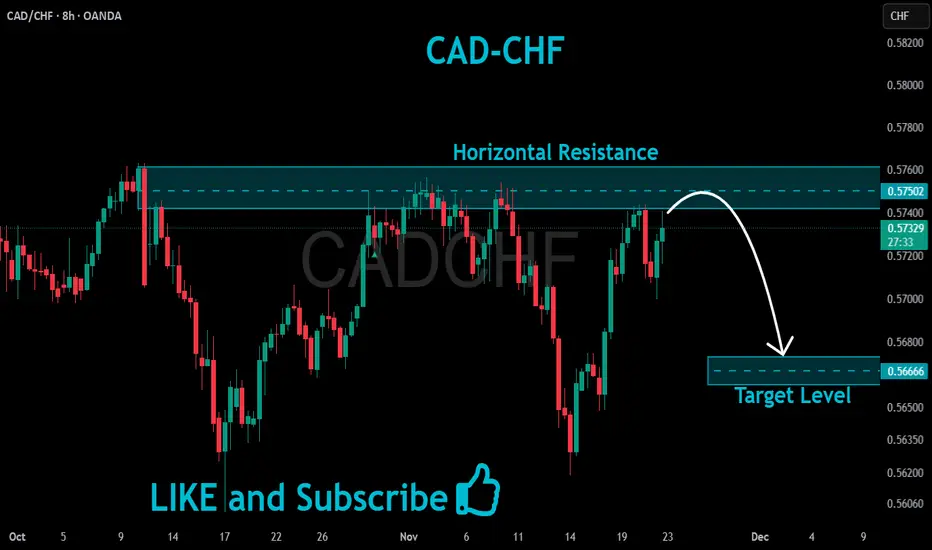
CADCHF Will Go Down!
HI,Traders !
#CADCHF keeps growing
But will soon hit a horizontal
Resistance of 0.57502 and as
The pair is locally overbought
So after the retest we will
Be expecting a local
Bearish correction !
Comment and subscribe to help us grow !
Update CAD/CHF analysisThis pair was on our watchlist from the start of the week, but the entry trigger didn’t activate. It seems likely that it will be triggered next week, and it will definitely remain on our watchlist for the upcoming week.

Update CADCHFThe trigger we had on this pair has now activated. With the rejection from the channel top, the trendline break, and then the pullback, all the triggers have been confirmed, and the position is valid. If the price decides to go back up, we’ll be dealing with probabilities again — but our position is very logical and well-

Update CADCHFSince our analysis yesterday, the price hasn’t changed much, and our outlook is still a short position toward the bottom of the channel. A break of the trendline that has formed, followed by a pullback, could give us a good trigger. If the price breaks to the upside instead, we’ll reassess the situation and decide at that moment whether to enter a long position or not.


CADCHF — 4H / 1H VMS BreakdownCADCHF has formed a clean triple top and printed a strong engulfing candle to the downside. Momentum is also aligned, pushing downward with clear divergence, which increases the probability of a reversal.
The challenge:
The engulfing candle formed outside of our ideal trading window, and current volume levels are not confirming yet.
1H Volume: 84 (needs to be stronger)
15M Volume: 80 (also below preferred threshold)
Momentum: Divergent and pointing down
Structure: Triple top confirmed
Trigger Candle: Already formed earlier, but volume did not follow through
Plan:
Wait for a stronger volume candle on any timeframe to validate the move.
If VMS fully aligns again, we will consider placing a limit order based on fresh structure.
Patience first. Execution second.
Not financial advice — just documenting my analysis and how I trade the VMS system.

CADCHFHello traders.
Today we’ll walk through a thoughtful market analysis, starting on the 15-minute timeframe.
A bullish trend is gradually forming, presenting a meaningful opportunity for a buy position — but as always, we approach it with confirmation, not haste.
Right now, price is advancing from the lower boundary of the Bollinger Bands, moving steadily toward the upper band.
This upward momentum is also supported by the RSI, which is aligning with the developing trend and reinforcing the probability of continuation to the upside.
If we look just below the current price, we notice a reliable support region — a zone where buying interest has previously shown strength.
Because of this, the likelihood of price breaking deeply beneath this area appears limited, adding confidence to our scenario.
Our next expectation is a measured move upward toward the resistance zone.
Within the ellipse marked on the chart, the potential entry and exit boundaries are defined — offering a structured area for trade planning rather than emotional decision-making.
At the end of this video, you can also observe the publication time of this analysis.
Remember — trading at its core is not about speed.
It’s about patience, clarity, and respecting structure.
Wishing you balance, discipline, and consistency in your trades.

CAD/CHF – Price Action Analysis (SELL Bias) Take Profit: 0.57171Institutional Technical Breakdown | All Sessions
CAD/CHF has activated a SELL signal driven entirely by Price Action, supported by pattern recognition from the last 200 bars and aligned with bearish structural flow. The pair is trading near a well-protected supply zone, where repeated rejections are signaling weakening buyer strength and increasing downside probability.
This is a clean, technically driven setup with no major news distortions.
📌 Signal Summary
Bias: SELL
Model: Price Action
Risk/Reward: ~1:2.5
Conditions: All Sessions
Volatility: Moderate & stable
The algorithm identifies consistent bearish reaction patterns when price approaches the current resistance zone.
📊 Technical Outlook
1. Price Action & Structure
Price is currently reacting below the 0.57535 – 0.57565 resistance band, which has acted as a strong intraday supply zone.
Upper-wick rejections indicate aggressive sell pressure at higher levels.
Candle structure is compressing — often a precursor to a decisive breakout toward the nearest liquidity pocket.
Market flow shows a lower-high formation, supporting continuation to the downside.
2. Momentum Alignment
Even though this is primarily a price-action signal, supporting indicators show:
Bearish divergence formation
Weakening bullish momentum
Increased probability of a downside break
This adds strong confluence to the bearish idea.
3. Market Context
CAD remains neutral-to-weak across cross-pairs.
CHF remains supported by safe-haven flows.
No major news for CAD or CHF, keeping this setup purely technical.
All sessions provide stable liquidity for execution.
📌 Key Technical Levels
Type Level
Immediate Resistance 0.57535
Immediate Support 0.57475
Major Resistance 0.57565
Major Support 0.57445
Price is currently sitting just below these resistance levels — ideal for a bearish continuation setup.
🎯 Trade Parameters
Entry Price: 0.57505
Stop Loss: 0.57671
Take Profit: 0.57171
The stop-loss placement is safely above major resistance, protecting the trade from short-term volatility spikes.
The take-profit level targets the next liquidity zone, aligning with the broader bearish rhythm.
🧠 Trade Rationale
Rejection from multi-layered resistance (0.57535 / 0.57565).
Bearish divergence confirms momentum failure.
Strong supply overhead restricting bullish expansion.
Clean liquidity void down to 0.57171.
Structural lower highs support continuation.
Overall, this setup represents a textbook bearish price-action continuation opportunity.
📉 Risk Management Recommendations
Use 1–2% risk per trade maximum.
Optionally take partial TP at 0.57445, the first liquidity shelf.
Enable trailing stop once price breaks below 0.57445.
If a candle closes above 0.57671, bearish bias becomes invalid.
📌 Analyst Conclusion
CAD/CHF shows a high-quality bearish setup backed by clean price action, structural confluence, and momentum alignment. As long as price stays below 0.57535–0.57565, downside continuation toward 0.57171 remains the most probable path.

CADCHF December 2025 fundamental analysisCAD/CHF in December 2025 is likely to trade sideways to mildly lower versus current late‑November levels, driven by a tentative bottoming in Canada’s cycle and a still‑cautious but strong Swiss franc backdrop. Overall, the fundamental picture points to a neutral‑to‑slight‑sell bias rather than a strong directional call.
Policy and macro backdrop
The Bank of Canada has cut its policy rate to 2.25% in October 2025 and has signalled that this may mark the end of the easing cycle, as inflation is near target but growth is weak, suggesting limited further downside for Canadian yields from here. Markets therefore see Canada moving into a wait‑and‑see phase rather than aggressive easing, which tends to stabilize the Canadian dollar after earlier rate‑cut pressure.
The Swiss National Bank has kept its policy rate around 0% and repeatedly emphasized willingness to act, including FX interventions or even a return to negative rates if needed, in order to maintain price stability and manage franc strength. This framework generally caps excessive CHF appreciation but keeps the franc structurally strong as a safe‑haven currency when global risk sentiment deteriorates.
CAD/CHF fair‑value and forecasts
Long‑term and algorithmic forecasts for CAD/CHF mostly cluster around the mid‑0.53 to mid‑0.57 area for December 2025, close to current levels, implying only modest directional bias. Several public forecasts show December 2025 averages or end‑month targets between roughly 0.536 and 0.574, reinforcing a range‑trading expectation rather than a clear trend.
Historical data for 2025 indicate that CAD/CHF has already traded significantly higher earlier in the year (above 0.63 at one point), but has since retreated toward the high‑0.5s, which reduces obvious valuation extremes going into December. This context suggests that while deep undervaluation is less evident, the pair is also not at the rich extremes seen earlier in the year.
Key drivers to watch
For CAD, any stabilization or rebound in global growth and commodities (especially oil) would support the currency, while confirmation that the Bank of Canada is indeed on hold would reduce rate‑differential headwinds. Conversely, renewed downside growth surprises or an additional unexpected cut in December would be negative for CAD.
For CHF, safe‑haven flows and SNB communication remain crucial: stronger risk sentiment or hints of discomfort with a too‑strong franc would argue for some CHF softness, whereas risk‑off episodes would keep CHF firm. Monitoring SNB’s December policy assessment and any reference to FX conditions is particularly relevant for short‑term trades.
Trading verdict for December 2025
Given the Bank of Canada likely pausing after cuts, SNB keeping rates at 0% with a bias to lean against excessive CHF strength, and most published CAD/CHF forecasts centering near current levels, the fundamental stance for December 2025 is mostly neutral with a slight bearish bias. Any position should be sized conservatively and paired with clear risk limits, as unexpected moves can still favour CAD in the short term.
